


To validate the Spanish Low Vision Qualify of Life (SLVQOL) questionnaire, a quality of life instrument specifically designed for patients with visual impairment, and evaluate its psychometric properties.
MethodsThe study included 170 visually impaired patients and 195 healthy subjects. Participants were administered the SLVQOL, the NEI VFQ-25, and the EQ 5D-5L questionnaires. Reliability, test–retest reproducibility, feasibility, and construct validity of the SLVQOL were assessed. The Generalized Partial Credit Model was used to fit the data and the performance of each item was characterized using category response curves and item information.
ResultsThe reliability of the SLVQOL was 0.981 (95% CI: 0.978–0.985). Test–retest reproducibility was good (ρ=0.864, P<.001). A cut-off point of 105 or 106 was optimal to detect visual impairment, with a sensitivity of 95.4% and a specificity of 91.8%. Construct validity was shown by the corresponding convergence or divergence correlations between the score of the SLVQOL and its dimensions and the overall and partial scores of the NEI VFQ-25 and the EQ 5D-5L. Item response theory analysis showed discrimination and information parameters ranging from 0.539 to 3.063 and from −1.894 to 1.074, respectively.
ConclusionThe SLVQOL was able to quantitatively assess and identify differences in the quality of life among patients with visual impairment and normal subjects. The evaluated psychometric properties suggest that this tool has excellent validity, internal consistency, and reproducibility, but may benefit from a reduction of the number of items.
With a progressively ageing population, the prevalence of blindness and visual impairment has increased worldwide in the recent decades.1 Vision loss and visual impairment have been associated with conditions such as age-related macular degeneration, diabetic retinopathy, myopia, glaucoma, or cataracts, which are more prevalent in developing countries.2,3 Visual care providers specialized in low vision commonly evaluate distant and near visual acuity, reading speed, comfortable reading time and fluidity, and contrast sensitivity.4 These measurements, however, do not provide information regarding the actual perception of patients of their conditions or their limitation to perform daily-life activities, which may present notable discrepancies as assessed by clinical tests.5,6 Patient reported outcomes are essential to improve communication between patients and professionals, and to assess the effectiveness of current and future treatments. Improving or maintaining the quality of life of patients should be the objective of any treatment. Hence their opinion and perspective should be considered when deciding an appropriate treatment.
Since the 1980s, there has been a rapid proliferation of new quality of life instruments and a flourishing literature on patient reported outcomes in the field of vision and ocular health. Vision-related quality of life has been assessed with non-vision specific questionnaires such as the EuroQol Research Foundation EQ 5D-5L,7 with generic instruments developed to cover multiple common vision threatening conditions that include the National Eye Institute Visual Function Questionnaire (NEI VFQ-25)8 or with questionnaires designed specifically for patients with selected conditions.9–16 Other researchers have developed tools to assess quality of life of patients with low vision.17–20 The LVQOL, developed in English by Wolffsohn and Cochrane in 2000,20 is currently one of the most widely used questionnaires by researchers in the field of low vision. It has been translated to and validated in Chinese,21 Thai,22 and Turkish.23 Recently, it has also been translated into Spanish by some of the authors of this manuscript following the methodology proposed by the International Society for Pharmacoeconomics and Outcomes.24,25
The aim of the present study was to validate the Spanish version of the LVQOL in a sample of patients with vision impairment, and a control group of healthy subjects, and thereby assess its psychometric properties in terms of reliability, validity and feasibility. In addition, the contribution of individual items to the measurement of the latent trait (vision related qualify of life) was assessed and item response theory (IRT) was employed to investigate item discrimination and information. Indeed, IRT, and Rasch psychometric assessments in general, are currently considered superior to Classical Test Theory (CTT) based methods, but may provide a more complex interpretative challenge to some clinicians. Therefore, the most significant results from CTT and IRT analyses are presented. The score of the Spanish LVQOL in this sample of patients was compared with that of a non-vision specific questionnaire (EQ 5D-5L) and with that of a vision-related, generic instrument (NEI VFQ-25), to allow testing for construct validity in terms of convergence, as well as divergence relationships.
Material and methodsA quantitative, cross-sectional, and multicentre study was conducted on participants attending a public hospital and a private clinic in Barcelona.
SubjectsA total of 365 consecutive patients participated in the study in order to replicate the original work of Wolffsohn and Cochrane.20 The study populations were recruited from patients attending ophthalmologic consultation at Hospital de la Esperanza, Parc de Salut Mar, a public hospital in Barcelona (n=257) and from Institut Català de la Retina—a private ophthalmology clinic located in Barcelona (n=108).
Patients from both groups were included in the study if they had stable visual parameters, defined by the absence of a clinically significant change in visual acuity (less than 0.1 logMAR) in the last six months. Patients with visual impairment were included in the study if their best-corrected distance visual acuity in the best eye was equal or inferior to 0.30 logMAR or 0.52 logMAR when recruited from a public hospital or a private clinic, respectively. Healthy patients from both institutions were included if they exhibited a best-corrected distance visual acuity equal or superior to 0.10 logMAR in the worst eye. According to the criteria set by International Classification of Diseases (ICD-10)26 and the Organización Nacional de Ciegos Españoles (ONCE), patients from the visual impairment group were classified as those with mild visual impairment (best-corrected visual acuity in the best eye equal or inferior to 0.30 logMAR and superior to 0.52 logMAR), those having low vision (values equal or inferior to 0.52 logMAR and superior to 1.00 logMAR), or those who have legal blindness (values equal or inferior to 1.00 logMAR).
This study was conducted in accordance with the latest version of the Declaration of Helsinki, following approval of the ethical review board of the Parc de Salut Mar and the Research Commission of the Institut Català de la Retina. A signed informed consent was obtained from all the participants, prior to their enrolment in the study.
QuestionnairesThree different quality of life questionnaires were administered: the LVQOL, the NEI VFQ-25 and the EQ 5D-5L. The LVQOL questionnaire consists of 25 items grouped in four dimensions—Far vision, mobility, and lighting, including elements such as “to watch television (distinguishing images),” Adaptation, comprising of elements such as “unhappy with your situation in life,” Reading and precision work, that includes items such as “to read labels (for example, medicine containers),” and Activities of daily life, composed of items such as “to read your own letter.”20,27 The response options range from 0 to 5 (5 steps) with 0 indicating that the patient can no longer perform the activity due to their vision impairment, and 5 denoting the absence of sight-related difficulty with the task. Patients may also mark a task as “N/A” on the questionnaire implying that it is not performed for non-vision related reasons. A single overall score is obtained by adding the numerical score for each answer in the items (an answer marked as N/A is allocated the average score of the questionnaire to avoid bias of the results) and ranges between 0 and 125. The recent Spanish translation of this questionnaire (SLVQOL) was used in this study.24
Despite a certain lack of consensus, the NEI VFQ-25 is currently considered the gold standard in the field of vision by many researchers.8 It was developed from various vision related functional groups, including patients with glaucoma, macular degeneration, cataracts, and other pathologies, with the aim of obtaining a universal tool that could be employed in all patients with a visual deficit regardless of cause. In its original version (NEI-VFQ), this instrument consisted of 51 items, currently reduced to 25 items, grouped in 13 dimensions that include General health, General vision, Ocular pain, Near vision, Distance vision, Vision-specific social functioning, Vision-specific mental health, Expectations for visual function, Vision-specific role functioning, Dependency due to vision, Driving, Peripheral vision, and Color vision. A score may be obtained for vision-related quality of life for each of the dimensions ranging from 0 (worst) to 100 (best), and an overall score can also be calculated. The validated Spanish version of the NEI VFQ-25 was used in this study.28
The EQ 5D-5L is a general health econometric instrument widely used in population surveys, including the National Health Survey in Spain, the Catalan Health Survey, and the English National Health Service, to monitor the impact of certain pathologies.7 It explores five dimensions (Mobility, Self-care, Usual activities, Pain/discomfort, and Anxiety/depression) at five graded levels ranging from “no problem in that dimension to “extreme problems.” It also includes a final question with a Visual Analogue Scale in which patients must rate their current health status from 0 (worst imaginable health status) to 100 (best imaginable health status). The validated Spanish version of the EQ 5D-5L was used in this study.29
MethodologyPatients underwent a complete anamnesis, an optometric, and an ophthalmological examination (visual acuity, slit-lamp examination, intraocular pressure assessment and fundus examination under dilation). The sociodemographic and visual information documented for the purpose of this study included age, sex, highest achieved educational level, living status (whether patients lived alone), and best-corrected distance visual acuity of the best and worst eye. Patients from the public hospital sub-sample responded to three questionnaires (SLVQOL, NEI VFQ-25 and EQ 5D-5L) administered in a random order through a telephone interview. Patients from the private clinic completed the SLVQOL alone during a face-to-face interview. In addition, to evaluate the test–retest reproducibility of SLVQOL, this tool was re-administered to 119 patients with visual impairment at the public hospital approximately 15 days after the first administration. Only responses from patients providing a negative answer to the question “Has your vision changed since you completed the first questionnaire?” were included in the reproducibility analysis (n=73).
Statistical analysisThe IBM Statistical Package for the Social Sciences (SPSS) Statistics v.25 (IBM Corp. NY, US), Stata/IC v.13.1 (StataCorp LLC, TX, US), and R v.3.5.1 (R Foundation for statistical computing, Vienna, Austria) were used for statistical analysis. For statistical purposes, visual acuity outcomes were transformed from decimal notation to logMAR (2 logMAR corresponded to being able to count fingers at two feet; 3 logMAR corresponded to being able to detect hand movement at two feet). The Shapiro-Wilk test was used to test the normality of the quantitative numerical data recorded for the assessed parameters. Sociodemographic and clinical data of the whole sample and of each sub-sample was presented as absolute and relative frequencies, mean±standard deviation (SD), or range when appropriate. For inferential statistics, the Student’s t-test was used for quantitative variables. When normality could not be assumed, the corresponding nonparametric test was performed. For categorical variables, the Chi-squared test or the Fisher's exact test was used based on the fulfilment of the criteria for the use of these tests. Receiver operating curve (ROC) analysis was used to determine the optimal cut-off point to define visual impairment in terms of sensitivity and specificity.
The reliability of the SLVQOL was estimated from the whole sample using the Cronbach's alpha, and the test–retest reproducibility was determined by employing the Spearman correlation coefficient (ρ) analysis. Construct validity was investigated through correlation analysis between clinical and/or sociodemographic variables, the scores of each of the dimensions of the SLVQOL, and between the results of the SLVQOL and those of the other two questionnaires.
Sample size was determined using the freely available online sample size and power calculator GRANMO (v7.12, April 2012; https://www.imim.cat/ofertadeserveis/software-public/granmo/; last accessed September 2019). An LVQOL score of 100.3±20.8 (mean±SD) was defined as derived from previous research findings on healthy patients,20 and a change of 10% or more was assumed in patients with visual impairment. Thus, a minimum sample size of 126 participants from each group was determined, considering a type I error of 0.05 (alpha) and a statistical power of 80% (1-beta). P<.05 was considered as the cut-off point of statistical significance.
As noted above, the LVQOL was originally intended as a single dimension questionnaire providing an overall score from the summation of partial item scores. On that premise, the translated SLVQOL was considered a mono-dimensional scale and item response theory (IRT) analysis was employed to determine the contribution of individual items to the measurement of the latent trait (defined as the dependent variable vision related qualify of life). Firstly, factor analysis was used to estimate the degree of association of items with the latent trait, considering acceptable values those over 0.4.30 Secondly, a Generalized Partial Credit Model (GPCM)31 was used to evaluate item discrimination capacities, that is, measurement quality, category response thresholds (to assess monotonicity or uniformity), as well as item information. The GPCM was fitted to the data via maximum likelihood estimation using the mirt package for R.32 Model fit was assessed using Zh and S–X2 goodness-of-fit statistics, calculated in mirt.33 Briefly, the Zh index is a normalized measure of the likelihood of obtained responses to an item and it approximately follows a normal distribution, with values ranging from −1 to 1. In addition, an S–X2P<.05 is indicative of poor fit. Finally, Category Response Curves (CRCs), which describe the probability of observing a particular response as a function of the latent trait (in this case, questionnaire score on vision related quality of life), and item information plots, were generated with mirt to reflect the fitted model parameters.
ResultsThe study sample from the public hospital included 119 patients (46.3%) with visual impairment and 138 healthy subjects (53.7%) as a control group, whereas the sample from the private clinic comprised of 51 patients (47.2%) with visual impairment and 57 healthy subjects (52.8%). The sociodemographic characteristics of the 365 patients who completed the SLVQOL are shown in Table 1 and are classified based on the centre of recruitment, and the visual health status. The age of the patients was 78.8±10.0 years (mean±SD) for the visual impairment group (n=170) of whom 47.7% were men and 52.3% were women. For the group of healthy participants, the mean age was 68.7±11.5 years (n=195) and comprised of 42.1% men and 57.9% women. The gender distribution was similar between both groups (P>.05). Patients with visual impairment were significantly older than the healthy patients (P<.001). Of all patients with visual impairment, 32.4% (n=55) were classified as having mild visual impairment, 38.8% (n=66) as having low vision, and 28.8% (n=49) as legally blind.25 As expected, given the inclusion criteria, patients from the private clinic had characteristically higher educational levels and more severe forms of visual impairment than those recruited from the public hospital. Patients with visual impairment showed a significantly lower educational level than healthy subjects (P<.001).
Demographic characteristics of the visual impairment and healthy groups based on recruitment centre (public hospital and private clinic).
| Public hospital | Private clinic | Overall | ||||
|---|---|---|---|---|---|---|
| Visual impairment | Control | Visual impairment | Control | Visual impairment | Control | |
| n | 119 (46.3) | 138 (53.7) | 51 (47.2) | 57 (52.8) | 170 (46.6) | 195 (53.4) |
| Mild visual impairment | 48 (40.3) | 7 (13.7) | 55 (32.4) | |||
| Low vision | 46 (38.7) | 20 (39.2) | 66 (38.8) | |||
| Legal blindness | 25 (21.0) | 24 (47.1) | 49 (28.8) | |||
| Age (years) | 79.0±8.1 | 73.2±5.6 | 78.4±13.5 | 57.8±14.6 | 78.8±10.0 | 68.7±11.5 |
| Significance | P<.001 | P<.001 | P<.001 | |||
| Male | 56 (47.1) | 59 (42.8) | 25 (49.0) | 23 (40.4) | 81 (47.7) | 82 (42.1) |
| Female | 63 (52.9) | 79 (57.2) | 26 (51.0) | 34 (59.6) | 89 (52.3) | 113 (57.9) |
| Significance | P>.05 | P>.05 | P>.05 | |||
| Without studies | 35 (29.4) | 15 (10.9) | 8 (15.7) | 1 (1.8) | 43 (25.3) | 16 (8.3) |
| Elementary school | 67 (56.3) | 68 (49.3) | 24 (47.1) | 6 (10.5) | 91 (53.5) | 74 (37.9) |
| High school | 11 (9.2) | 26 (18.8) | 11 (21.5) | 21 (36.8) | 22 (12.9) | 47 (24.1) |
| University or higher | 6 (5.1) | 29 (21) | 8 (15.7) | 29 (50.9) | 14 (8.3) | 58 (29.7) |
| Significance | P<.001 | P<.001 | P<.001 | |||
| Lives alone | 39 (32.8) | 36 (26.1) | 9 (17.6) | 8 (14.0) | 48 (28.2) | 44 (22.6) |
| Does not live alone | 80 (67.2) | 102 (73.9) | 42 (82.4) | 49 (86.0) | 122 (71.8) | 151 (77.4) |
| Significance | P<.001 | P<.001 | P<.001 | |||
Categorical variables are expressed as number (%) and continuous numerical variables are expressed as mean±standard deviation. Student's t-test was conducted for continuous numerical variables and the Chi square test and the Fisher's exact test for categorical variables. P< 0.05 was considered statistically significant.
Patients with visual impairment had dry (25.3%, n=43) or exudative (32.9%, n=56) age-related macular degeneration, cataracts (28.2%, n=48), glaucoma (11.2%, n=19), diabetic retinopathy (8.8%, n=15) or other pathologies (12.9%, n=22). Table 2 shows the visual function of study subjects belonging to both groups represented as the geometric mean of the best-corrected distance visual acuity of the best and worst eyes (in logMAR notation). A statistically significant difference in visual function was observed between the visual impairment group and the healthy group in the entire study population and also by considering the two recruitment centres separately (P<.001 for all).
Visual function characteristics of the visual impairment and healthy groups shown as best-corrected distance visual acuity of best and worst eyes (logMAR notation).
| Public hospital | Private clinic | Overall | |||||
|---|---|---|---|---|---|---|---|
| Visual impairment | Control | Visual impairment | Control | Visual impairment | Control | ||
| Best-corrected distance visual acuity of best eye (logMAR) | Geometric mean | 0.575 | 0.061 | 0.901 | 0.108 | 0.655 | 0.065 |
| Range | 0.3 to 2 | −0.079 to 0.155 | 0.5 to 3 | −0.1 to 0.2 | 0.3 to 3 | −0.1 to 0.2 | |
| Significance | P<.001 | P<.001 | P<.001 | ||||
| Best-corrected distance visual acuity of worst eye (logMAR) | Geometric mean | 1.050 | 0.073 | 1.670 | 0.159 | 1.200 | 0.079 |
| Range | 0.3 to 3 | −0.079 to 0.222 | 0.7 to 3 | −0.1 to 0.2 | 0.3 to 3 | −0.1 to 0.222 | |
| Significance | P<.001 | P<.001 | P<.001 | ||||
Visual acuity is shown as geometric mean and range (minimum to maximum). Student's t-test was used to compare the results and P<0.05 was considered statistically significant.
Table 3 depicts the overall score of the SLVQOL, as well as the score of each of the four dimensions of the instrument, split by visual health status and by recruitment. All SLVQOL scores (overall and for each dimension) were significantly lower in the visual impairment group than in the healthy group (P<.001 for all). As a whole, patients with visual impairment had a SLVQOL score of 66.9±23.2, which was 50 points lower than the score of 117.2±6.7 in the healthy group. Of the four dimensions of the SLVQOL, the largest difference between groups was detected for Reading and precision work, followed by Activities of daily life. Questionnaire scores in the public hospital sub-sample were significantly higher than those obtained from the private clinic setting (P<.001 for all), except for the dimension Reading and precision work. In general, patients from the private clinic reported poorer levels of quality of life, related to lower visual acuity and higher level of visual impairment. The outcomes of the NEI VFQ-25 and the EQ 5D-5L are provided as supplementary material.
Spanish Low Vision Quality of Life Questionnaire (SLVQOL) scores (overall and for each dimension) of the study sample based on their visual health status (visual impairment and healthy) and recruitment centre (public hospital and private clinic).
| SLVQOL score | ||||
|---|---|---|---|---|
| Mean±SD | Mean±SD | Difference | Significance | |
| SLVQOL | ||||
| Visual impairment (Public hospital vs Private clinic) | 71.3±25.5 | 56.7±11.6 | 14.6 | P<.001 |
| Visual impairment vs healthy (both centres) | 66.9±23.2 | 117.2±6.7 | 50.3 | P<.001 |
| Far vision, mobility and lighting | ||||
| Visual impairment (Public hospital vs Private clinic) | 75.3±23.7 | 58.0±14.0 | 17.3 | P<.001 |
| Visual impairment vs healthy (both centres) | 70.1±20.8 | 115.5±7.3 | 45.4 | P<.001 |
| Adaptation | ||||
| Visual impairment (Public hospital vs Private clinic) | 34.5±10.2 | 27.1±8.8 | 7.4 | P<.001 |
| Visual impairment vs healthy (both centres) | 32.3±9.8 | 45.9±3.0 | 13.6 | P<.001 |
| Reading and precision work | ||||
| Visual impairment (Public hospital vs Private clinic) | 43.8±38.2 | 40.2±14.9 | 3.6 | P=.37 |
| Visual impairment vs healthy (both centres) | 42.7±31.2 | 114.5±10.4 | 71.8 | P<.001 |
| Activities of daily life | ||||
| Visual impairment (Public hospital vs Private clinic) | 68.5±34.9 | 49.2±20.1 | 19.3 | P<.001 |
| Visual impairment vs healthy (both centres) | 62.7±30.5 | 122.6±6.1 | 59.9 | P<.001 |
SD=Standard deviation. The score of the subscales has been transformed into a scale from 0 to 125 to aid in comparison. Student's t-test was used to compare the results and P<0.05 was considered statistically significant.
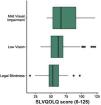
The average SLVQOL score obtained by patients with visual impairment according to their classification into mild visual impairment, low vision and legal blindness is presented in Table 4 and shown in Fig. 1. A not statistically significant tendency for higher quality of life was found in patients with mild visual impairment than those with low vision (score difference of 6.86, P=.09). In contrast, patients with low vision had a significantly higher SLVQOL score than those with legal blindness (score difference of 10.94, P=.006). Similarly, patients with mild visual impairment obtained a significantly higher score than those classified as legally blind (score difference of 17.81, P<.001).
Spanish Low Vision Quality of Life Questionnaire (SLVQOL) score of patients with visual impairment (n=157) according to their visual acuity (mild visual impairment, low vision and legally blind).
| SLVQOL score | ||||||
|---|---|---|---|---|---|---|
| Mean | SD | Confidence interval (95%) | Minimum | Maximum | ||
| Mild visual impairment | 72.4 * | 24.1 | 25.2–119.6 | 43 | 122 | |
| Low vision | 66.2 & | 22.6 | 21.9–110.5 | 33 | 122 | |
| Legal blindness | 55.3 *, & | 14.4 | 13.8–83.5 | 16 | 97 | |
SD=Standard deviation. The score of the SLVQOL may range from 0 to 125. The lower the score, the lower the reported quality of life. * and & denote statistically significant differences between the groups (P<0.05).

Statistically significant moderate correlations were observed between best-corrected distance visual acuity of the best (r=−0.404, P<.001) and worst (r=−0.406, P<.001) eyes, with the SLVQOL score of patients with visual impairment. The highest correlation between visual acuity and SLVQOL scores (r=−0.473, P<.001) was obtained when considering the weighted arithmetic mean of the best-corrected visual acuity of both eyes (75% best eye and 25% worst eye). ROC analysis revealed a cut-off score of 105 or 106 as optimal for the classification of visually impaired patients and healthy subjects, with a sensitivity of 95.4% and a specificity of 91.8%.
ReliabilityThe global reliability of the SLVQOL, estimated by Cronbach's alpha for the entire study sample, was 0.981 (95% CI: 0.978–0.985). The mean values for each of the four original dimensions were calculated as 0.971 (95% CI: 0.965–0.976) for Far vision, mobility and lighting, 0.857 (95% CI: 0.824–0.885) for Adaptation, 0.970 (95% CI: 0.964–0.976) for Reading and precision work, and 0.953 (95% CI: 0.943–0.962) for Activities of daily living. The test–retest reproducibility was assessed for a sample of 73 patients with visual impairment who reported no changes in their vision. On performing a retest after 19.5 days (±5.07 days), the calculated Spearman correlation coefficient ρ was 0.864 (P<.001).
FeasibilityFeasibility explored the practicality of questionnaire administration. The time taken to administer the questionnaire for the group with visual impairment at the public hospital (telephone interview) was 393.5±73.1s (95% CI: 274–600s). This was much longer than that taken for subjects attending the private clinic (face-to-face interview) (290.0±68.7s; 95% CI: 182–525s). Administration times for the healthy group were 345.8±48.5s (95% CI: 215–479s) at the public hospital and 181.0±40.4s (95% CI: 110–275s) at the private clinic. For both recruitment centres, patients with visual impairment required a significantly longer time than healthy subjects to answer the questionnaire (P<.001 for all). Also, face-to-face interview resulted in a significantly shorter administration time for the questionnaire than a telephone interview for both the groups (P<.001 for all).
ValidityConvergent correlations were found between the dimensions Self-care (r=0.41) and Usual activities (r=0.73) of the EQ 5D-5L and the SLVQOL scores. The rest of the dimensions of the EQ 5D-5L showed divergent correlations with the SLVQOL. Convergent correlations were also observed between the overall score of the SLVQOL and that of the NEI VFQ-25, as well as between the scores for each of the dimensions of both questionnaires (r ranged from 0.58 to 0.96). However, the score for the dimension Ocular pain alone showed weak divergence (r=−0.23).
Item response analysisOutcomes of the factor analysis and the GPCM analysis are summarized in Table 5. With the exclusion of Item 16, factor loading values ranged from 0.302 to 0.874, with only four items (4, 5, 13 and 14) displaying values <0.4, and the total variance retained by the single dimension was 40%. Discrimination parameters ranged from 0.539 to 3.063, with seven items presenting values inferior to 1. Information parameters ranged from −1.894 to 1.074. Only six items presented an information parameter greater than 0, all of which also had discrimination parameters superior to 1. Overall, goodness of fit was found to be good, with all items showing Zh values between 0 and 1 and with only two items displaying S–X2P<.05 (items 9 and 19). Regarding response thresholds, only 11 items did not show any degree of overlapping.
Outcomes of the Generalized Partial Credit Model analysis of the Spanish Low Vision Quality of Life Questionnaire.
| Factor loading | Item Discrimination | Step 1 | Step 2 | Step 3 | Step 4 | Step 5 | Item Information | Overlapping | Zh | S-X2 | S-X2 P | |
|---|---|---|---|---|---|---|---|---|---|---|---|---|
| Item 1 | 0.607 | 1.301 | −3.622 | −0.655 | 0.119 | 1.575 | 2.519 | −0.013 | No | 0.361 | 42.181 | 0.108 |
| Item 2 | 0.523 | 1.045 | −3.721 | −0.870 | −0.977 | 0.876 | 1.427 | −0.653 | Yes | 0.265 | 44.085 | 0.167 |
| Item 3 | 0.402 | 0.747 | −3.446 | −0.794 | −2.164 | 1.381 | 0.359 | −0.933 | Yes | 0.134 | 27.139 | 0.754 |
| Item 4 | 0.378 | 0.695 | −4.783 | −2.692 | −0.801 | 0.808 | −0.430 | −1.580 | Yes | 0.189 | 42.295 | 0.291 |
| Item 5 | 0.320 | 0.574 | −6.386 | −0.679 | 1.127 | 2.461 | 1.933 | −0.309 | Yes | 0.111 | 39.062 | 0.422 |
| Item 6 | 0.707 | 1.702 | −2.244 | −0.628 | 0.005 | 0.865 | 0.988 | −0.203 | No | 0.468 | 30.380 | 0.598 |
| Item 7 | 0.874 | 3.063 | −1.736 | −0.728 | −0.089 | 0.654 | 1.160 | −0.148 | No | 0.927 | 19.383 | 0.778 |
| Item 8 | 0.773 | 2.071 | −2.848 | −1.009 | −0.613 | 0.587 | 0.545 | −0.668 | Yes | 0.574 | 21.892 | 0.910 |
| Item 9 | 0.572 | 1.188 | −2.815 | −2.058 | −1.025 | 0.324 | −0.003 | −1.115 | Yes | 0.307 | 50.856 | 0.032 |
| Item 10 | 0.747 | 1.910 | −2.980 | −0.941 | 0.000 | 0.552 | 1.263 | −0.421 | No | 0.517 | 19.128 | 0.965 |
| Item 11 | 0.789 | 2.183 | −2.474 | −0.672 | 0.021 | 0.687 | 1.421 | −0.203 | No | 0.637 | 19.814 | 0.800 |
| Item 12 | 0.783 | 2.142 | −2.934 | −0.557 | −0.451 | 0.725 | 0.750 | −0.493 | No | 0.753 | 28.912 | 0.574 |
| Item 13 | 0.302 | 0.539 | −6.525 | −1.574 | −0.779 | 0.968 | −1.562 | −1.894 | Yes | 0.176 | 50.179 | 0.311 |
| Item 14 | 0.387 | 0.714 | −5.938 | −0.688 | −0.579 | 0.510 | 0.312 | −1.277 | Yes | 0.273 | 53.495 | 0.306 |
| Item 15 | 0.489 | 0.955 | −3.053 | −0.981 | −0.839 | −0.219 | −0.865 | −1.191 | Yes | 0.385 | 34.390 | 0.720 |
| Item 16 | 0.083 | 0.142 | −15.979 | −1.097 | −2.585 | −6.538 | −7.824 | −6.805 | Yes | 0.005 | 35.682 | 0.484 |
| Item 17 | 0.671 | 1.539 | −2.119 | −0.512 | −0.402 | 0.258 | −0.194 | −0.594 | Yes | 0.684 | 26.788 | 0.892 |
| Item 18 | 0.726 | 1.797 | −0.391 | 0.312 | 0.334 | 1.161 | 1.363 | 0.556 | No | 0.566 | 33.537 | 0.393 |
| Item 19 | 0.651 | 1.460 | −0.196 | 0.937 | 1.292 | 1.328 | 2.008 | 1.074 | No | 0.357 | 43.568 | 0.031 |
| Item 20 | 0.713 | 1.730 | −0.438 | 0.393 | 0.214 | 1.173 | 1.469 | 0.562 | Yes | 0.541 | 35.940 | 0.332 |
| Item 21 | 0.566 | 1.167 | −0.371 | 1.179 | 0.424 | 1.491 | 2.268 | 0.998 | Yes | 0.283 | 40.953 | 0.054 |
| Item 22 | 0.745 | 1.903 | −2.596 | −0.592 | −0.343 | 0.251 | 0.491 | −0.558 | No | 0.752 | 44.077 | 0.140 |
| Item 23 | 0.685 | 1.600 | −0.772 | 0.216 | 0.259 | 1.075 | 0.939 | 0.343 | Yes | 0.511 | 38.582 | 0.232 |
| Item 24 | 0.787 | 2.172 | −1.497 | 0.030 | 0.201 | 0.284 | 1.004 | 0.005 | No | 0.541 | 24.200 | 0.450 |
| Item 25 | 0.781 | 2.130 | −2.401 | −0.752 | −0.702 | 0.516 | 0.909 | −0.486 | No | 0.662 | 32.045 | 0.514 |
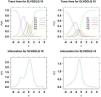
For illustrative purposes, Fig. 2 displays fitted category response curves and item information for items 10 and 15. It may be observed that, whereas item 10 presents no overlapping and well-ordered category responses, and an item information peak near intermediate scores (item information value of −0.421), item 15 displays overlapping and poorly-ordered category responses, and an item information peak of −1.191. Indeed, GPCM coefficients of this item range from −3.053 to −0.219, measuring only latent trait values of patients on the left side.
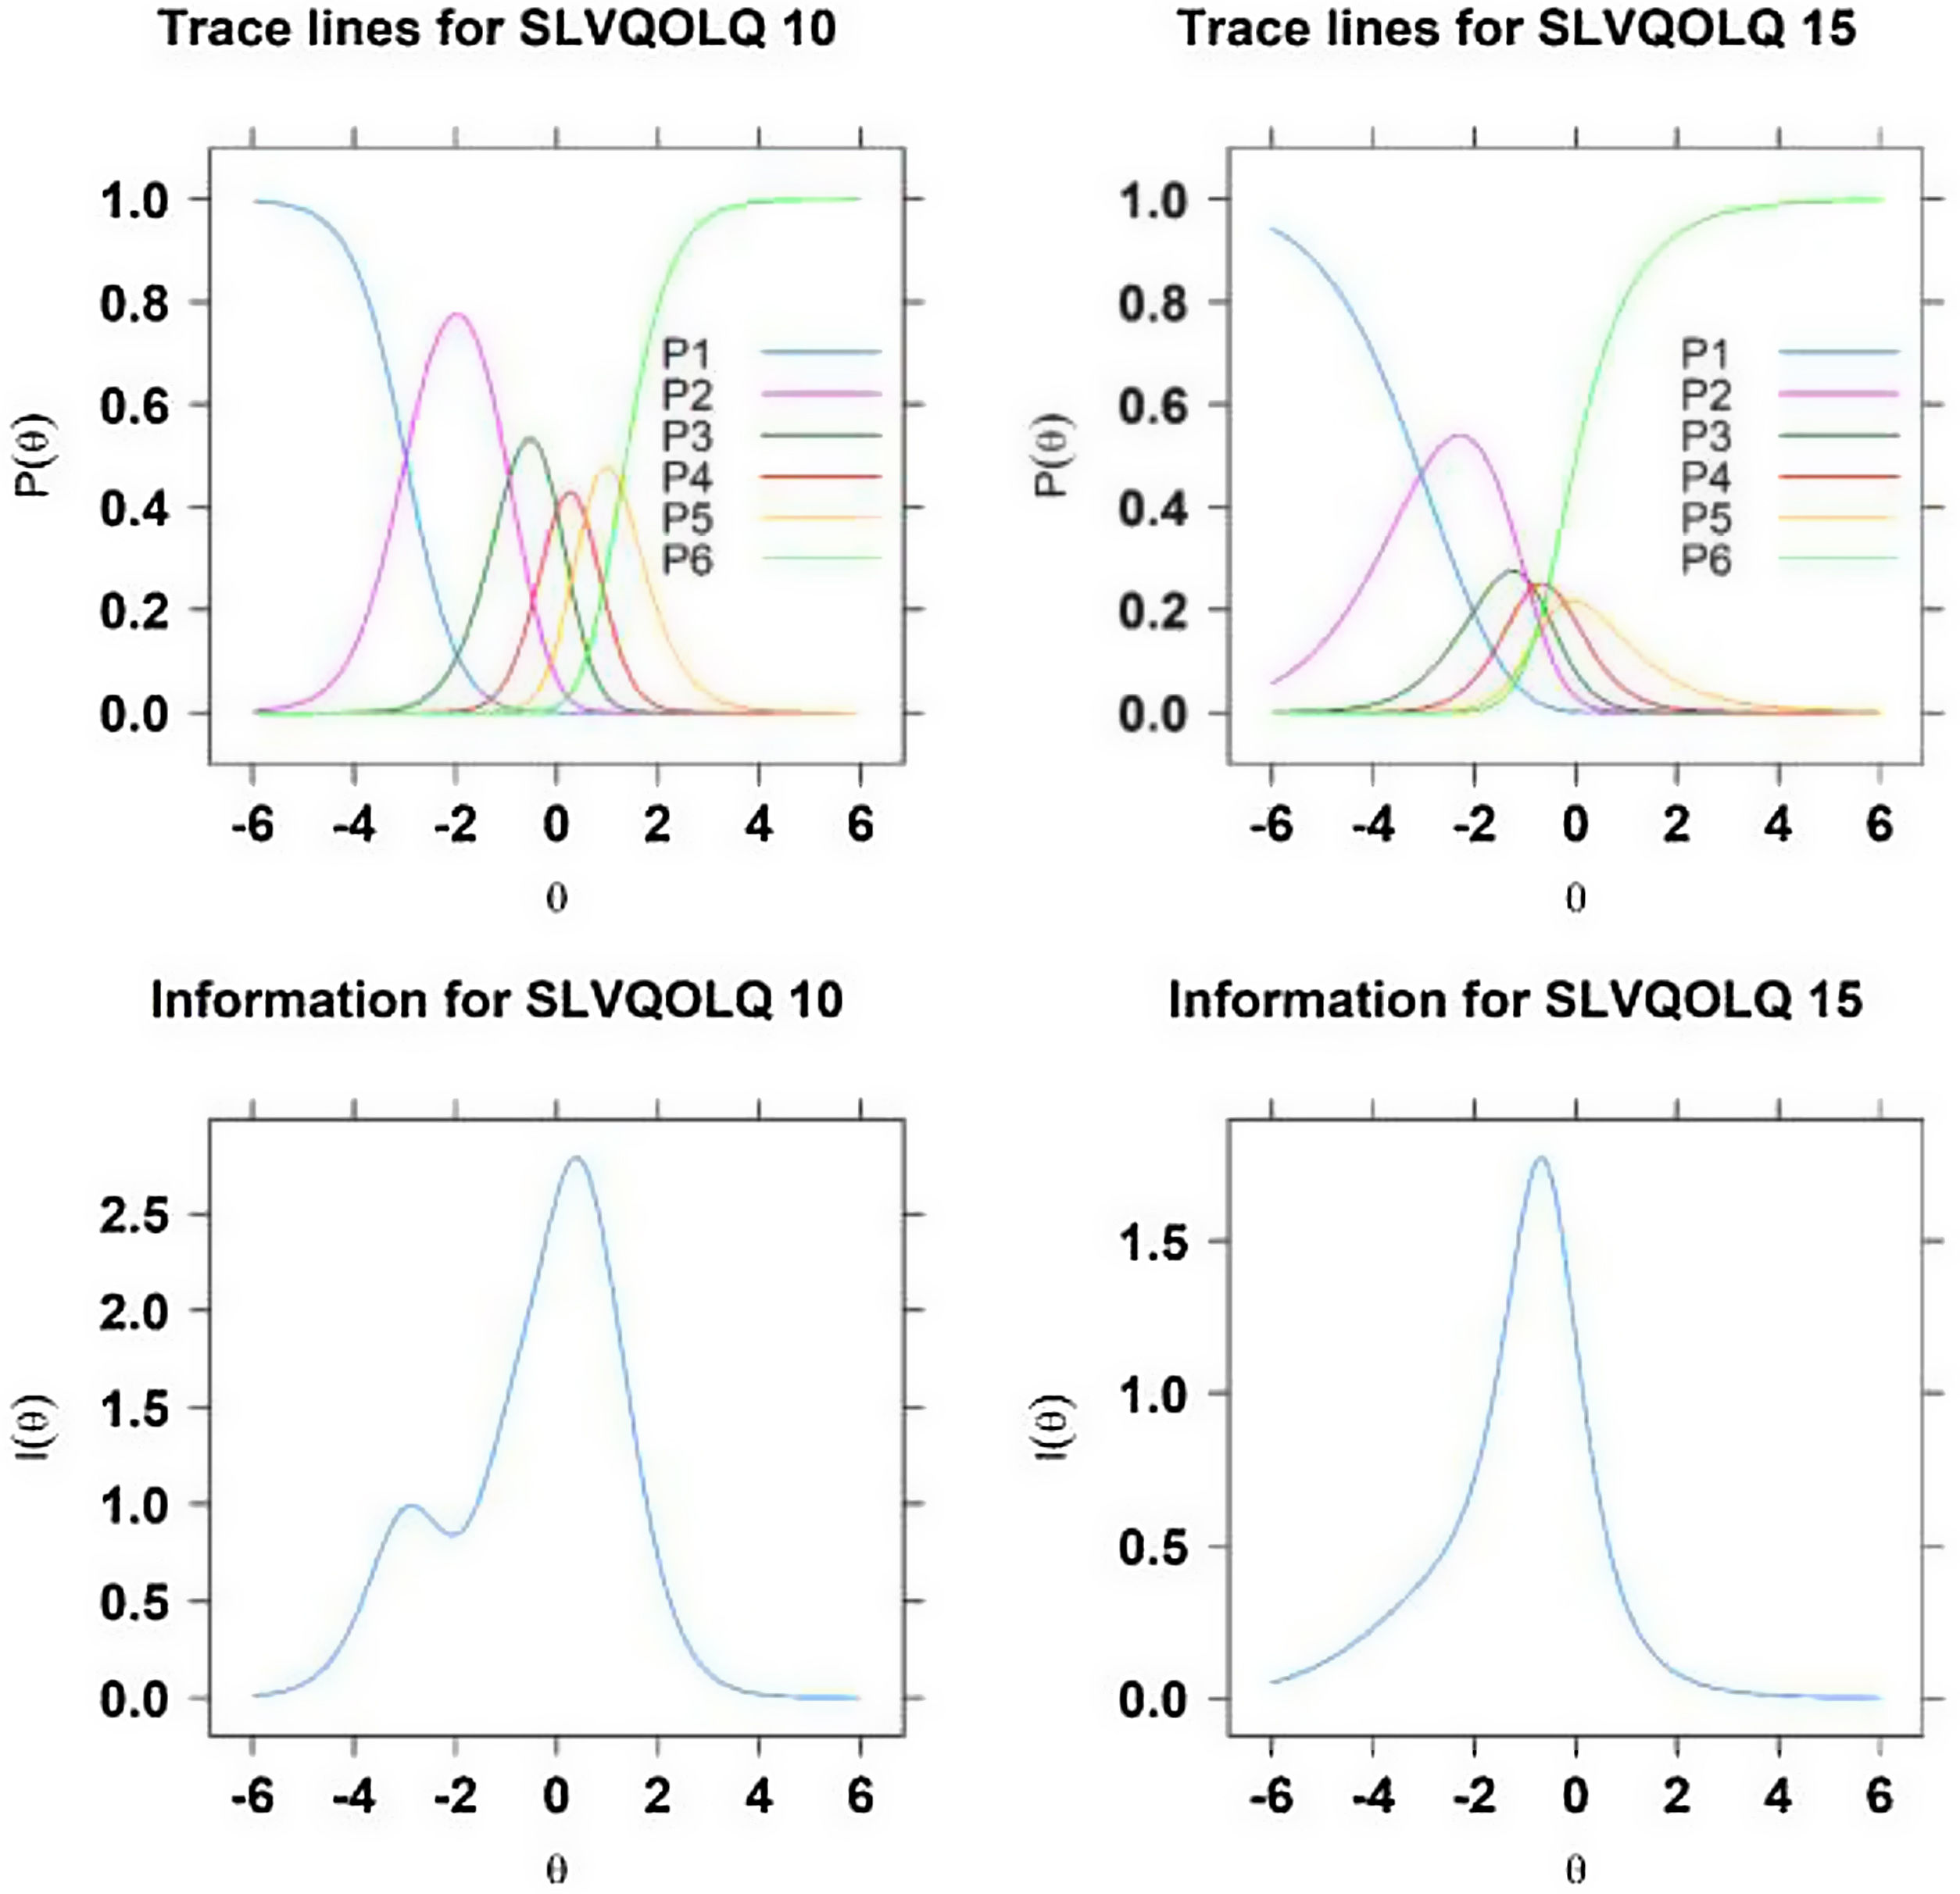
Fitted category response curves (top) and item information for item 10 (left) and item 15 (right). P1 to P6 refer to the six possible category responses ranging from “the patient can no longer perform the activity due to vision impairment” to “absence of sight-related difficulty with the task”.
Patient reported outcomes are essential to thoroughly comprehend the health status of patients and to provide the best possible care. Although many questionnaires have been developed to assess the quality of life of patients with ocular and visual problems, only few instruments are specific for evaluating low vision or visual impairment in patients. Of those available, the LVQOL has been documented to present good psychometric properties.20,27 This instrument was developed and validated in English language, and subsequently in Thai, Turkish, and Chinese.21–23 The recent translation and cultural adaptation of the LVQOL to Spanish,24 which is the second-most spoken native language after Mandarin Chinese, created the opportunity to design the present validation study. The new tool SLVQOL will be useful for both clinicians and researchers to assess the quality of life of their Spanish-speaking patients, to develop quality of life studies, and to share their findings with the international community.
In the process of validating a new instrument it is useful to compare it with the gold-standard in the field. Unfortunately, there are no current translated and validated low vision specific quality of life questionnaires in Spanish. Therefore, to assess the construct validity of the SLVQOL, its results were compared with those of the non-vision specific EQ 5D-5L and the vision-related generic NEI VFQ-25, both of which have been translated to and validated in Spanish.28,29 Construct validity was evidenced by the corresponding moderate to strong convergent and divergent correlations between both—the overall scores of the three questionnaires and of their respective dimensions, with the exception of the dimension Ocular pain in NEI VFQ-25. The dimension Ocular pain was not assessed by the SLVQOL as none of the most frequent causes of visual impairment (age related macular degeneration, cataract, myopia, diabetic retinopathy or glaucoma) account for ocular pain in patients. The outcomes of the NEI VFQ-25 and the EQ 5D-5L, provided as supplementary material, were comparable to those previously published for patients with low vision and visual impairment.28,34
A cut-off score of 105 or 106 was found to be optimal to discriminate between visual impairment and healthy patients. The good classification capabilities found in this study are promising but could be an over-estimation due to the clear-cut definition of cases and control groups. Adequately studies designed to identify patients with visual impairment in the general population are needed to evaluate its usefulness as a screening tool.
The difference of 50.3 points in the SLVQOL global score between patients with visual impairment and healthy subjects was larger than the difference of 39.4 points reported by Wolffsohn and Cochrane in their original study.20 The latter documented an average score of 60.9±25.1 for patients with visual impairment, which was lower than that obtained in the present study (66.9±23.2). The partial discrepancy with the Australian cohort thus observed could be owing to several reasons. First, the differences in the inclusion criteria of the two studies accounted for a better average visual acuity of the Australian patients (0.58±0.35 logMAR), as compared to the Spanish patients in this study (0.75±0.43 logMAR). Moreover, healthy subjects in the Australian cohort were age-matched with their visually impaired counterparts, whereas the sample of healthy subjects in the present study was on average slightly younger than the visual impairment group. This was one of the major limitations of this study, which may have contributed to the overestimation of the differences in SLVQOL score and the time taken to administer the questionnaire for both groups. In addition, it must be noted that visual acuity was measured in decimal notation and later converted to logMAR notation, instead of measuring it on a logMAR chart. This may have introduced small errors to our measurements, as decimal visual acuity notation does not present homogeneous steps.
One finding that confirms the usefulness of a quality of life specific questionnaire was the ability of the SLVQOL to partly discriminate among the different levels of visual impairment, particularly mild visual impairment from legal blindness and low vision from legal blindness, as shown in Fig. 1. However, the outcome of the GPCM analysis revealed that a single dimension approach is not an adequate fit for the data. There were 7 items (3, 4, 5, 13, 14, 15 and 16) with a discrimination parameter lower than 1, which would suggest excluding them of the scale or considering a multi-dimensional solution. In effect, the presence of multidimensionality in questionnaires may prevent correct interpretation of the global score, as more than one latent trait is being assessed. Also, the occurrence of overlapping and disordered category responses gives support to a revision of the instrument by collapsing categories to improve item information. Further research efforts shall be devoted in this direction, which may lead to a shorter and more discriminating version of the SLVQOL.
The current sample size, determined by calculation and following the recommendations of one of the authors of the original instrument (J.S.W), was considered sufficient for the purpose of this study to replicate previous validation studies in English (278 visually impaired and 70 healthy),20 Chinese (100 visually impaired and 100 healthy),21 and Turkish (378 visually impaired).23 However, sample size may have been insufficient for the dimensionality assessment of the questionnaire, which may require a sample size of 1000 or more for complex IRT models.35
In this study, patients were recruited from two different clinical settings—a large public hospital (National Health System) and a private clinic. Subjects from both these centres mainly differed in terms of degree of visual impairment, educational status, income (data not shown) and the mode of questionnaire administration (telephone interview vs face-to-face interview). It may be acknowledged that this sampling method is likely to have introduced some unwanted confounding variables to the study, which may influence the results, particularly the absolute questionnaire scores. However, for the purpose of validation, a larger, heterogeneous sample was preferred in order to accurately reflect the behaviour of the tool in a general population scenario in which a dispersion of all the previously mentioned socioeconomic and disease-related parameters is present. It may be assumed that although a study based on a narrowly defined sample may lead to better psychometric properties of the SLVQOL, nevertheless its results would be less suitable to extrapolate to a wider population of patients with visual impairment.
The values of Cronbach's alpha for the entire sample and for each of the four dimensions were very high (>0.90). Values between 0.8 and 0.9 are ideal and denote good reliability of the instrument, while values over 0.9 may be an indicator of redundancy or replication of items.36 This would advise, as a possible line of future work, the reduction of the questionnaire, which would also result in shorter administration times.
In conclusion, the SLVQOL was able to quantitatively and reproducibly assess the quality of life in patients with visual impairment and in normal subjects. Additionally, the SLVQOL displayed psychometric properties that were similar to or superior to the original version, although IRT analysis evidenced the need to structure the questionnaire in two or three well-defined subscales and to reconsider including certain items that may be unable to provide significant discrimination. The results of the present study suggest that the SLVQOL can be very useful in future studies and clinical trials to precisely and reproducibly assess the quality of life related to vision impairment. It can, thereby, improve the knowledge of disease burden on patients with visual impairment and the evaluation of the outcome of patients following specific treatments.
FundingThis research did not receive any specific grant from funding agencies in the public, commercial, or not-for-profit sectors.
Declarations of interestNone.
The following is Supplementary data to this article:


