


The main objective of this study was to obtain percentile curves of stereoacuity in arc seconds for a Spanish population aged between three and twelve years of age.
Materials and methodsA descriptive, observational and transversal study was conducted, which included children aged between three and twelve years of age who did not present with any known ocular and/or systemic diseases. The convenience sampling method was used to select the sample from three schools and one hospital in the Community of Madrid. The Bueno-Matilla Vision Unit's random dot test was used to measure stereoacuity. A descriptive statistic was performed with the stereoacuity values that were obtained for the 5th, 10th, 25th, 50th, 75th, 90th and 95th percentiles.
ResultsThe stereoacuity values of 1300 children were analysed. In the 50th percentile curve, it was determined that stereoacuity values close to 40 sec/arc were present from four years of age, and at four years and nine months, stereoacuity values close to 28 sec/arc were already being observed within said percentile, with values that were similar to those expected in the adult population. A progressive increase was observed, reaching 19 sec/arc before six years of age, with this stereoacuity value becoming more established in children from seven years of age.
ConclusionAlthough given the specific type of sampling that was performed it was not possible to generalise the results to the entire population, these percentile curves may aid paediatric professionals in their assessment of the development of this visual ability, which is indicative of the degree of development of binocular vision.
By evaluating the capacities of the visual system throughout an individual's development, we are able to deduce whether a normal course is being followed, that is to say whether capabilities are being developed without alteration, or whether, to the contrary, values outside the norm are present, which would therefore suggest that the visual system is not developing as originally anticipated.
One challenge that optometrists have to overcome on a daily basis is how to establish the normal values for the different age groups based on the results attained through optometric examinations. Nonetheless, for certain visual abilities, such as stereoacuity, normative values for the different age groups are yet to be determined.
Stereoacuity is a crucial component of the visual system function. To ensure its correct development, patients must not present with any oculomotor alteration that conditions the eye alignment, and, likewise, they must not present with any ocular pathology or refractive amblyopia that could condition the visual acuity of each eye.
Children are born with a binocular capacity that undergoes considerable development during the first six months of life, resulting from the increase in the dominance column's distributions in the striated visual cortex, and the apparition of cortical binocular and stereoscopic response cells.1 Bifoveal fixation begins from the third month, and between the third and sixth month it is possible for two images to be fused together at the cortical level. From that point onwards, this fusion improves progressively, and, likewise, stereoscopic vision also improves throughout the first two years of life.1,2
Obtaining normative values for stereoacuity evolution is a challenging task, especially for young subjects. The tests used to attain said values can prove complex for patients within the lower age range of the paediatric population, and if they are unable to provide a response, it will not be possible for these values to be determined. However, several studies have shown that it is possible for stereoacuity exploration tests such as the Randot test to be used to determine the stereoscopic vision values, observing that subjects aged between three and five years of age attained similar values to those recorded in the adult population.3-5
Based on the understanding that in order to be able to evaluate the normal development of binocular vision and improve the screening and detection of visual disturbances, stereoacuity must firstly be determined, this study aims to determine the percentile curves of stereoacuity within a Spanish population of children aged between three and twelve years of age.
Material and methodType of studyA descriptive, observational and transversal study was conducted, which included children who did not present with any known systemic and/or ocular pathologies. For this study, the principles of the Declaration of Helsinki were followed, and the study was subsequently assessed and approved by the European University of Madrid's ethics committee (Spain). All of the participants were required to sign an informed consent form.
SampleThe characteristics of the sample and its inclusion criteria were the same as those used to determine the visual acuity percentile curves in the study carried out by Borja-Navas et al.6 Thus, the children from the schools that participated in the study were classified between pre-school students and sixth grade students, who are included by age in the range of 3 to 12 years. The children from the hospital facilities included in the study were those who attended a routine ophthalmological examination for the first time and who did not present obvious ocular pathology or symptoms of refractive error. Children with systemic or ocular pathologies were excluded from the study. The existence of the pathology was not determined by complementary examinations carried out in addition to the measurement of visual acuity, but from the information provided by the parents or guardians in the anamnesis that had been previously carried out. A total of 1548 subjects aged between three and twelve years of age were recruited, all of them of Caucasian origin.
MaterialStereoacuity was obtained using the Bueno-Matilla Vision Unit (UBM), which is also used to determine the visual acuity percentile curves. The unit description and calibration specified in the paper by Borja-Navas et al.6 were used for this study. This unit offers two tests to determine stereoacuity, in which the subjects are required to wear glasses with a red-green filter. The illuminance conditions of the room were measured with a Testo 540 luxometer (Testo SA, Cabrils, Barcelona, Spain) and they should fall within the range of 400 lux and 600 lux. According to Tidbury et al,7 if this range is maintained during the measuring of visual acuity, the effect caused by the different illuminance is limited to 0.012 LogMAR.
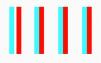
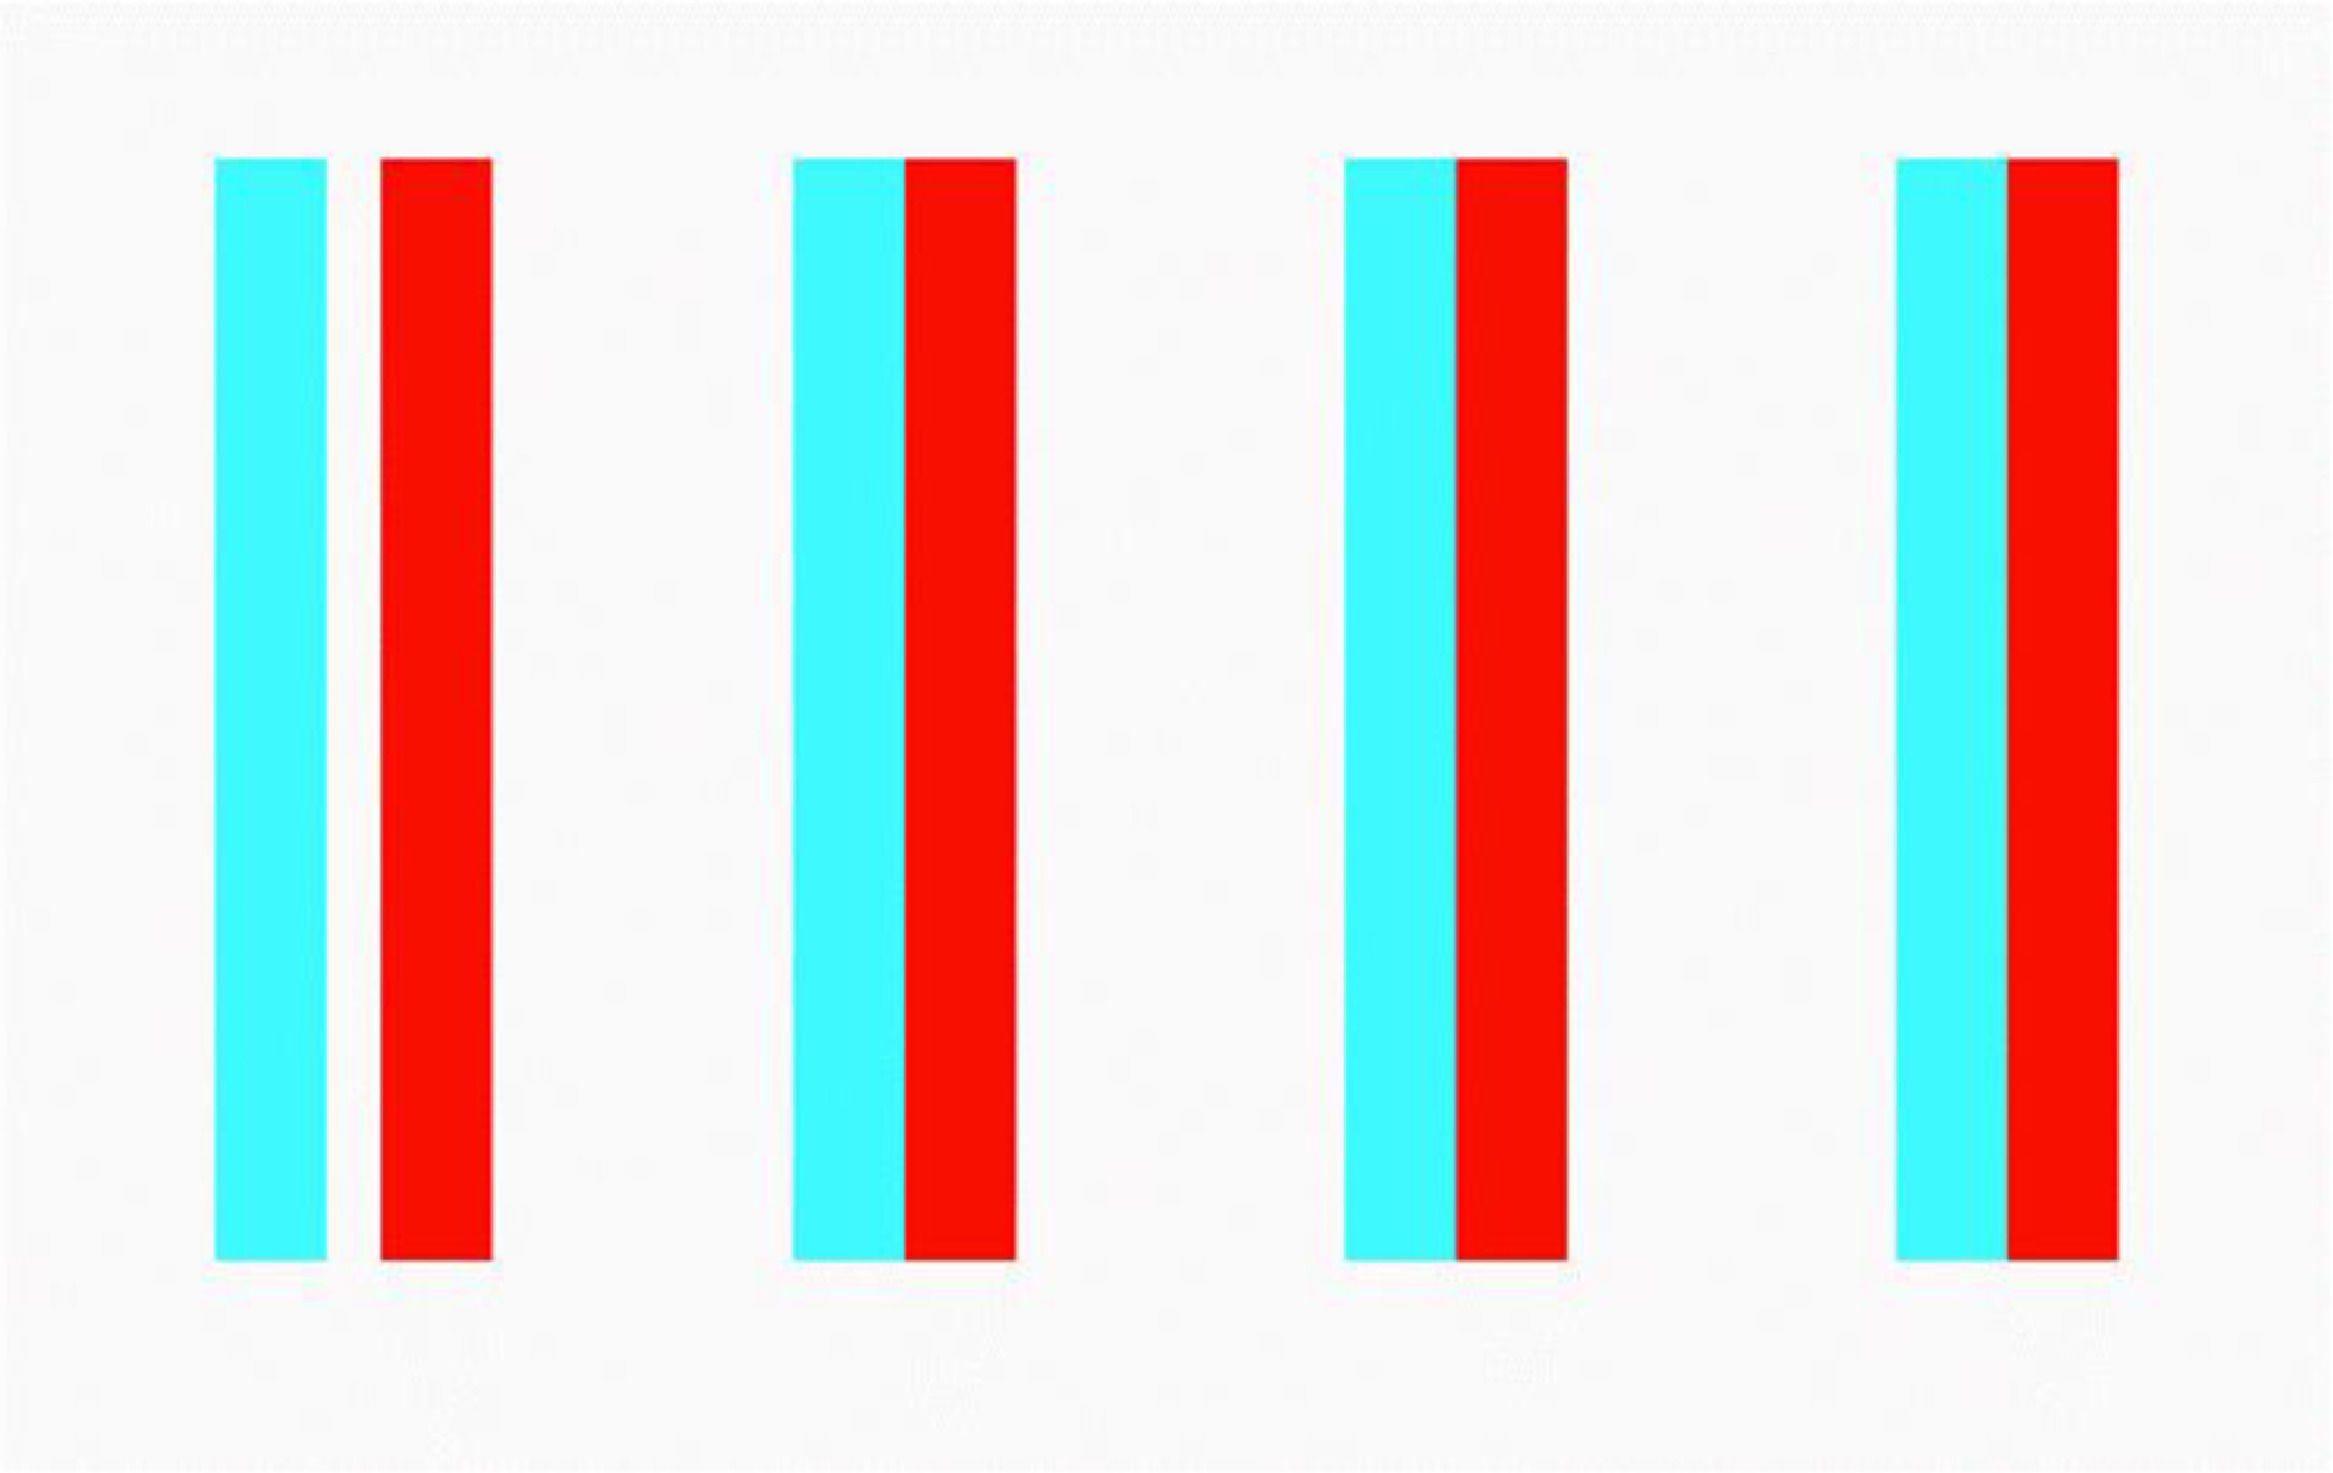
The first test used to determine stereoacuity was the red-green bar test (Fig. 1). In this test, the patients were presented with four columns, each containing a red-green stimulus. One of the columns contained a retinal disparity between the green and red stimulus. As a result of this retinal disparity, the column was perceived in three dimensions, and the patients were asked to determine which of the four columns appeared in three dimensions.
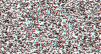
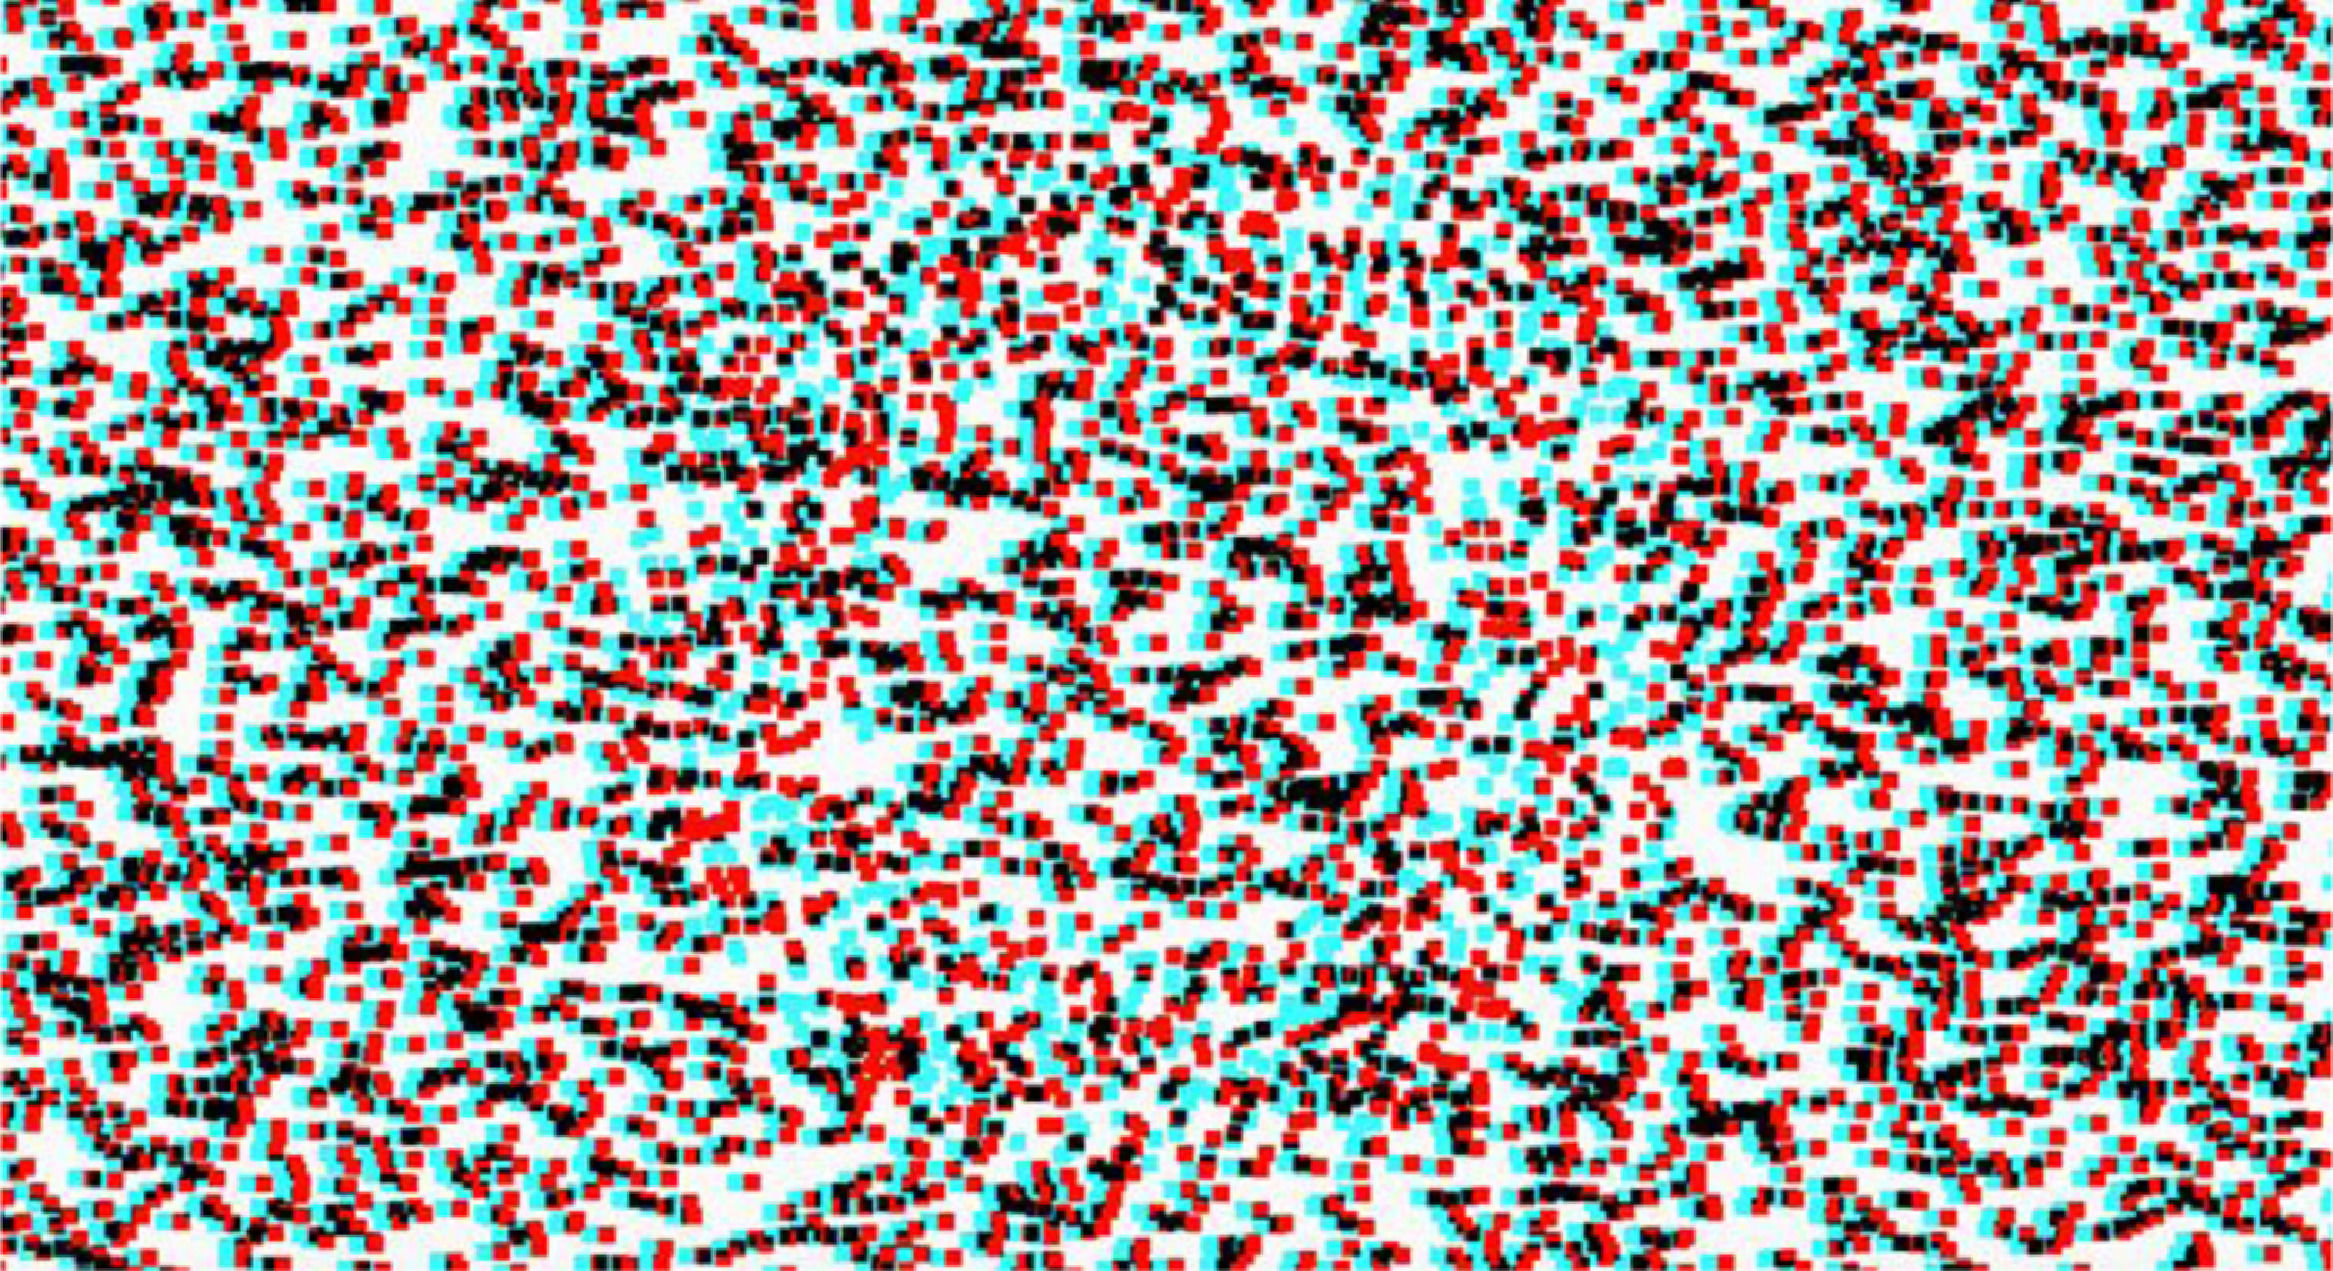
The second test was a random dot test (Fig. 2). In this test, the subjects had to look at a pattern of random dots in which a letter had been concealed. The letters concealed within the pattern were symmetrical and identical to those used in the visual acuity assessment. The subjects had to identify the letter that had been concealed within the random dot pattern.
In order to decide which of the two tests were to be used, a preliminary study was performed first.
Preliminary studyA preliminary study was conducted in order to compare the results of the two tests in a pilot sample. First, the results obtained from the two tests were compared with each other, before comparing them to the results attained using the Howard Dolman stereoacuity test (Bernell, Mishawaka, Indiana, United States). The Howard Dolman test is considered the clinical standard for determining stereoacuity, and in this study, the test was conducted according to the accepted methods.8,9 This preliminary study also determined the repeatability of both the red-green bar and the random dot test at two different times.
ProcedureThe random dot test that was used to determine the stereoacuity values of the total sample was conducted at a distance of three metres. In this study in which subjective refraction was not performed, the stereoacuity values were determined either without compensation, or with the subjects’ usual optical compensation (glasses or contact lenses).
Not all of the subjects that undertook the random dot test were familiar with the letters that they were asked to identify. To overcome this problem, the subjects were given matching letter cards to help them to identify the projected letter. During data collection, all participants understood the test and there were no problems when obtaining the data. Likewise, when performing the test, the examiners were always aware that the subjects did not move their heads, in order to avoid clues when solving the test. This was not previously explained to the subjects in order not to condition the test.
The patients had to identify the letters that were hidden within the random dot pattern, and the degree of disparity of the images reduced as the test progressed. If the subject was unable to identify the hidden letter, their stereoacuity value was determined by this unit. In order to ensure the subject's correct response, one of the test's functions allowed for the hidden letter to be revealed, given that it is unable to be discriminated without the red-green filter glasses, which the subjects were required to wear while performing the test.
Some of the younger subjects who were not familiar with the letters that they had to identify were shown matching cards that they could use to identify the letter which was being projected on to the monitor.
Statistical analysisIn order to analyse the agreement between the tests and their repeatability in the preliminary study, we first evaluated normality, making it possible for either parametric or non-parametric tests to be used. Subsequently, we calculated the effect size, the intraclass correlation coefficient, the coefficients of variation, and the Bland-Altman limits of agreement.
We obtained descriptive statistics, boxplot diagrams, and the 5th, 10th, 25th, 50th, 75th, 90th and 95th percentiles for the total sample. In order to assess the impact that age had on the results, we conducted the ANOVA and Tamhane's post hoc tests.
The IBM SPSS Statistics v.24 software (IBM Corporation, Armonk, NY, United States) was used to perform all of the analyses with a 5% significance level (p < 0.05). To determine the normality and effect size we used the JASP v.0.13.1 software (Jasp Team, University of Amsterdam, Amsterdam, The Netherlands).
ResultsSampleThe sample was the same as the one used in the already published visual acuity percentile curves study. A total of 1300 children were analysed, distributed according to the Spanish census population frequency. 51.1% of the participants were male.6
Preliminary studyA preliminary study was carried out with 36 subjects in order to determine which of the Bueno-Matilla unit stereoacuity tests was to be used.
- A
Comparison between the red-green bar test and the Howard Dolman test, and the random dots test and the Howard Dolman test.
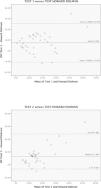
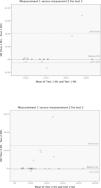
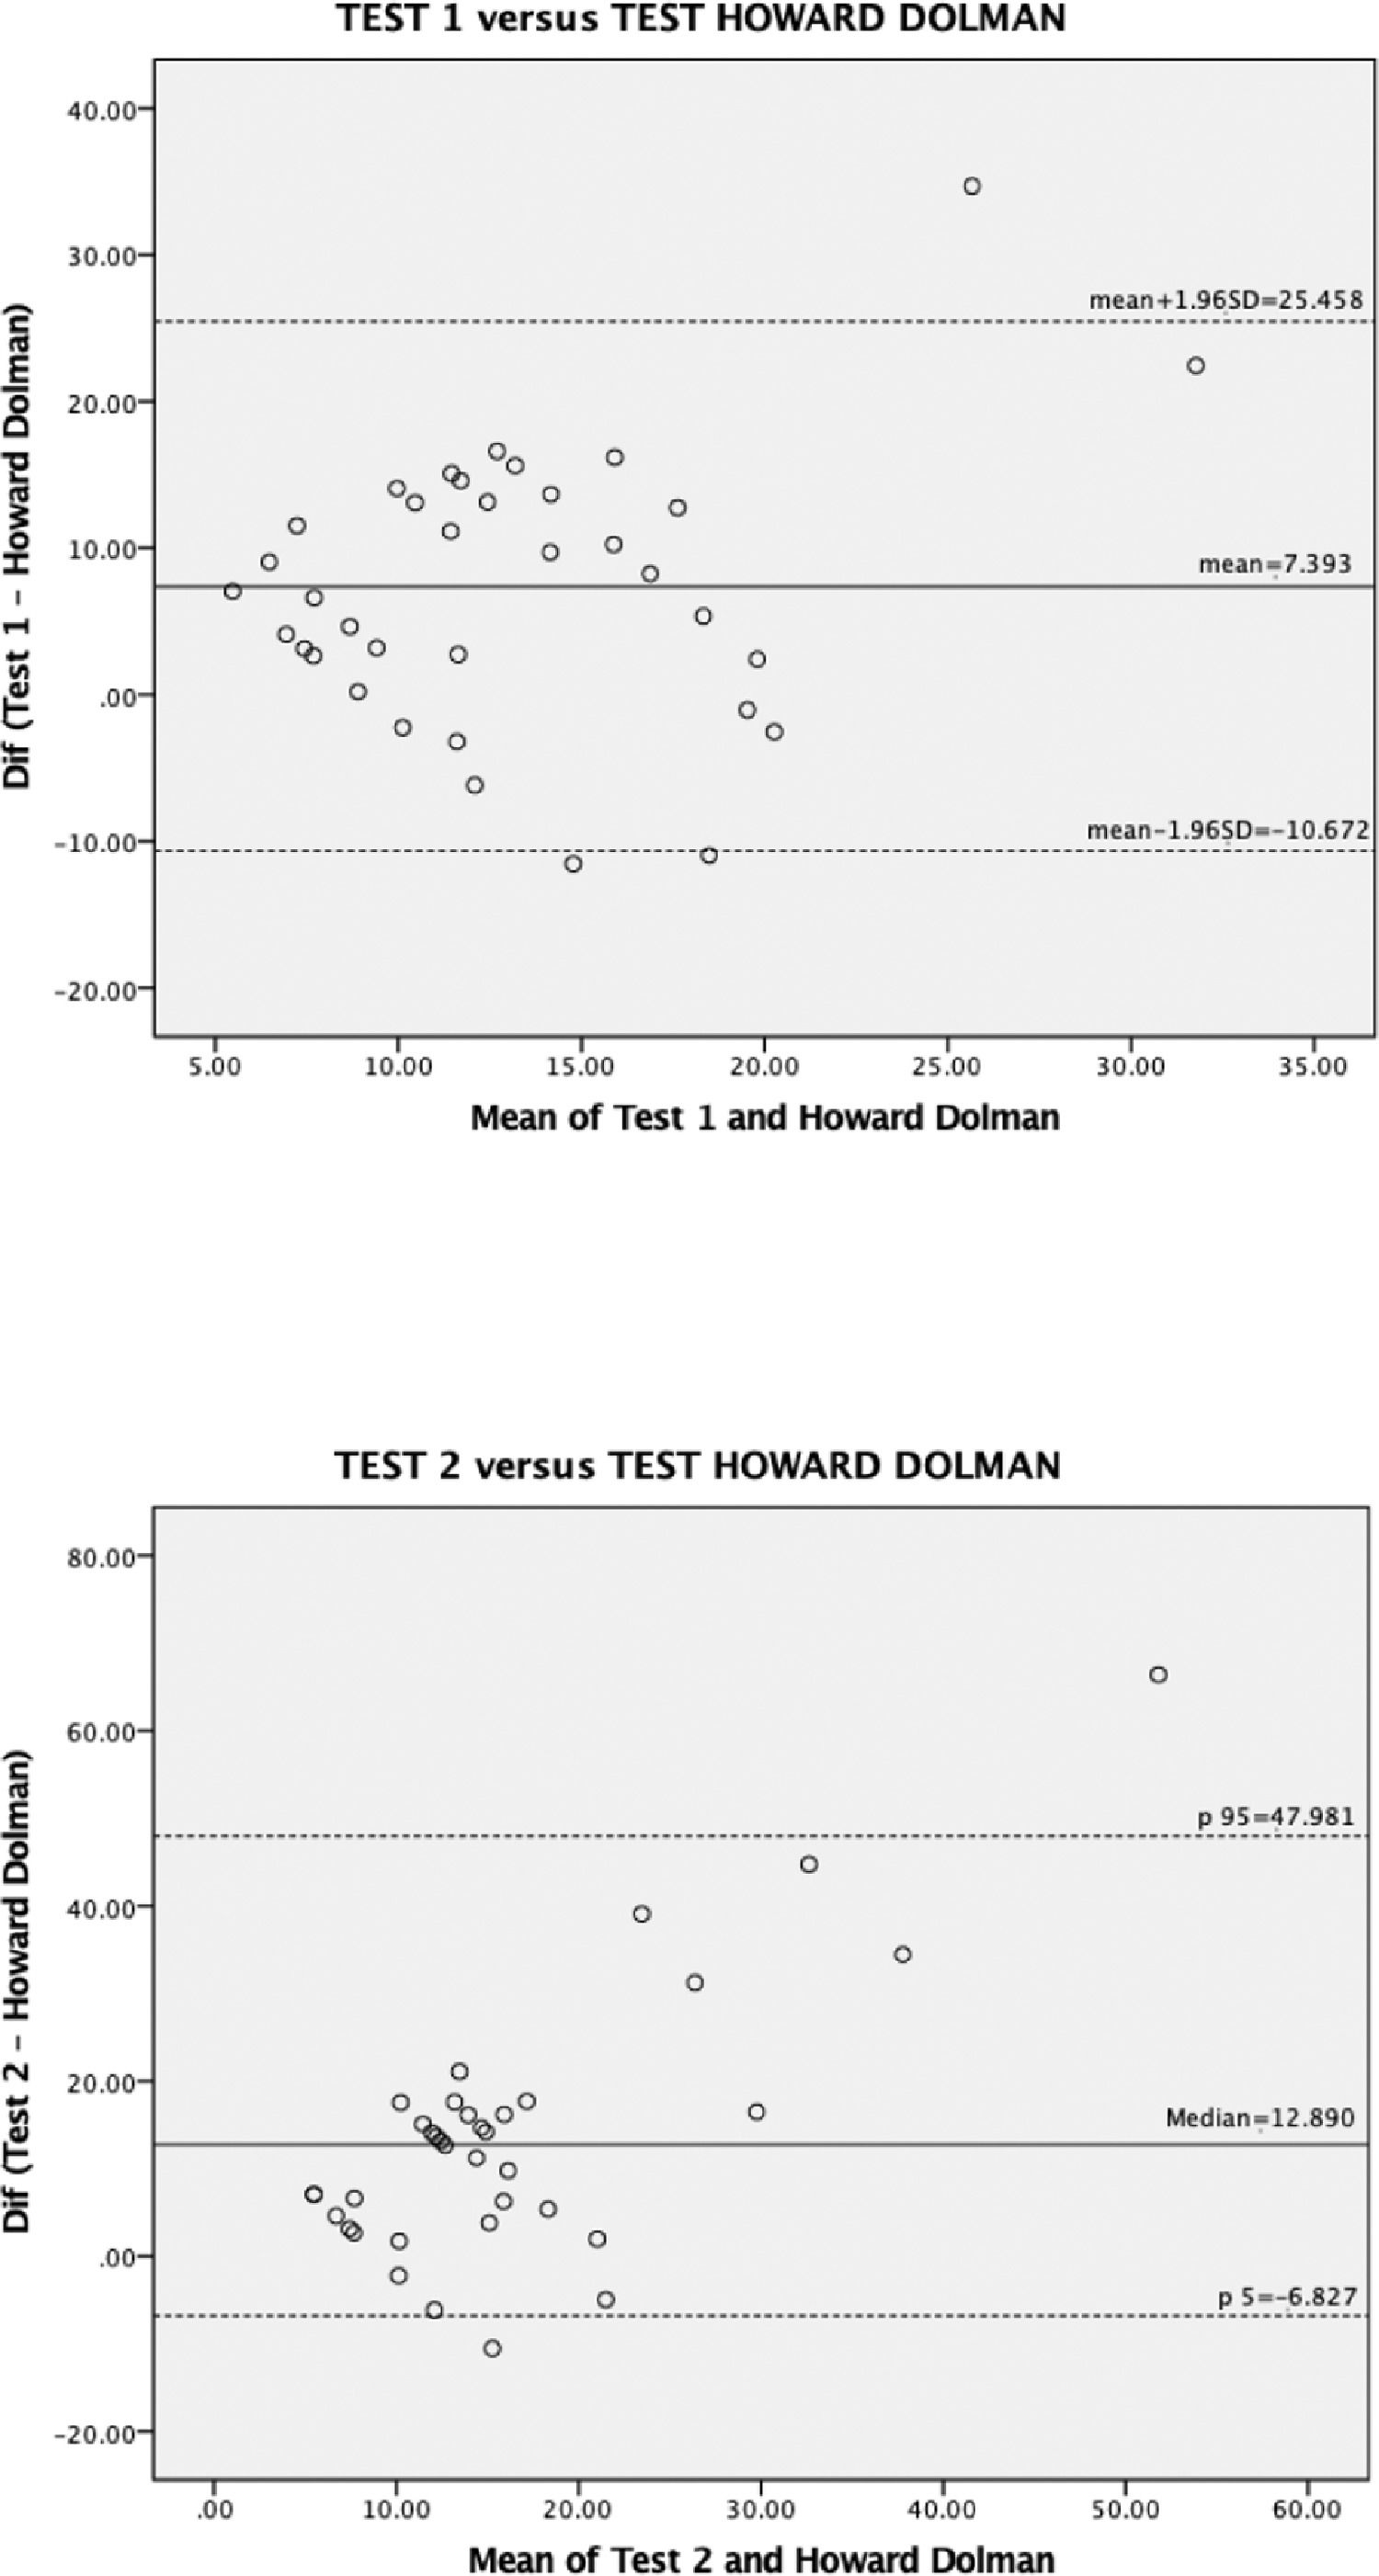
The Shapiro-Wilk normality test was performed to compare the results obtained in the red-green bar test and those obtained in the Howard Dolman test, and subsequently to compare those obtained in the random dots test and in the Howard Dolman test, with a result of p = 0.393 in the first case and p < 0.001 in the second. Subsequently, in order to compare the means, we performed the Student's t test and the Wilcoxon signed rank test respectively. In both cases, the results indicated significant differences (p < 0.001), with effect sizes of 0.802 (Cohen´s d), and 0.889 [confidence interval (CI) 95%: 0.779; 0.946] (biserial correlation) respectively. The Bland-Altman concordance analyses have been included as Fig. 3.
- A
Comparison between the red-green bar test and the random dots test
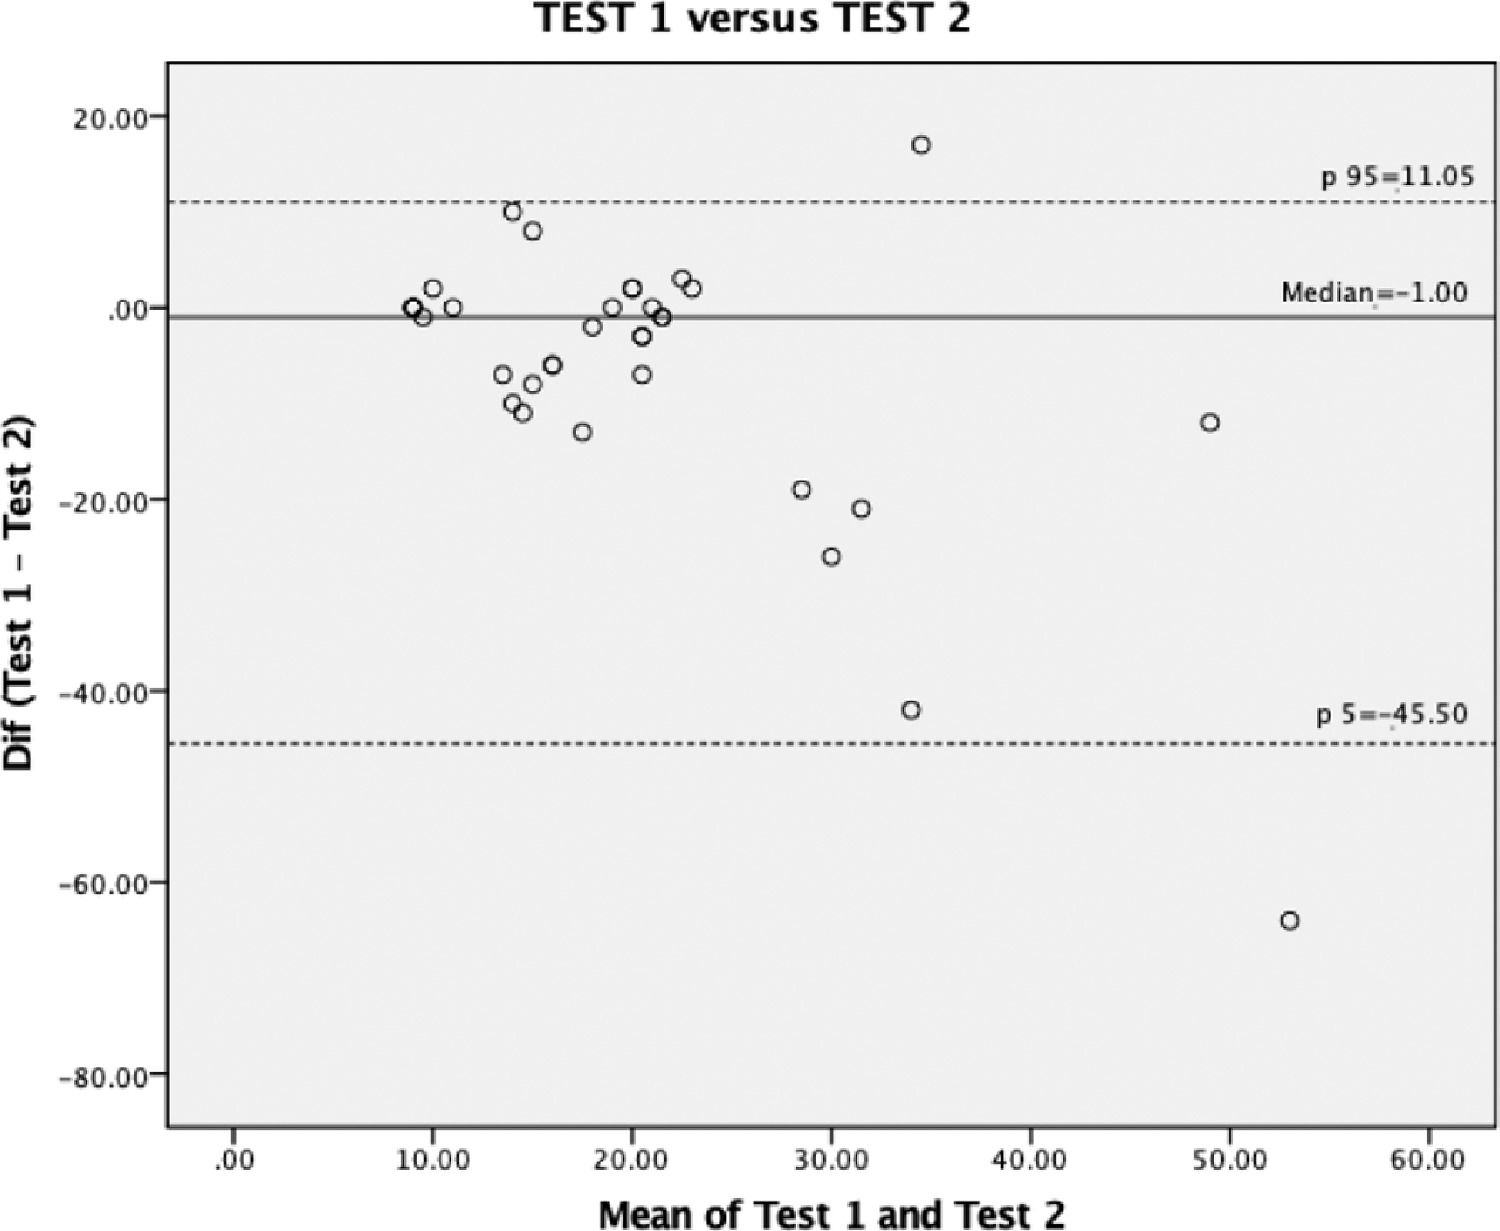
Subsequently the results obtained with the two Bueno-Matilla unit tests; the red-green bars and the random dots were compared. After checking their normality using the Shapiro-Wilk test (p < 0.001), the means were compared using the Wilcoxon rank test. The results indicated that there were no significant differences between them (p = 0.012), nonetheless, the agreement between the measures was low (effect size with biserial correlation of -0.547 [CI 95%: -0.777; -0.188]; intraclass correlation coefficient -CV- 0.482 and 0.693). The Bland-Altman concordance analysis has been included as Fig. 4.
- A
Repeatability of the red-green bar test and the random dots test
Finally, the repeatability of the two tests was assessed at two different times, R1 and R2. After assessing normality using the Shapiro-Wilk test, attaining a result of p < 0.001 for both tests, we then conducted the Wilcoxon rank test to compare the means.
For the red-green bar test, the results were p = 0.799, effect size with biserial correlation of 0.143 [CI 95%: -0.594; 0.750], ICC of 0.872, and CV of 0.606 and 0.481.
For the random dots test, the results were p = 0.068, effect size with biserial correlation of 0.750 [CI 95%: 0.193; 0.941], ICC of 0.895, and CV of 0.729 and 0.693.
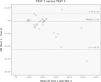
The Bland-Altman concordance analyses have been included as Fig. 5.
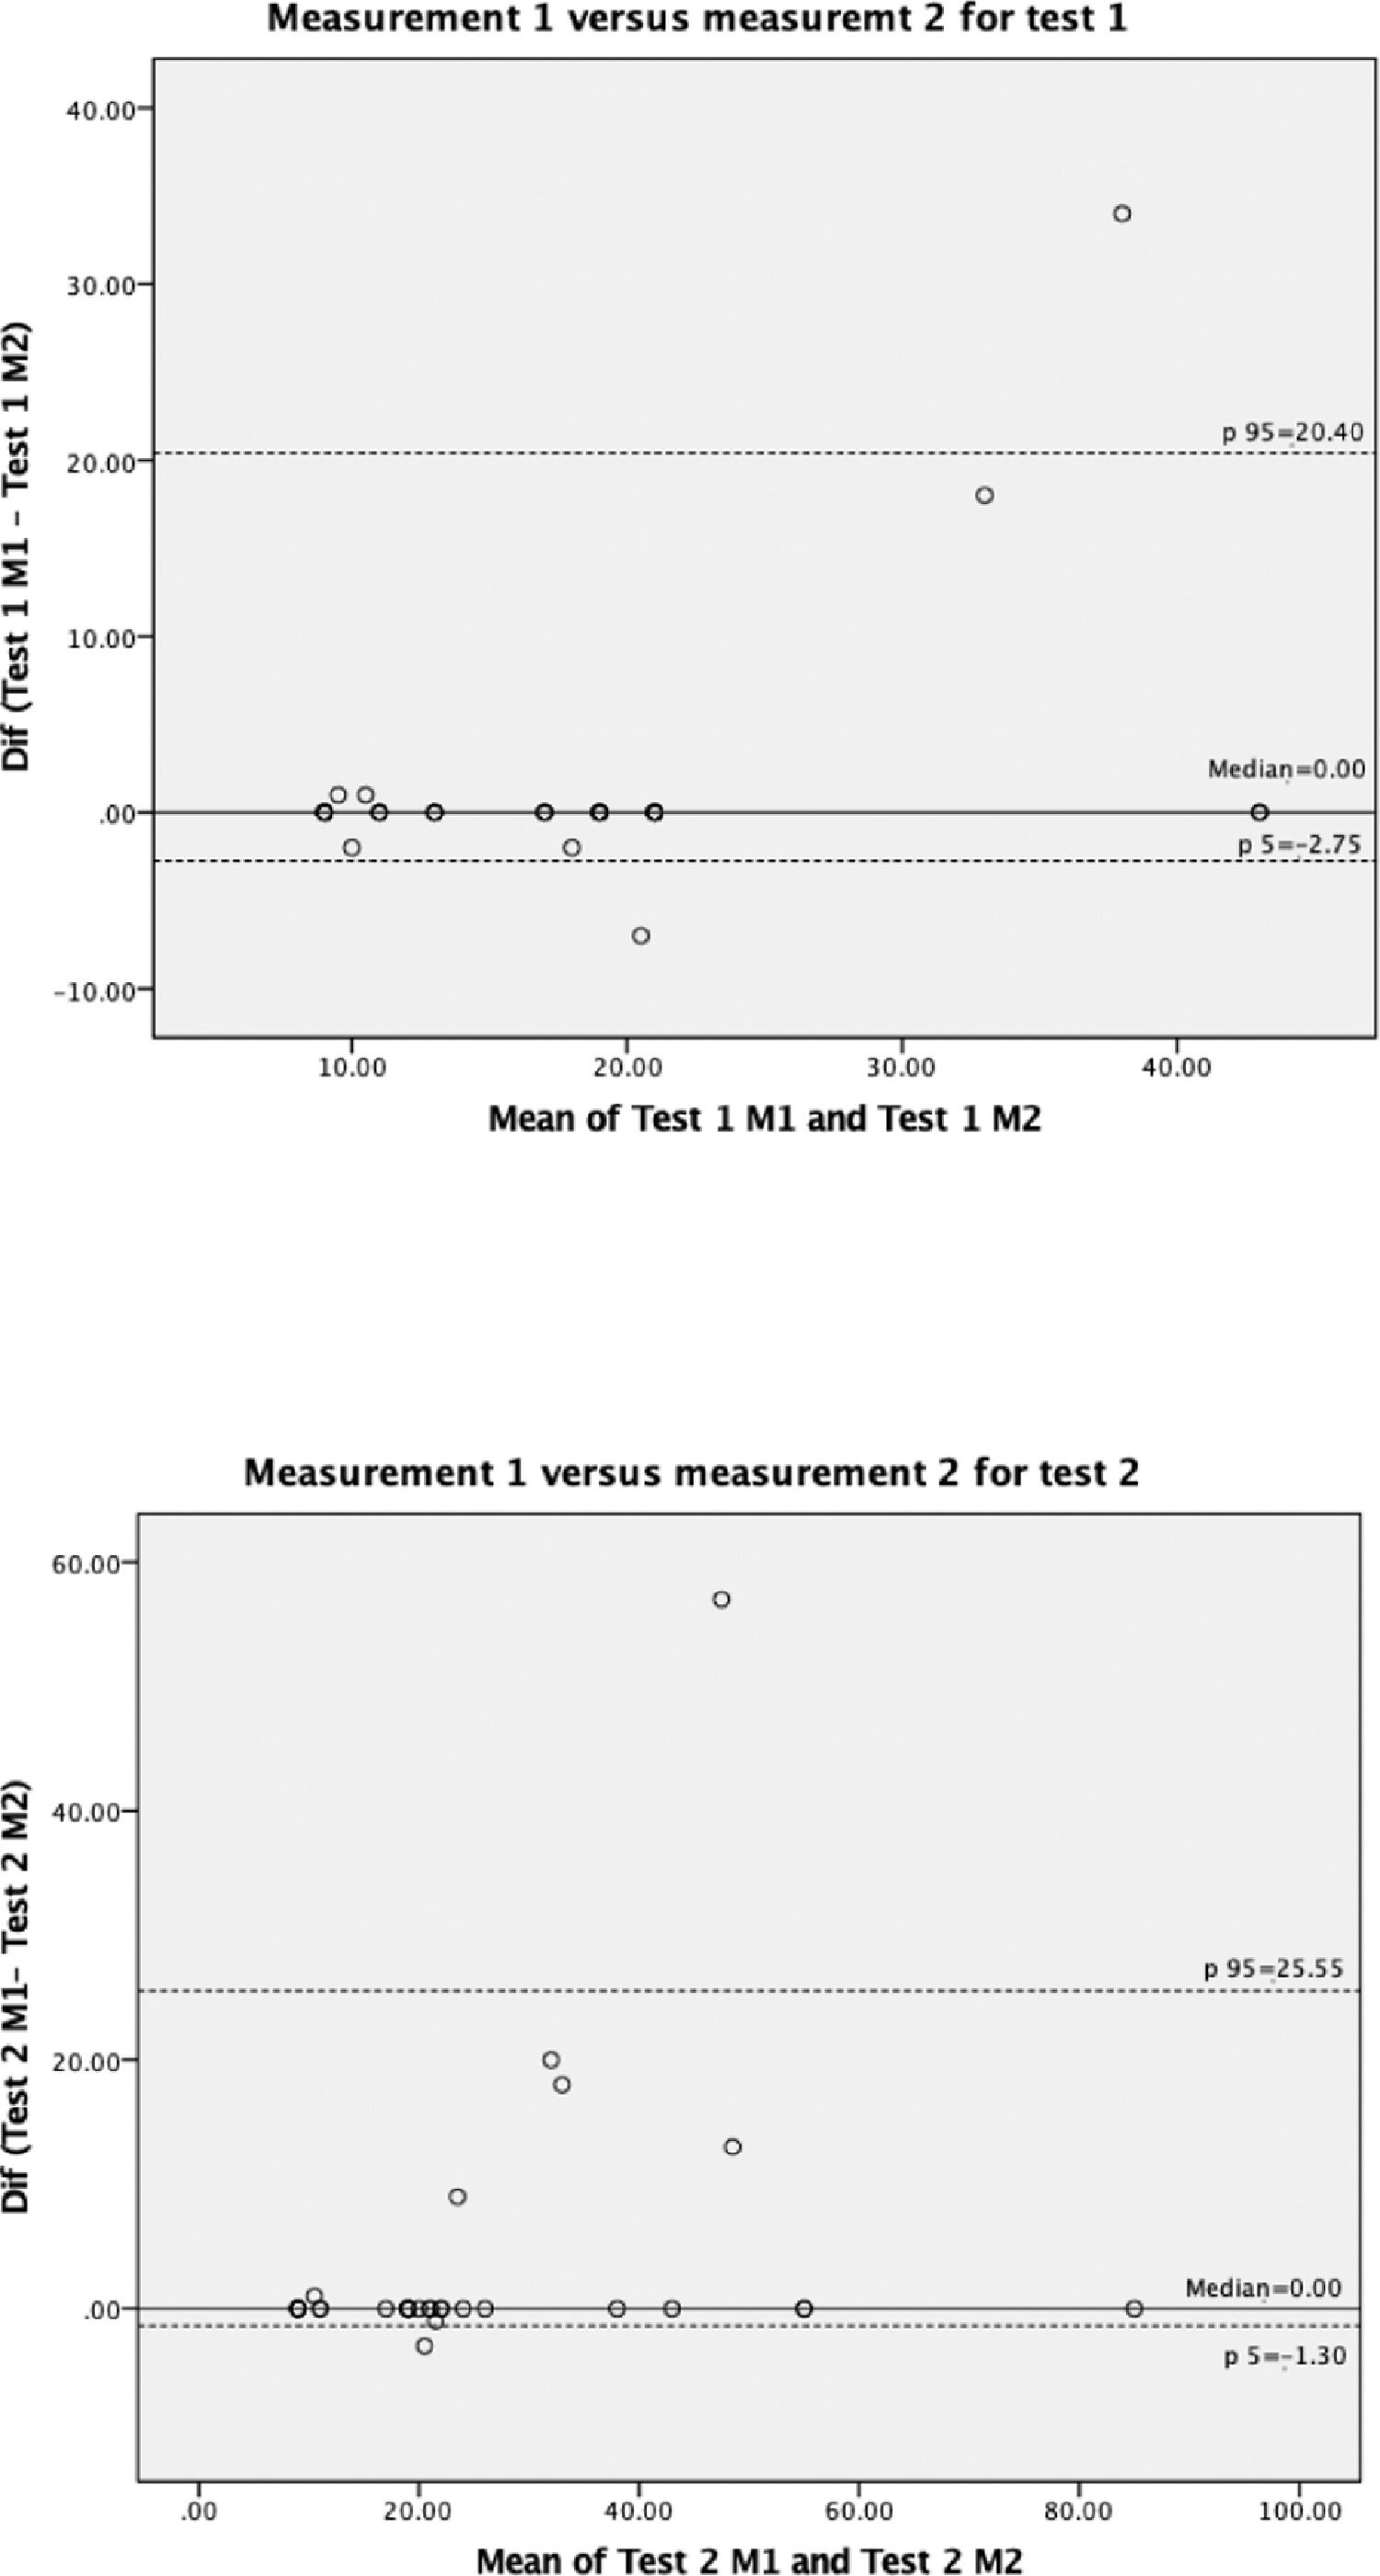
The results suggested a lack of significant differences when it came to the repeatability of both tests. As the concordance was greater with the random dot test, it was decided that the total sample should be analysed with this test.
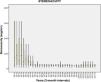
Percentile curvesFig. 6 shows the boxplot diagram for stereoacuity, calculated at three-month intervals for the total sample.
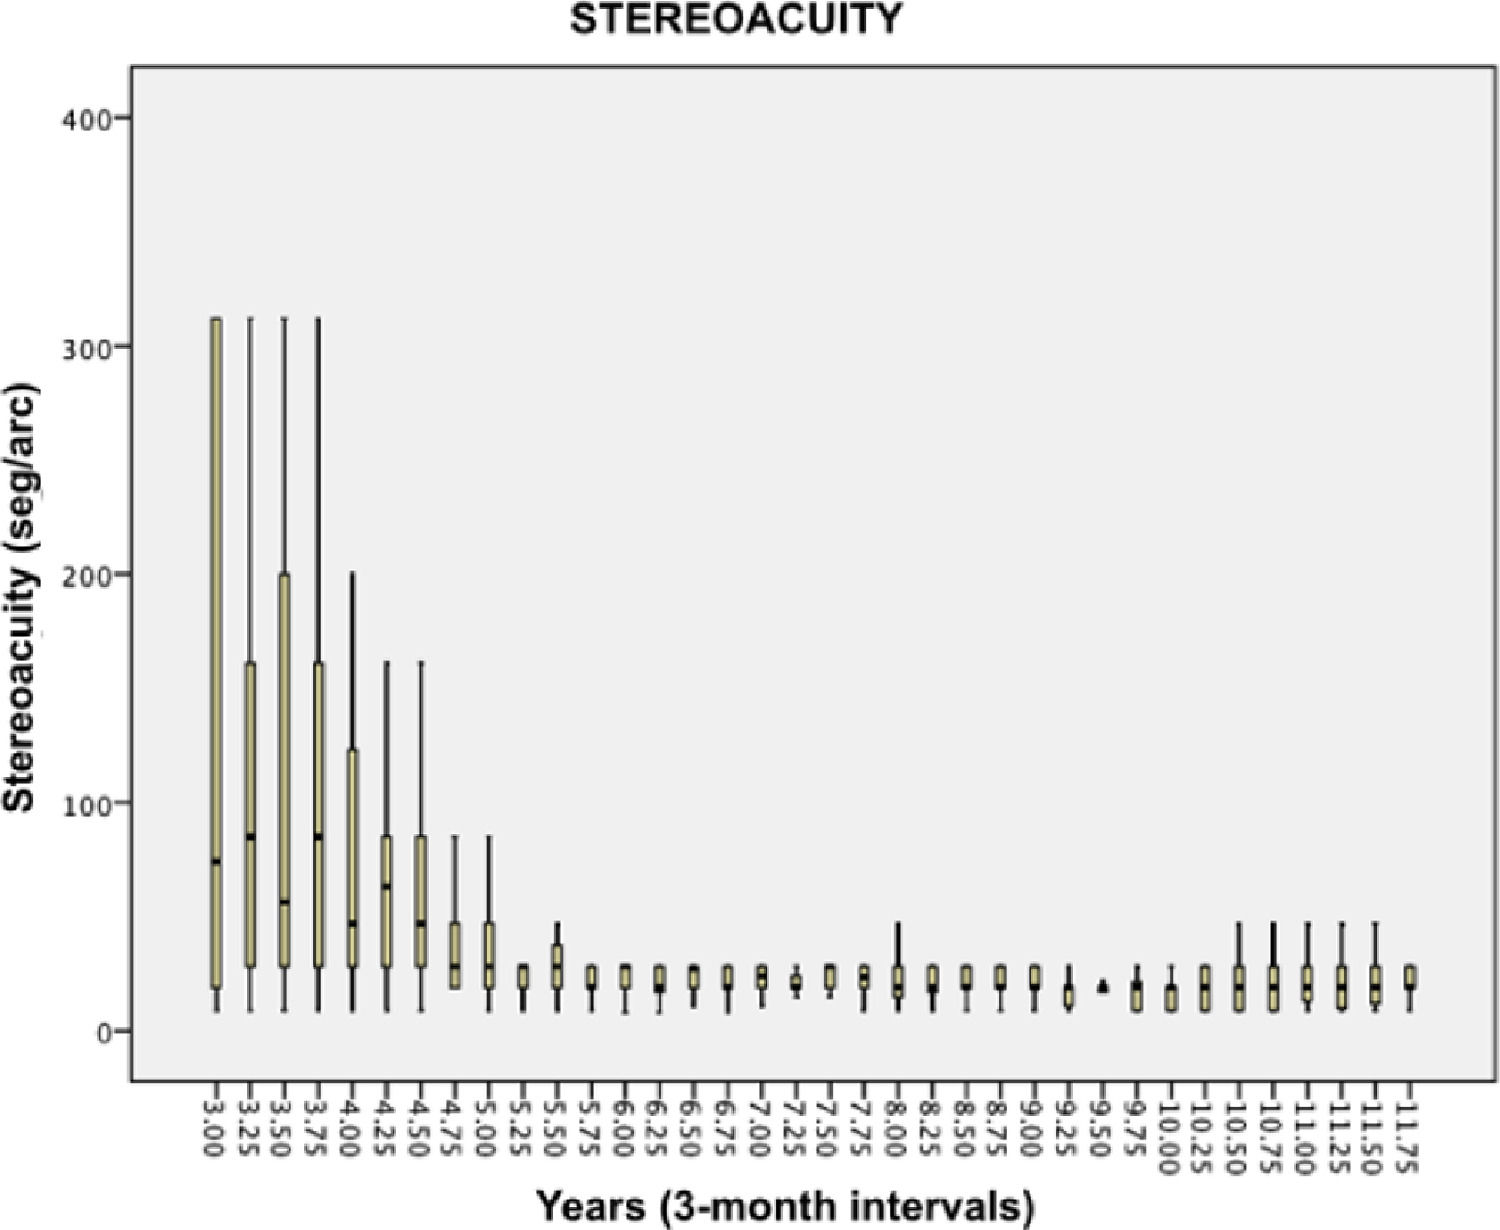
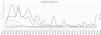
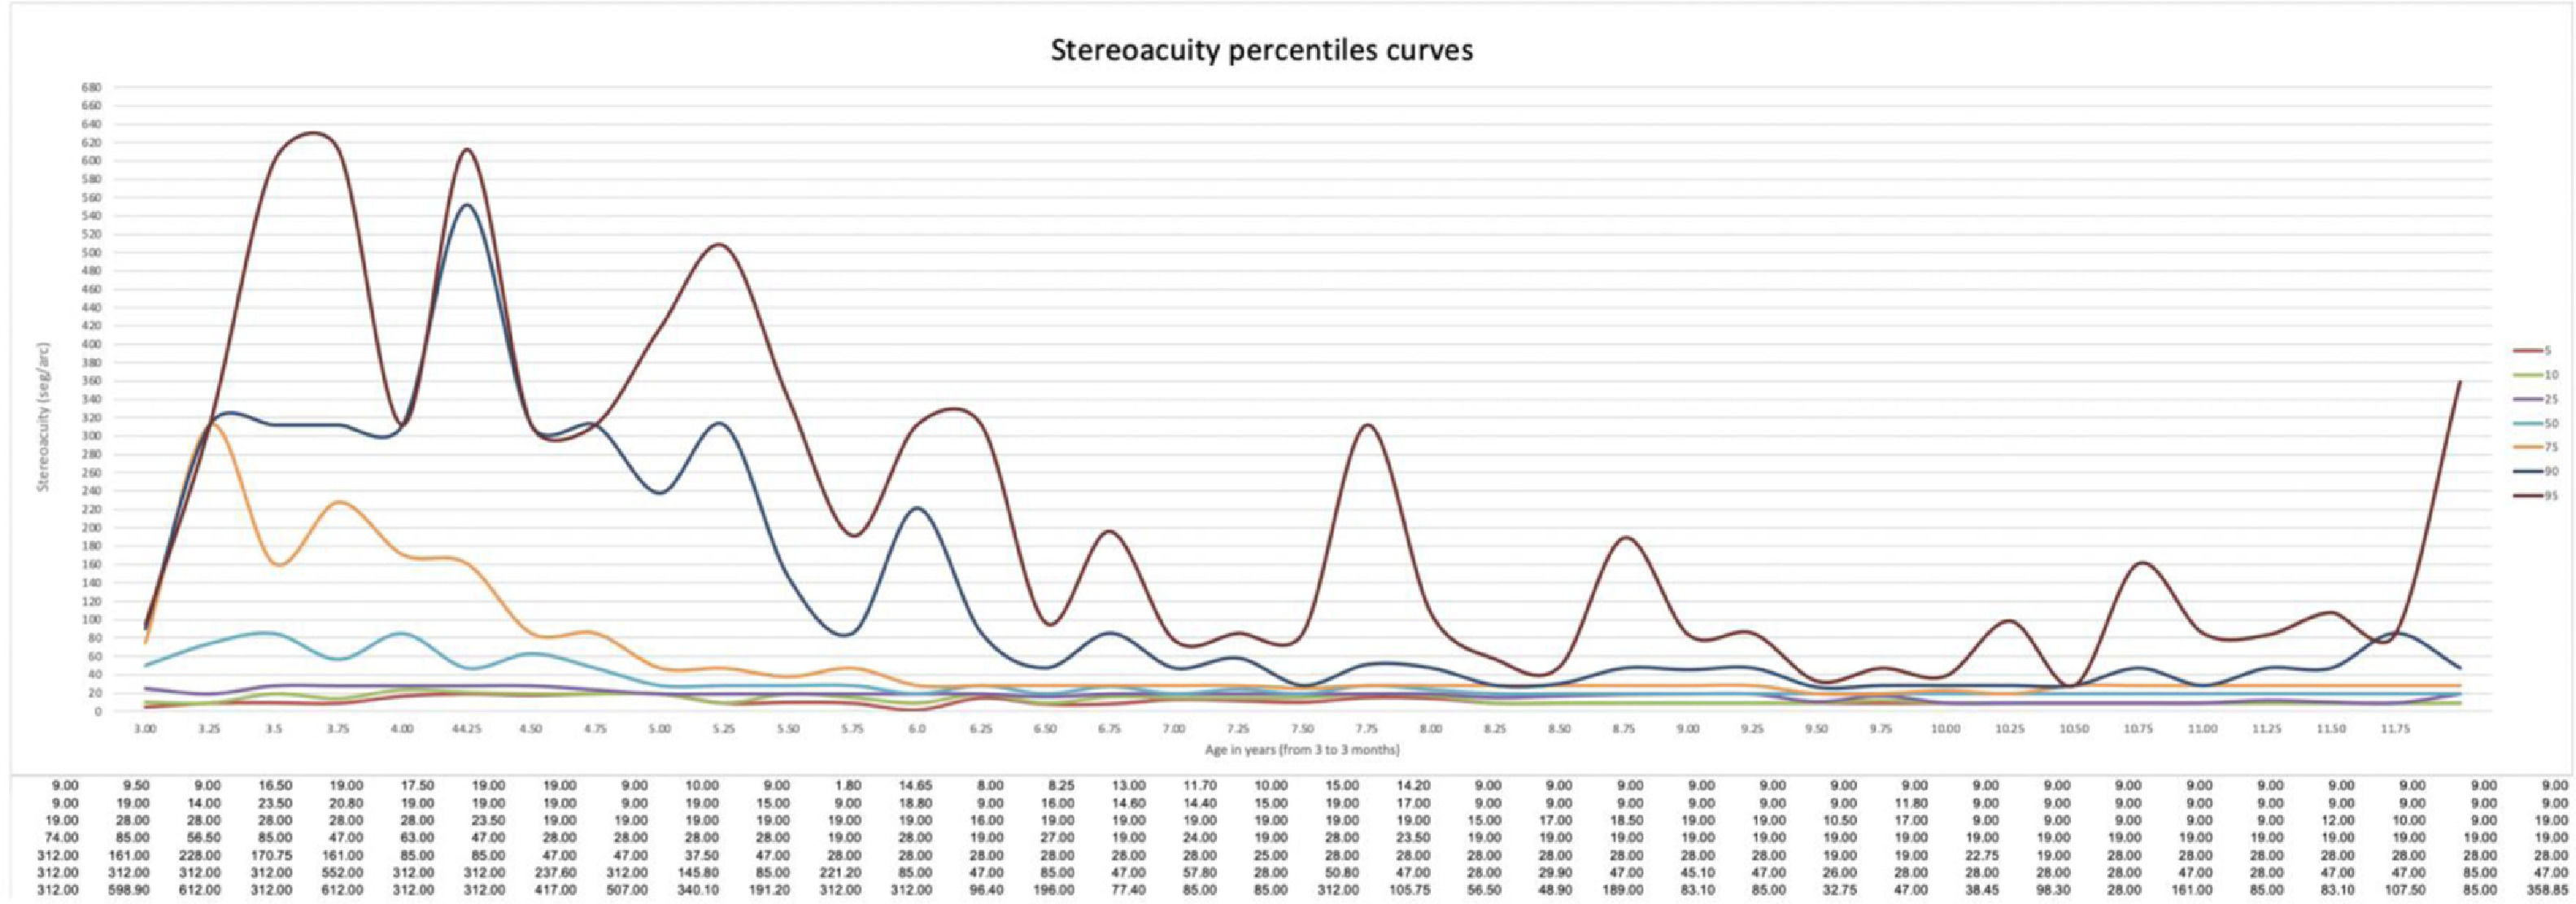
Fig. 7 shows the stereoacuity curves with their mean numerical values for the 5th, 10th, 25th, 50th, 75th, 90th and 95th percentiles at three-month intervals.
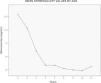
The ANOVA test was performed to determine the impact of age, resulting in a significant value (p < 0.001). As a result, a Tamhane post hoc test was conducted, and significant differences were observed in children between three and five years of age and above, between four and six years of age and above, and between five and seven years of age and above (all p < 0.001). Within the seven-to-twelve-year age group no significant age-related differences (p > 0.05) were observed. The graph of means by age has been included as Fig. 8, in which the mean values were calculated at three-month intervals; that is to say, the mean values for the three-year age group includes the values up to 4 years of age, the four-year age group includes the values up to 5 years of age, and so on.
Discussion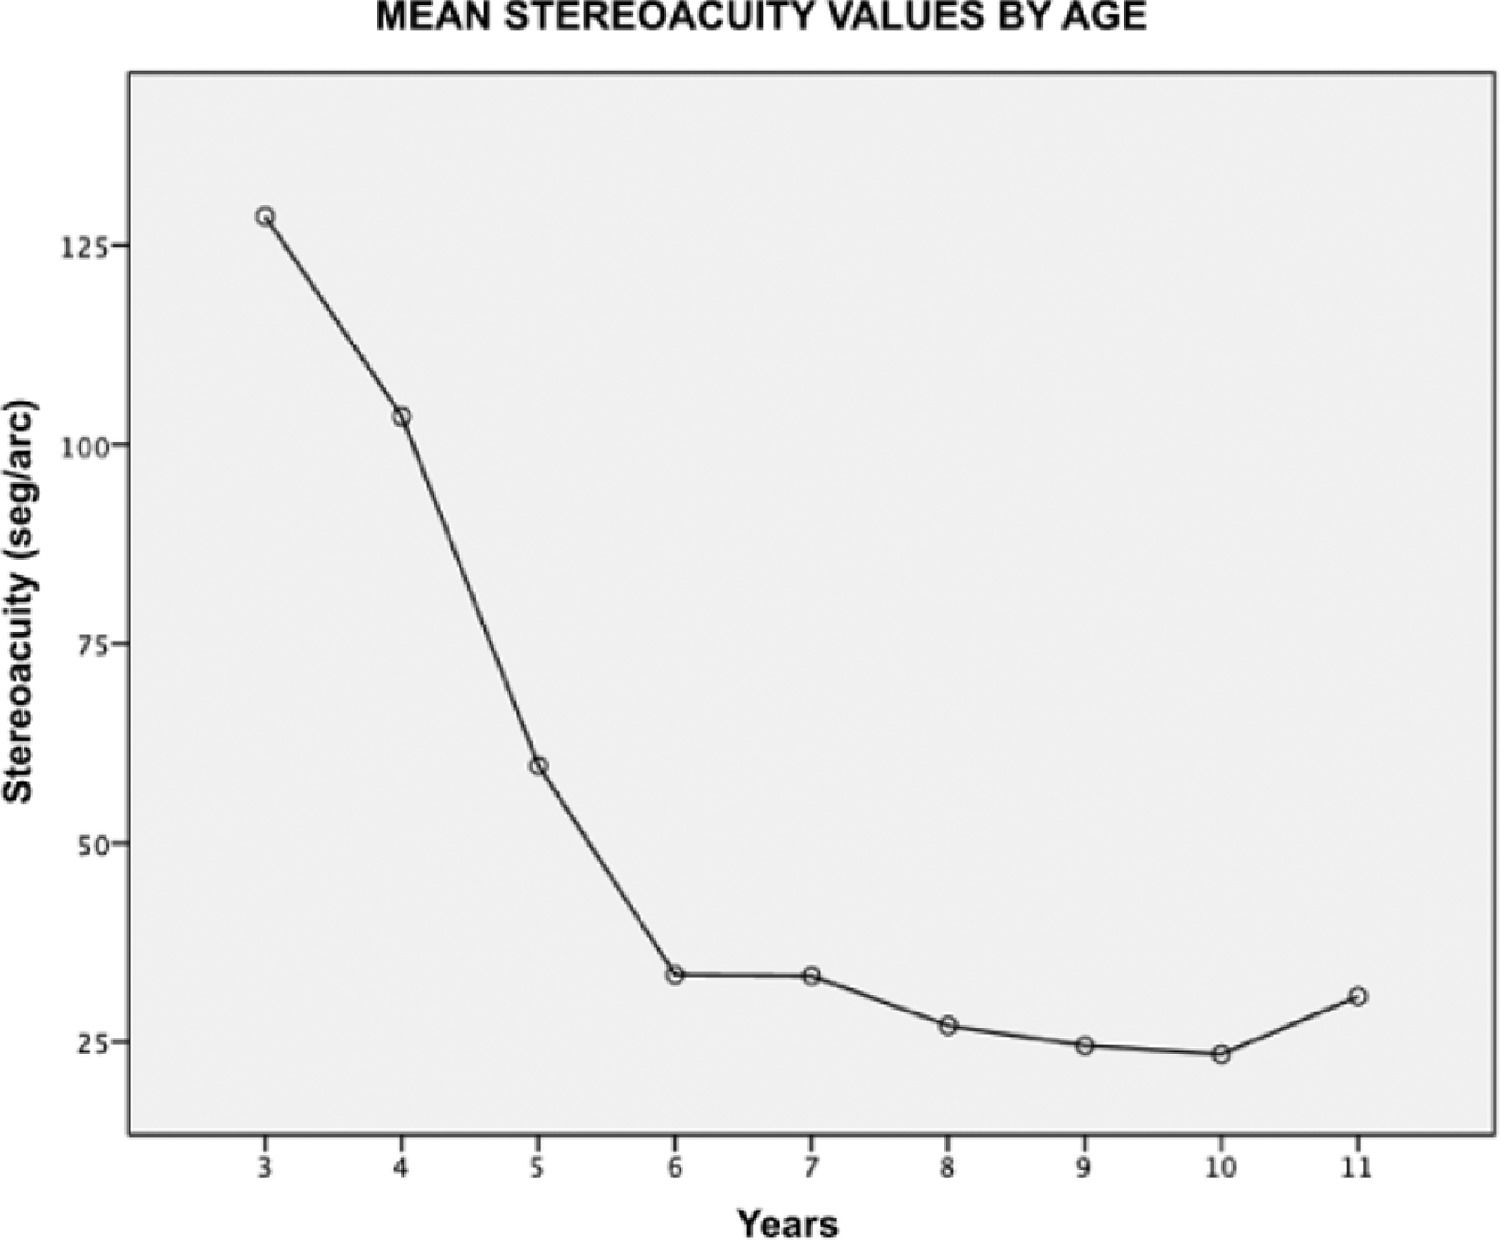
The main objective of this study was to obtain percentile curves of stereoacuity in arc seconds in a Spanish population aged between three and twelve years old.
The stereoacuity of 1300 children was evaluated and analysed. In the 50th percentile curve, it was determined that stereoacuity values close to 40 sec/arc began to be observed from four years of age, and at four years and nine months stereoacuity values close to 28 sec/arc were already being observed within said percentile, with values very similar to those expected in the adult population. From that point, a progressive increase was observed, reaching 19 sec/arc before six years of age, with this value of stereoacuity becoming more established from seven years of age.
The determination of stereoacuity as part of an early visual screening is a key part of the visual examination protocol, as it not only provides information on the existence of differences in the visual abilities of each eye, such as visual acuity, but it also informs us of the implications in terms of their development. Furthermore, a study carried out by Wang et al, concluded that the stereoacuity values obtained with the Randot stereoacuity test in far vision can serve as a good indicator when monitoring the progression of strabismus, by tracking changes in stereoacuity.10 Therefore, it is important to obtain normative values for their development within the paediatric age group.
As mentioned in the introduction, the tests used in clinical practice can prove complex when trying to determine stereoacuity in younger patient groups. Therefore studies must be conducted in order to determine which tests can be used with paediatric patients. Read et al recently concluded that the Randot test was suitable for determining the presence or absence of stereoacuity in the paediatric population, and that, likewise, this test can be used to confirm age-dependent variations in stereoacuity. Nonetheless, they also concluded that the ability of this test to quantify such values in children aged under five years of age is relatively poor.3 The Randot test is based on discriminating patterns in random dots, and it is one of the most widely used tests in clinical practice. However, Afsari et al reported that the Randot Preschool stereoacuity test was the most reliable and replicable of all of the tests that were compared in their study.11 Piano et al published a study in 2016, which compared different stereoacuity tests for both near and far vision, in which it was determined that the Randot test provided higher stereoacuity values than the other tests, such as the TNO, in far vision. In this study, the Frisby test provided the highest values in near vision.12
The use of electronic devices or mobile applications is increasing, as well as its comparison with more conventional tests. Bonfati et al.13 carried out a study in which several stereoacuity tests which were performed using the SAT mobile app were compared. This mobile application is available for Android and it determines stereoscopic visual acuity by observing random dot patterns. Taking into account that their clinical significance is similar, better stereoacuity values were obtained through this application than through conventional tests. Therefore, these tests are an excellent tool in order to determine this variable.
Very few studies have attempted to obtain normative stereoacuity values in the paediatric population, with the Randot test being the most commonly used test in said studies, alongside the Titmus fly test and the TNO.3,11,12 In this study, and based on the results of the preliminary study, the decision was made for the random dot test to be used.
In addition to determining the normative values of stereoacuity, its evolution with age and its percentile curves, it is also interesting to determine the point at which paediatric patients attain values similar to those of adults, that is to say values between 40 and 20 arc seconds.14,15 By analysing the percentile curves obtained in this study, and specifically those in the 50th percentile curve, we observed that stereoacuity values close to 40 sec/arc were already present from the age of four years onwards, and that at four years and nine months, near stereoacuity values to 28 sec/arc were observed within this percentile. These are very similar to the values that are expected in the adult population. From this point onwards, a progressive increase can be appreciated, reaching 19 sec/arc before the age of six years, with the stereoacuity values becoming more established from the age of seven years.
Previous studies confirm that stereoacuity varies according to the age of the subjects. We will also prove these variations in our development of the percentile curves. Thus, in a study published by Birch, in which stereoacuity measurements were carried out using the Randot test, stereoacuity was progressively decreasing until an average value of 60 seg/arc was reached at the age of five years, a value of 40 seg/arc was reached at the age of seven years and an average value of 20 seg/arc was attained at the age of eleven years and over.16 Anketell et al. carried out another study in which stereoacuity measurements were performed using the Frisby test and the TNO test. In this study, stereoacuity variations according to the age of the subjects were also observed and values of about 10 seg/arc were reached amongst the group of older children. With regards to the values obtained using the TNO test, it was observed that lower values, of approximately 60 seg/arc, were obtained using this test, probably because of its complexity.17 Odutan et al. carried out a similar study using the Randot test. In their study, an average value of 29 seg/arc was reached at the age of six years and an average value of 21 seg/arc was reached at the age of eleven years.18
In this study, we have to highlight that the value of stereoacuity in subjects over eleven years of age suffers a slight mean decrease, seeing this decrease in the highest percentile curves. This may be due to the fact that, as occurs in the visual acuity percentile curves published by this research group, there are uncompensated refractive errors that can generate this variation in the mean values. In the case of the sample size, for the age of ten we worked with an n = 138, and for the age of eleven we worked with an n = 137.
The results of this study are comparable to those of the study by Kulp and Mitchell, which measured the stereoacuity value using the Randot test in a sample of children aged from three to seven years. As well as establishing a mean stereoacuity value, this study also determined the 25th and 75th percentiles.19 In said study, an average of 40 sec/arc was reached at the age of six years, and, for the 25th percentile, a value of 50 sec/arc was attained at four years of age. To the contrary, in the current study, a mean value of 28 sec/arc was reached at the age of six years, and a mean value of 19 sec/arc was achieved for the 25th percentile, which is a much higher value.
A study published by Almubrad analysed the stereoacuity value in a population aged from six to twelve years using the Titmus fly test.20 It was determined that not all of the subjects reached the value of 40 sec/arc by the age of twelve years, and that 99% of the analysed subjects had a stereoacuity value that was higher than 80 sec/arc by around the age of six years. In this current study, and taking the 50th percentile into account, we can see that this stereoacuity value has already been obtained in the three-four years age range, and from the age of four years onwards the value established at that percentile is much higher.
In the study by Figueroa et al. in which stereoacuity was measured using the Randot test, mean values of close to 30 sec/arc were recorded from the age of three years, with a mean value of close to 25 sec/arc recorded at the age of six years.2 These results are very similar to those recorded in the current study for the 50th percentile.
Tomaç and Altay determined the mean stereoacuity value for different age groups, using both the TNO test and the Titmus fly test. They considered the TNO test to be more reliable, concluding that at the age of 5.5 years, stereoacuity values that were similar to those of adults were already being obtained, with a mean value close to 65 sec/arc.21 The stereoacuity value in said study was much lower than the value determined in this study, given that for the five-six year age group the mean stereoacuity value was 40 sec/arc.
It is likely that the differences that exist between the studies depend on the type of test used, and as such, the normative values found are only sufficiently reliable for measurements taken with the same test. At least while there are no agreement studies considering the different stereoacuity tests used in clinical practice. The differences in the obtained values for the different age groups do not only depend on the type of test, but they also depend on the subjects, their refractive condition, the existence or non-existence of motor alterations, as well as the different conditions in which the stereoacuity sample was obtained. Notwithstanding the foregoing, the different types of tests will also determine different stereoacuity values.
One of the main strengths of this study was that the normative values presented are the only ones taken in Spain. Nonetheless, it is equally important to highlight the limitations of this study. The most important limitation, as mentioned in the visual acuity percentile study,6 was the type of sampling used. Rather than using probabilistic sampling, convenience sampling was performed, which explains why the results are not directly translatable to the entire population, therefore meaning that these curves should be understood as indicative. This aspect must be considered in future studies, and, likewise, a series of inclusion criteria, including the measurement of refraction must be created. Other limitations are the subject's reading comprehension and the test difficulty should also be highlighted as key factors. Likewise, room lighting is another key factor that should also be highlighted. In addition, in this study, those conditions in which the neurological development of the patients may alter the visual-perceptual development, nor the order of birth of the patients or their weeks of gestation were not considered. This was because the data collection was proposed as a screening for the detection of visual acuity and stereoacuity alterations in a non-clinical population.
FundingThe research has been funded by the project CAT0001305 of Cátedra Fundación Salud Visual - Universidad Europea de Madrid.
This article reflects part of the research outputs that were obtained in the research project: “Percentiles of visual acuity and stereoacuity in children (PAVEI)” niños (PAVEI)", a project that was set up under the auspices of the Fundación Salud Visual (FUNSAVI) of Universidad Europea de Madrid. We are very grateful for the trust they placed in us as we developed the different phases of the project.
Financial Disclosure: None of the authors has a financial or proprietary interest in any material or method mentioned. The research has been funded by the CAT0001305 project of the Cátedra Fundación Salud Visual – Universidad Europea de Madrid.


