


To monitor effect of caffeine on vasculature of the inner retina of high myopes
MethodsThis was a crossover, self‐control, randomized trial. Healthy young high myopes were recruited to take 200 mg of caffeine capsule and placebo capsule, randomly assigned in two visits separated by at least one week. Superficial retinal vasculature in terms of vessel length density (VD) and perfusion area density (PD) was captured and monitored using a spectral domain optical coherence tomography angiography (OCTA) machine. After baseline measurements, blood pressure (BP), intraocular pressure (IOP), and subfoveal choroidal thickness (ChT) were also monitored at 30‐min intervals till 3 h.
ResultsEighteen subjects (6 male, 24.3 ± 3.1 years) completed the study. After taking the caffeine capsule, there was a significant increase in BP (p < 0.01), and reduction in ChT (p < 0.01), with no change in IOP (p = 0.36). VD demonstrated a trend of reduction at the central 1‐mm circle, and 1‐3 mm annulus (p < 0.01) following the ETDRS grid. Reduction trend of PD appeared at the central 1‐mm circle, 1‐3 mm annulus, and the entire 3‐mm circle (p < 0.01). Compared with baseline, VD and PD reductions were significant 180 min after taking the caffeine capsule at the central 1‐mm circle, but the reduction was small (VD: by 1mm-1; PD: by 1%). Changes in other regions were not significant.
ConclusionsThe current study found significant reduction in VD and PD after taking 200 mg of caffeine capsule. Such a small amount of alteration may be clinically irrelevant.
Caffeine is an adenosine antagonist present in coffee and other beverages. It has an impact on several ocular indices, including ocular blood flow,1 retinal vessel diameter,2 and ocular accommodation.3 Its effect on intraocular pressure (IOP) has been widely studied. Consumption of caffeine caused an acute increase in IOP in glaucoma patients, but there was no significant effect in healthy individuals.4 This finding informed eye care practitioners to remind glaucoma patients not to consume caffeine prior to IOP measurement.
The choroid is responsible for the vascular supply of the outer retina, including photoreceptors at the macula. Previous studies using enhanced depth imaging (EDI) from optical coherence tomography (OCT) revealed thinning of the choroid at the fovea after caffeine intake. Vural et al.5 reported a reduction in choroidal thickness after taking one cup of Turkish coffee (with 57 mg caffeine). The choroid was thinnest two hours after intake and returned back to baseline four hours later. Altinkaynak et al.6 found a similar thinning and rebound pattern occurred after taking a 200 mg caffeine capsule. Other studies confirmed that caffeine intake could reduce choroidal thickness for a period of 2 to 4 h.78
OCT angiography (OCTA) is an advanced non‐invasive ophthalmic imaging modality. It can capture microvasculature structures of both the inner and outer retina and the choroid without the use of fluorescent dye, as used in fluorescein angiography.910 High resolution OCTA can aid detection of proliferative eye problems, including myopic choroidal neovascularization,11 diabetic retinal neovascularization,12 and microaneurysms.13 Fan et al.14 applied OCTA and found that high myopes had reduced macular vessel length density, making them more susceptible to pathological changes. Other investigators have observed reduced retinal vasculature in high myopes.15‐18 A recent study evaluated the effect of caffeine intake on retinal vessel length density utilizing OCTA19. Both the superficial and deep retinal vasculature was found reduced. It was a placebo‐controlled study involving two groups of subjects, and both eyes were included in their analysis.
High myopia is frequently associated with retinal vascular alterations, such as narrower retinal vessels or increased vessel resistance.2021 OCTA has been used to show reduced retinal vasculature of high myopes.14‐18 Further reduction due to consumption of caffeine, if any, could have negative impact to physiology of the macula. It is worth of testing the effects of caffeine intake in high myopes. The current study used a placebo‐controlled balanced crossover study to monitor effects of caffeine on the vasculature of the inner retina of healthy high myopes.
MethodsSubjectsHealthy high myopes were recruited mainly at The Hong Kong Polytechnic University campus. Inclusion criteria were aged between 20 and 29 years, spherical equivalent refraction (sphere plus half cylindrical component) of more than ‐6.00D, and non‐smokers. Subjects were required to refrain from taking caffeine containing beverages for 24 h prior to visiting the campus Optometry Clinic. Exclusion criteria were subjects diagnosed with any ocular or systemic diseases. Written informed consent was obtained before the ophthalmic examination. All procedures adhered to the tenets of the Declaration of Helsinki for research involving human subjects. The University Institutional Review Board approved this study (HSEARS20170613002).
An initial visit was arranged and baseline measurements obtained, including blood pressure, body mass index (BMI), ocular biometry (IOL Master, Carl Zeiss Meditec, Jena, Germany), non‐contact tonometry and optical pachymetry (NT‐530P, Nidek Co., Ltd., Gamagori, Japan), and Goldmann applanation tonometry (GAT). Choroidal thickness was measured using a spectral domain OCT 2 (Spectralis, Heidelberg Engineering, Inc., Heidelberg, Germany), and OCTA using the Cirrus 5000 with AngioPlex (Zeiss Meditec, Inc., Dublin, CA, USA).
It took approximately 30 min to complete the baseline measurements. Subjects were then randomly assigned to take either a 200 mg caffeine capsule (SAN Nutrition, SAN Corp. Oxnard, USA) or a 200IU Vitamin capsule (GNC Natural E 200, Nutra Manufacturing, South Carolina, USA). Subjects were not informed about the ingredients of the capsule. The European Food Safety Authority (EFSA) published Scientific Opinion on the Safety of Caffeine in 2015, advising that caffeine intakes from all sources up to 400 mg per day or a single dose of 200 mg do not raise safety concerns for adults in the general population.22 Ocular parameters were measured 30, 60, 120, and 180 min after taking the capsule. For monitoring ocular changes, one eye was randomly selected and ophthalmic measurements, including axial length, non‐contact tonometry (NCT), OCT, and OCTA were performed. GAT was measured again only at the end of the study due to the invasive nature of applanation tonometry. Blood pressure was monitored in all four follow‐up measurement points.
After a washout period, at least one week, subjects returned and repeated all the procedures by taking other capsule not taken previously. All the measurements in the two visits were conducted between 9am and 1pm to avoid diurnal variation of ocular parameters.23
OCT and OCTA measurementsFor OCT, corneal curvature was entered into the Spectralis system to avoid potential magnification errors. This device utilized a light source with a peak wavelength of 870 nm and a scanning speed of 40,000 A‐scan/sec to provide cross‐sectional retinal and choroidal images with axial resolution of 3.9 μm and transverse resolution of 14 μm. The acquisition setting included 31 B‐scans at 240 µm intervals covering a 30°×25° area centred at the macula. The built‐in TruTrack Active Eye Tracking software (Heidelberg Engineering GmbH) was turned on. Each B‐scan included an average of 30 images. The high resolution mode was used, and the EDI mode was turned on. The first acquired image was set as reference and all the following images at different time points were captured according to this reference map to ensure the same position was being scanned.
Subfoveal choroidal thickness was manually measured on another day by an experienced observer masked to the measurement condition. Choroidal thickness was measured from the outer portion of the hyper‐reflective line corresponding to the retinal pigment epithelium to the inner surface of the sclera. All measurements were performed in 1:1 μm viewing mode24 and 2X magnification was used during measurement.
For OCTA, a 3 × 3 mm macular area was scanned using the angiography mode from the Cirrus system. Signal strength was at least 7 with no glare or motion artefact in the image13. Retinal vessels at the superficial retinal layer (from internal limiting membrane to the inner plexiform layer) were delineated using the AngioPlex software provided by the manufacturer. OCTA metrics including vessel length density (total length of perfused vasculature per unit area in the region of measurement), and perfusion area density (total area of perfused vasculature per unit area in the region of measurement) were provided by the AngioPlex software (version 10) using the ETDRS format. The ETDRS grid divided the 3 × 3 mm macular area into a central 1‐mm circle, and a parafoveal 1‐3 mm annulus. The 1‐3 mm annulus could be further divided into the nasal, temporal, superior and inferior quadrants. Liu et al.25 applied OCTA and found regional variation of vessel density from axial elongation. The foveal avascular zone (FAZ) area was not considered in this study because the proprietary software could not generate repeatable results.26 Furthermore, Karti et al.19 did not find a significant change in FAZ one hour after caffeine consumption in healthy subjects.
Statistical analysisPrior to data collection, the minimum sample size required was estimated based on changes in subfoveal choroidal thickness after caffeine consumption,6 with an alpha of 0.05 and power of 0.80. A sample size of 16 subjects was projected using G*Power 3.1 software.
We used Generalized Estimating Equations (GEE) to compare intake of caffeine and placebo (Visit) and points of measurement (Time) for each dependent variable. Visit and Time were set as within‐subject variables. GEE is powerful to analyse both normal and non‐normal repeatedly measured outcome data. Whenever significant difference at 5% for Time or interaction (Visit × Time) was found, pairwise comparisons (with Bonferroni adjustment) were conducted to compare which measurement points had significant difference with baseline. All tests were performed with SPSS Statistics version 26 (IBM SPSS Statistics, IBM Corporation).
ResultsEighteen subjects were recruited, 6 male and 12 female. Their mean age was 24.3 years (SD 3.1). The average spherical equivalent was ‐8.05 ± 1.71D (‐6.00 to ‐11.75D) in the examined eyes. Analyses included 11 right eyes and 7 left eyes.
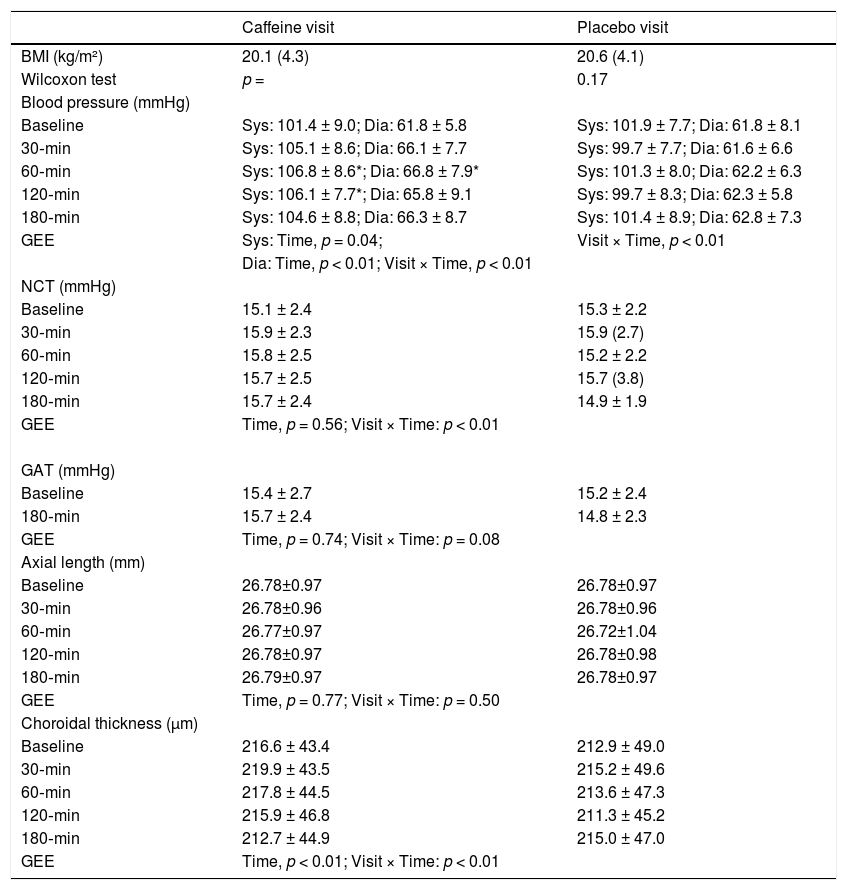
Table 1 shows BMI, blood pressure, NCT and GAT IOP, axial length, and subfoveal choroidal thickness results. There was no significant difference in BMI at the two visits (Wilcoxon test, p = 0.17). Blood pressure had significant interaction (p < 0.01). Pairwise comparisons found significant increase in systolic and diastolic blood pressure when taking caffeine. Although a significant interaction was found in NCT IOP (p < 0.01), no measurement points had IOP significantly different from baseline. The GAT IOP and axial length were similar throughout the study (p > 0.05). Subfoveal choroidal thickness demonstrated a significant effect with Time (p < 0.01) and interaction (p < 0.01). It showed a trend of reduction when taking caffeine. However, pairwise comparisons did not find any measurement points with significant difference as compared with baseline.
BMI, Blood pressure, IOP, axial length, and choroidal thickness throughout the study (Mean ± SD, or median (interquartile range)).
BMI: body mass index.
Sys: systolic pressure.
Dia: diastolic pressure.
NCT: non‐contact tonometry.
GAT: Goldmann applanation tonometry.
GEE: generalized estimating equation.
* significant difference compared with baseline.
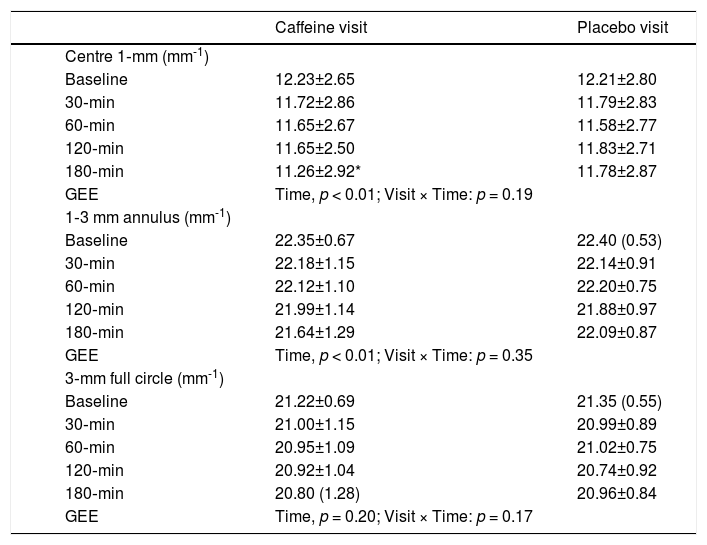
Vessel length density at the central 1‐mm, and 1‐3 mm annulus showed significant effect with Time (p < 0.01). Only VD at the central 1‐mm was significantly reduced compared with baseline after 180 min of caffeine intake. Although a trend of reduced VD at the 1‐3 mm annulus was apparent, no pairwise comparisons with baseline could reach statistical significance (Table 2). Fig. 1 shows VD at four quadrants in the 1‐3 mm annulus. No significant variation with Time or interaction was found from taking either caffeine or placebo capsules (all p > 0.05).
Vessel length density throughout the study (Mean ± SD, or median (interquartile range)).
GEE: generalized estimating equation.
* significant difference compared with baseline.
 of the superior (top), temporal (right), inferior (bottom) and nasal (left) quadrants at different time points. Upper figures: caffeine visit; Lower figures: placebo visit.")
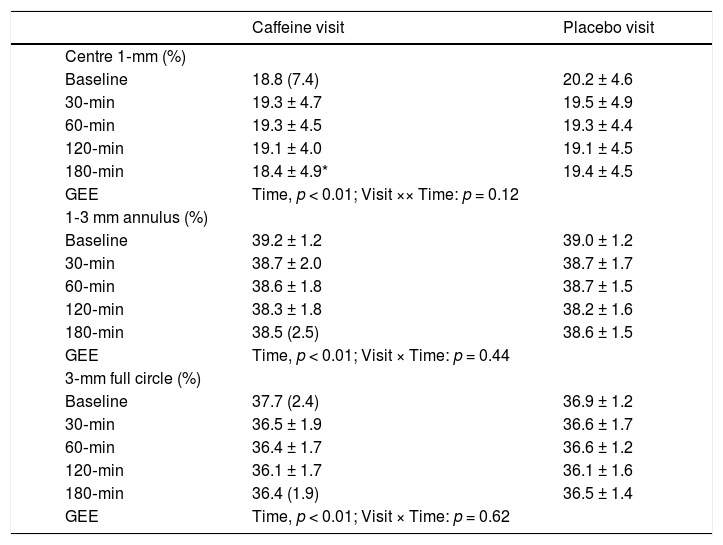
Perfusion area density results in each visit are shown in Table 3. There was significant effect with Time at the central 1 mm, 1‐3 mm annulus, and the 3‐mm full circle (p < 0.01). Pairwise comparisons revealed a significantly lower PD at the central 1‐mm circle after 180 min of caffeine intake. Fig. 2 shows PD at four quadrants in the 1‐3 mm annulus. No significant variation with Time or interaction was found from taking either caffeine or placebo capsules (all p > 0.05).
Perfusion area density throughout the study (Mean ± SD, or median (interquartile range)).
GEE: generalized estimating equation.
* significant difference compared with baseline.
 of the superior (top), temporal (right), inferior (bottom) and nasal (left) quadrants at different time points. Upper figures: caffeine visit; Lower figures: placebo visit.")
To our knowledge, the present study is the first to evaluate the effect of caffeine on retinal vasculature of the macula in high myopes using OTCA. Apparently 200 mg caffeine consumption did not change superficial retinal vasculature very much. Caffeine consumption causes IOP elevation in patients with glaucoma or ocular hypertension.2728 Although this elevation may not be clinically significant,29,30 glaucoma patients and glaucoma suspects are reminded not to consume caffeine before follow‐ up eye examination. Recent studies using a higher dose of caffeine intake revealed IOP rise in healthy adults.3132 Nakano et al.33reported that habitual coffee consumption was associated with a slightly lower IOP in healthy subjects. Kim et al.34 did not find causal effect of coffee drinking on IOP. They further concluded that effect of habitual caffeine consumption depended on genetic predisposition.
We could not identify any measurement points with IOP significantly different from baseline. This is important because acute IOP rise could result in reduced retinal vasculature. Ma et al.35 found reduced vessel density at both the macula and optic nerve head during IOP spike after laser peripheral iridotomies. Wang et al.36 had similar findings. The reduction of vessel density was more significant in radial peripapillary capillary than that of the entire retina when IOP rise was moderate, from 5 to 10 mmHg. Zhang et al.37 did not find significant change in vessel density using dark room prone provocative test to induce IOP rise. It might be due to IOP rise not great enough to induce changes in retinal vasculature.35 Our subjects had similar IOP level throughout the study. Any changes in retinal vasculature should not be due to IOP variation.
Terai et al.2 analysed retinal vessel diameter from fundus photography and found constriction of retinal vessels one hour after consuming 200 mg caffeine capsule. Retinal vasculature can be evaluated non‐invasively using OCTA. Our placebo‐controlled balanced crossover study revealed some effects of 200 mg caffeine on superficial retinal vessel length density/perfusion area density in healthy high myopes. Although there was a trend of reduced vessel length density (Table 2) and perfusion area density (Table 3), compared with baseline, only the central 1‐mm circle had significant reductions 3 h after caffeine consumption. When macular regions were segregated into four quadrants, all quadrants had similar vessel length and perfusion area densities compared with baseline. Karti et al.19 found significant reduction in vessel length density one hour after caffeine intake, which involved all four quadrants of the macula. Liu et al.25 found that inferior nasal sector was less susceptible from axial elongation. They hypothesized that it could be related to larger blood flow area in the nasal region.38
It is not surprising to find a trend of reduced retinal blood vessel area (perfusion area density) following caffeine consumption. Caffeine exerts its antagonist effect at adenosine A2A receptors39 leading to vasoconstriction.40 Changes in superficial retinal vasculature could be due to vasoconstriction. Such decreasing trend was not obvious from taking placebo. However, the reduced vasculature was minimal (vessel length density: reduced by 1mm-1, Table 2; perfusion area density: reduced by 1%, Table 3) 3 h after caffeine consumption. This may be due to limited sensitivity of OCTA to detect the small physiological changes in capillaries related to caffeine intake, which could differ from pathological changes, such as those observed in diabetic retinopathy,4142 high myopic choroidal neovascularization,11 or age‐related macular degeneration.4344
Jung et al.45 reported that amount of astigmatism could influence OCTA vessel length density and perfusion area density at different quadrants. It could be due to optical blur across different meridians because current OCTA systems incorporate only spherical lens to compensate refractive errors. However, our subjects did not have much astigmatism. The mean astigmatism was ‐1.00D (SD0.64D).
Even though caffeine causes vessel constriction, it requires vessel diameter to be reduced to an extent quantifiable using perfusion area density or to an extent at which the capillaries are no longer detectable (vessel length density). OCTA uses different technologies to detect flow of red blood cells against static retinal tissues in order to reconstruct the retinal vasculature.9 In the current study, microvasculature of the superficial retina was captured using an optical micro‐angiography (OMAG) algorithm from the Cirrus AngioPlex. The OMAG algorithm appeared to perform better than other OCTA algorithms, such as split‐spectrum amplitude decorrelation angiography algorithm (SSADA) or OCT angiography ratio analysis (OCTARA) .46 The OMAG algorithm has fewer motion artefacts than the SSADA.4748
Although OCTA is now commonly used in ophthalmic practice, this technology is limited by severe artefacts, including shadow, defocus, and movement artefacts during acquisition.49 Averaging multiple OCTA acquisitions could enhance image quality5051 and be more sensitive in detecting differences,52 especially when the scan size is large (such as 6 × 6 mm) with low resolution in pixel/mm.53 Previous studies have documented the advantage of image averaging in examining retinal vein occlusion54 and diabetic retinopathy.55 Only one high quality OCTA image was captured in the current study, which could be due to the instrument being incapable of detecting small changes.
Another explanation for the small change in retinal vasculature could be related to the amount of caffeine used. Our subjects took a 200 mg caffeine capsule which was commonly used in previous studies.26756 Recent studies about the effect of caffeine on IOP or accommodation adopted 4 mg/kg.31325758 Other studies used 5 mg/kg5960 or even 7 mg/kg.61 Based on the weight of our subjects, the dose of caffeine intake was between 2.5 to 4.7 mg/kg. This amount could be considered low. Caffeine intake based on body weight should be used in future studies. We did not record menstrual cycle phases of female subjects. However, Kamimori et al.62 found that menstrual cycle did not alter pharmacokinetic of caffeine. We believe that gender should not be a determining factor in the results.
Some limitations were identified in the current study. The analyses were restricted to the superficial retinal vasculature due to the available OCTA metric provided by the proprietary software. Other research groups used customized algorithms to derive middle and deep capillary plexuses.63 Another limitation was not differentiating low and high caffeine consumers. Vera et al.31 found that caffeine induced greater IOP change in low‐caffeine consumers. Therefore, the ocular effect could be subject to caffeine tolerance. We did not exclude regular coffee drinkers who might also have greater caffeine tolerance. We monitored subjects for 3 h only. Future studies should monitor caffeine effects for a longer period. Effect of caffeine on subfoveal choroidal thickness could last for 4 h and it took 6 h for it to return to baseline level.56 The caffeine intake used in the current study was relatively small based on subjects’ body weights. Finally, the sample size was small, with only 6 male and 12 female, and limited to healthy young high myopes. Effect of caffeine in other refractive groups and also patients with ocular pathologies warrants further studies.
Llanas et al.64 highlighted the importance of considering ocular magnification from axial length in OCTA. Axial length of the subjects’ eyes ranged from 25.2 to 29.0 mm. Actual vessel length density could be 5% to 20% smaller than the reported values.65 However, our study included within‐subject comparison and effects between taking caffeine and placebo were still valid.
To conclude, consuming 200 mg caffeine in high myopes reduced subfoveal choroidal thickness and constricted retinal vasculature of the superficial capillary plexus. There was a trend of reduced vessel length density and perfusion area density, which, although small, lasted for a few hours.
Statement of EthicsWritten informed consent was obtained before any ophthalmic examination.
Funding supportNone.
Authors contributionV.K.M.L. and A.K.C.L. designed the study; V.K.M.L. collected the data; V.K.M.L. and A.K.C.L. analysed and interpreted the data; A.K.C.L. wrote the manuscript; V.K.M.L. and A.K.C.L. involved in final approval of the article.
We thank Dr Bing Zuo and Mr Horae Wong in choroidal thickness measurement. We thank Dr Maureen Boost to provide English editing service. Part of the results of this study was presented at the 2019 American Academy of Optometry Annual Meeting


