


To investigate changes in tear film surface quality after commencing soft contact lens wear.
MethodsTear film surface quality (TSQ) was assessed during the interblink period using dynamic videokeratoscopy at 25 Hz. A quantitative value of TSQ is derived for each raw Placido ring image. Eleven young subjects with normal tear characteristics participated in the study. Dynamic videokeratoscopy was taken three times per day; in the morning, at lunchtime, and in the afternoon. This was done on two baseline days (bare eye) and on the first and seventh days of lens wear for a conventional hydrogel lens and following a week of no lens wear, for a further week of silicone hydrogel lens wear. Additionally clinical tests to assess TSQ were conducted and subjects were also asked to rate the subjective dryness of their eyes.
ResultsAll lens wear measurements showed a significant worsening of TSQ compared to bare eye measurements (repeated measures ANOVA, P<0.01). A significant diurnal change was found on the first day of silicone hydrogel contact lens wear, where TSQ improved during the day (P=0.045). However, no diurnal changes were found in TSQ for the other lens wearing days or for the bare eye condition (P>0.05). The subjective rating of dryness correlated with TSQ values (Pearson's r=0.62, P<0.05) for the bare eye condition, but not during contact lens wear. TSQ derived from the right and left bare eyes of the same individuals showed a significant correlation (Pearson's r=0.61, P<0.05).
ConclusionsThe measurement of TSQ using dynamic videokeratoscopy differentiates between bare eye and lens wearing conditions. It also shows a small systematic improvement in tear surface quality during the first day of silicone hydrogel lens wear and a significant association with subjective dryness for the bare eye condition.
Investigar los cambios en la calidad de la superficie de la película lagrimal tras empezar a utilizar lentes de contacto blandas.
MétodosSe evaluó la calidad de la superficie de la película lagrimal (CSPL) durante el periodo comprendido entre dos parpadeos consecutivos utilizando videoqueratoscopia (topografía corneal estándar) dinámica a 25 Hz. Para cada imagen registrada de los anillos de Plácido se derivó un valor cuantitativo de la CSPL. En el estudio participaron once sujetos jóvenes cuya lágrima presentaba características normales. Se realizaron medidas de videoqueratoscopia dinámica tres veces al día: por la mañana, a la hora de comer y por la tarde. Estas medidas se llevaron a cabo primero, en dos días distintos, para recabar datos de referencia (ojo desnudo, sin lente de contacto); posteriormente, el primer y el séptimo día de uso de una lente de contacto convencional de hidrogel y finalmente, y tras una semana sin utilizar lentes, se realizaron medidas el primer y el séptimo día de uso de una lente de hidrogel de silicona. De manera complementaria, se llevaron a cabo pruebas clínicas adicionales para evaluar la CSPL y se realizó una evaluación subjetiva, en la que se pidió a los sujetos que evaluaran el grado de sequedad de sus ojos.
ResultadosTodas las medidas realizadas en ojos portadores de lentes mostraron un empeoramiento significativo de la CSPL respecto a las medidas realizadas en el ojo desnudo (ANOVA de medidas repetidas, P<0,01). Se produjo una variación diurna significativa en el primer día de uso de lentes de contacto de hidrogel de silicona, observándose una mejora de la CSPL a lo largo del día (P=0,045). Sin embargo, no se produjeron variaciones diurnas de la CSPL en los restantes días de uso de lentes de contacto o en el caso del ojo desnudo (P>0,05). Se halló una correlación entre el grado de sequedad evaluado subjetivamente y los valores de la CSPL (r de Pearson = 0,62; P<0,05) para el caso de ojo desnudo, pero no para el caso de uso de lentes de contacto. Se observó una correlación significativa entre los valores de CSPL obtenidos para el ojo derecho y el ojo izquierdo de un mismo individuo en el caso de ojo desnudo (r de Pearson = 0,61; P<0,05).
ConclusionesLa medida de la CSPL utilizando videoqueratoscopia dinámica es capaz de discriminar el caso de un ojo desnudo del ojo portador de lente de contacto. Asimismo, también se muestra una ligera mejora sistemática en la calidad de la superficie lagrimal durante el primer día de uso de lentes de hidrogel de silicona, así como una relación significativa con el grado de sequedad subjetivo percibido en el caso de ojo desnudo.
The tear film is important for the optical quality of the eye and the health of the ocular surface. From the optical perspective, the role of the tear film is to form a smooth and stable refracting surface over the cornea. However, the pre-ocular tear film is constantly changing. It undergoes a formation (build-up) phase immediately after a blink, a relatively stable inter-blink phase and eventually an unstable phase which can result in break-up in subjects with dry eyes or when the eye is left open for a sufficiently long period of time.1-2
Tear film stability can be assessed with a number of invasive and non-invasive techniques. In traditional clinical practice, an invasive procedure of estimating tear film break-up time (TBUT) is performed using a slit lamp biomicroscope with the aid of fluorescein dye.2 Although the procedure is convenient, the instillation of a fluorescent dye can change the condition of the original tear film and may cause its destabilisation.3 Therefore, non-invasive methods for evaluating the quality of tear film are preferred. Also, one may be interested in the quality of tear film surface before its break-up is observed.
There are a number of non-invasive methods that can be used to estimate the quality of tear film. For example, a Tearscope can be used to project a grid pattern on a corneal surface.4,5 The time after a complete blink to the appearance of a discontinuity in tear film coverage or a distortion in the grid pattern is normally taken to indicate the TBUT, while the quality of the reflected grid pattern can be used to subjectively assess tear film quality. Methods adopting interferometry,6,7 Shack-Hartmann wavefront sensing,9-11 curvature sensing,12 and methods based on direct video recording,13 have also been used to estimate the tear film quality. However, these methods often investigate only a small portion of the tear film surface, may be sensitive to eye movements (interferometry and curvature sensing) and can be influenced by natural changes in pupil size (wavefront sensing).
Evaluation of tear film stability with a digital videokeratoscope is one of the non-invasive techniques developed in recent years.14-17 Most of the currently available videokeratoscopes are based on the Placido disk principle. During the measurement, the pre-corneal tear film is used as a convex mirror to view the reflected Placido ring pattern. Although the main purpose of a videokeratoscope is to estimate corneal topography, the raw videokeratoscopic images of the reflected Placido disks can also be used to assess tear film quality since the Placido target is reflected from the anterior surface of the tears. The Placido disk videokeratoscope can then be considered as a method for non-invasive tear film assessment following the principles first envisaged by Mengher18 and later developed by Brown and Cho19 and Guillon.5 To measure tear dynamics over time, the technique must use a series of videokeratoscope images (a video recording) and this approach has been termed high speed (or dynamic) videokeratoscopy (HSV).20,21
Several research groups have reported their work on non-invasive tear film characterization using time-based videokeratoscopy measurements.14-17 In these studies, changes in corneal power maps,15 root mean square (RMS) value of corneal aberrations,16 and surface regularity and surface asymmetry indices14,17,20 were used as indicators for estimating tear film stability. However, all the above indicators are derived from the reconstructed topographic data which can become inaccurate when the tear surface becomes locally irregular. Furthermore, all these methods suffer from a decrease in accuracy due to natural micro-movements of eye position.22 To overcome some of the limitations of previous methods based on videokeratoscopy, we recently reported methods that were independent of the eyes natural micromovements for analysis of tear film stability,23 and in particular, techniques for estimating the tear film build-up and break-up times.
Various studies have shown that contact lens wear destabilizes the tear film.24-26 During contact lens wear the tear film is separated by the contact lens into a pre- and post-lens tear film. The lipid layer of the pre-lens tear film is much thinner than that over the same eye without lens wear.25 The thickness of the aqueous phase of the pre-lens tear film seems to be dependent on the lens material and design, but is always thinner than without lenses.24 The naturally occurring mucins of the ocular surface are present on the surface of soft lenses but are typically altered in volume and surface charge.27 The combined changes in lipid, aqueous and mucin components of the tears layer on soft lenses appears to lead to impaired stability of the tear film, making it more vulnerable to disturbances and evaporation, particularly in subjects with dry eyes.28,29 A study of tear film breakup on hydrogel lenses using static videokeratoscopy has been reported earlier,30 where the raw Placido disk images were used to assess the number and location of break-ups.
In this study, we report on the evaluation of tear film surface quality during the inter-blink interval using the dynamic videokeratoscopy technique. Tear surface quality was assessed in a group of subjects for eyes without contact lenses and again during wear of hydrogel contact lenses and silicone hydrogel lenses.
MethodsClinical ProtocolEleven subjects (six male and five female) aged 20 to 31 years (mean age 23 years) were recruited for the study. All subjects had corrected visual acuity of 6/6 or better in both eyes and were emmetropic or had a slight refractive error (sphere power ranged between +/−1 D, cylinder power no more than 1D). All subjects had good ocular and general health and each was screened for anterior eye conditions that could contraindicate contact lens wear. No subject reported a history of significant dry eye symptoms and none had worn contact lenses for at least one month prior to the commencement of the study. All subjects gave informed consent and the study was approved by the university research ethics committee.
The study was conducted over four consecutive weeks although not all subjects completed all four weeks. During the first week, no contact lenses were worn and bare eye measurements were taken from both eyes on the first and seventh days of the week (11 subjects). In the second week, each subject wore a hydrogel lens (FDA group IV, 58%, etafilcon A), in one eye (randomly chosen) and measurements were taken in the lens-wearing eye on the first and seventh days of the week (10 subjects). Following a week of no lens wear, the hydrogel lens was exchanged for a silicone hydrogel lens (FDA group I, 47%, galyfilcon A) and measurements were taken on the first and seventh day of the fourth week (5 subjects). The reduction in the number of subjects during the week of silicone hydrogel lens wear was the result of subject dropout due to discomfort and/or time constraints. All statistical tests were adjusted to account for the different number of subjects in each section of the study.
The two contact lenses used in this study were clinically assessed as being good fits and the subjects reported them to be comfortable. All lenses had a diameter of 14.0mm, a base curve of 8.3mm and power of –1.00 D. The lenses were worn in one eye only (monovision, but not necessarily providing optimal visual correction) on a daily wear schedule. Subjects used a range of common multipurpose solutions to care for the lenses. It would have been preferable to use only one type of solution to control this study variable, but unfortunately the one solution brand we chose to use was withdrawn from the market for safety reasons during the study.
Subjects had measurements taken at three different times each day; in the morning (between 8-10 am), at lunchtime (12-2 pm) and in the afternoon (4-6 pm). Five individual high speed videokeratoscopy (HSV) measurements were taken at each measurement session. Subjects were advised to fixate on the green light in the instrument (Medmont E300 videokeratoscope) and were instructed to blink, then open their eyes (not wide, but naturally open), and to avoid further blinking during the short period of data collection. Each measurement was taken over a period of 8seconds at a videokeratoscope sampling rate of 25Hz (equivalent to one image every 40ms). Therefore each 8second measurement resulted in 200 individual measurement frames. Each subject's initial blink was included at the beginning of each 8sec recording (analysis procedure will be described later). Measurements that showed poor fixation or significant variation in the corneal apex distance to the imaging device were excluded. If the analysis area was obstructed by the eyelashes or the eyelid itself, the measurement was rejected and the subject was asked to open their eyes slightly wider during the next recording. Measurements were also repeated if tear debris or mucin were seen in the recorded images. In such cases, the subject was asked to blink a few times to flush away the debris and a new measurement was taken. The measurements were carried out in a laboratory where the temperature ranged between 22.1°C and 25.6°C with a mean of 23.6°C (±0.7°C), and the humidity ranged between 30% and 65%, with a mean of 46.9% (±7.1%) over the course of the four weeks of the study. At each measurement session, the subjects were also asked to rate the subjective ‘feeling of dryness’ in their eyes on an analogue scale from 0 to 10, where 0 represents very dry eyes and 10 represents no dry eye symptoms.
During the first week of bare eye measurements, on the morning of the first day, a range of other tear function assessments were undertaken. The tear film break-up time was measured using blue light and a slit lamp biomicroscope by instilling fluorescein and subjects were asked to blink several times and then to keep their eyes open and to suppress blinking. The McMonnies dry eye questionnaire31,32 was administered and scored. The Zone Quick (FCI Ophthalmics Inc. Marshfield Hills, MA, USA) phenol red thread test was used according to the manufacturer's recommendations to estimate tear volume. An evaluation of the anterior eye (including assessment of lid margins, lid eversion and surface staining) was also conducted using a slit-lamp biomicroscope.
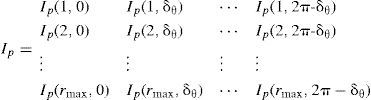
Analysis of High Speed Videokeratoscopy DataA set of images captured during contact lens wear is shown in figure 1. The quality of the ring reflections is closely associated with the quality of the tear film surface.23 Thus, the clinical problem of estimating tear film surface quality can be reduced to the technical problem of estimating the image quality of videokeratographs. In order to estimate the image quality of a HSV ring pattern, we first select a square image section, centred on the instrument's axis, and defined as intensity matrix I (x,y), x= 1,2,…, L, y= 1,2,…, L where L denotes its size in pixels. We then define a set of radial image profiles
sampled from I (x,y) using nearest neighbour interpolationmethod33 that forms an nr x nθ polar-grid matrixwhere nr=rmax and nθ=2π/δθ. Figure 2 shows two examples of such Cartesian to polar transformations.
 for an eye with a contact lens.")
 for two subjects with different pupil sizes. The intensity of the polar image of subject with smaller pupil (b) is less uniform than for subject with larger pupil size (a).")
The number of rings is then counted for each column of the matrix Ip that corresponds to a semi-meridian in the original HSV image to find out the discontinuities in the ring pattern. These discontinuities often indicate instabilities in tear film surface. To count the rings, edges in the polar image need to be detected and this could have been performed by the Marr-Hildreth edge detection algorithm,34 for example, in a similar way as described in our earlier work.23
However, changes in the characteristics of the human anterior eye pattern, such as the variation in iris color, different pupil shapes and sizes, and the natural changes of pupil size during a long measurement with HSV makes the ring detection task difficult. There are no “off-the-shelf” edgedetecting algorithms that are universally applicable for all types of eyes. Examples of how pupil size affects the reflection of the Placido rings pattern and subsequently its polar image representation are shown in figure 2. If the pupil size encompasses the analysis area, as it is shown in figure 2a, the resulting radial image representation remains of relatively uniform intensity. However, when the pupil is smaller than the analysis area (Figure 2b), the resulting radial image shows significant variations in the intensity that cannot be simply removed with standard histogram equalisation techniques.35 In particular, it can be seen that for a small pupil, part of the subject's iris is included in the sampled radial image. The contrast of Placido rings on the light colour iris is degraded, which makes it even harder to detect the sometimes-already-blurred rings.
To overcome these deficiencies, a customised edge detection method was developed, in which we first estimated the average local radial intensity image profile that was then fit to a parametric function composed of two parts. An iterative least-square procedure was used to find the optimal combination of the two parametric parts of the function. The modelled local average intensity was then subtracted from the corresponding local part of the original radial image prior to edge detection. The edge detection involved estimating all rising slopes of the radial profile using adaptive thresholding technique. The effect of using the background subtraction technique is graphically explained in figure 3 using, as an example, the image from figure 2b. The original radial image (Figure 3, top-left) has a significantly uneven intensity distribution, which causes the edge detection routine to miss significant portion of the rings in the iris area (Figure 3, bottom-left). After estimating the average intensity radial profile and fitting a parametric function to it (Figure 3, centre), we are able to subtract the average background intensity and perform edge detection on a residual radial image (Figure 3, top-right) which results in a noisier but also more complete edges (Figure 3, bottom-right). The resulting noise is of no significance because in the final step we simply count the number of edges leading to the ring number estimator
where edge[.] denotes the edge detection operator and IBS represents the radial intensity image with subtracted background information.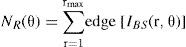

Because the tear film surface instability results in blurring and discontinuities in the ring patterns, we use the variance of the above ring number estimator
as an indicator of the tear film surface quality (TSQ) at times tn, n= 1,2,…, N. The larger the variance the poorer the quality of the ring image indicating poorer surface quality of tear film.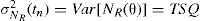
In order to achieve a parameter that would be proportional to the surface quality of tear film and that would be bounded between 0 and 1, we will use in the remainder of the paper the normalized TSQ indicator given by TSQnorm =(10-TSQ)/10, where the approximate value of 10 corresponds to the highest empirically recorded value of the TSQ during the blink (i.e., when only part of the Placido ring image is visible). Such normalization allows the study of tear film behaviour in its build-up phase. During the tear film stability phase TSQnorm is normally above 0.9.
A typical example of estimating tear film surface quality is shown in figure 4 in which one can clearly see the blink, the tear film build-up phase (up to 1st second),20 and the phase in which the tear film is relatively stable. In general, the tear film surface quality (TSQ) indicator estimated from the set of HSV data can be used to estimate three important parameters: tear film build-up time (TBLD), tear film break-up time (TBUT), and the average tear film surface quality in the relatively stable interblink phase of the tear film. In this study, we concentrated on the tear surface quality during the inter-blink period to address the question of whether contact lenses cause a measurable change in the tear surface compared with the bare eye.
 is normalised such that a score of 1 is best (i.e., good tear surface quality).")
Analysis of the videokeratoscope data (5×8 sec recordings per measurement session) was done at a later time. The first frame after the initial blink was identified in the recording. Each sample was made up of this frame plus the following 149 frames (equivalent to a period of 6seconds, see figure 4). To remove the tear build-up phase following each blink from the analysis, the TSQ data was sampled from the 26th (1sec post-blink) to the 150th frame (6sec post-blink) of each measurement (i.e., during the relatively stable inter-blink phase of the tear film). By limiting the analysis to no more than 6sec post-blink and choosing subjects with good tear quality, we also minimized the variability in TSQ that is potentially associated with both the tear build-up and break-up phases of the tear dynamics.20,23,36 The area of the tear film/cornea that was analysed was defined as the inferior half of a circular area centred on the rings with a diameter of 6mm (see figure 3). This was done to avoid possible interference from the reflections from the eyelashes, which could have been mistaken by the algorithm as changes in tear film.
Each 6second sample of 150 frames was filtered to remove outlier values and to improve the reliability of the tear surface quality mean for that sample. Firstly, the measurements in each set were detrended and their signal powers (variances) calculated. Out of these, the measurement with the smallest variance was taken as the reference measurement. Subsequently all other measurements from that data set were compared to this reference measurement. Only signals with powers within 3 dB of the reference measurement were included in the analysis.
In some cases, the filtering procedure outlined above eliminated a number of the measurements from a particular measurement session. Of the 5×8 second recordings taken at each measurement session, the lowest number remaining after filtering was two at a session and for most sessions, there were 3 or 4 recordings available for analysis and subsequent averaging. After reviewing the recordings that were eliminated by the filtering procedure, the poor measurements were mainly caused by transient local disturbances due to tear film debris and not consistent changes in the tear film quality.
Statistical analysis of normalised TSQ was performed using SPSS 15.0.1 software. Statistical procedures including the Pearson's correlation test and repeated mesures ANOVA were used. For all statistical tests a p-value of less than 0.05 was considered significant. TSQ data was assumed to be normally distributed.
ResultsDiurnal Changes with Bare EyeThe normalized tear surface quality values, TSQnorm, for the eleven subjects with bare eyes ranged from 0.8956 to 0.9897, (0.9685±0.0118; that is, mean±standard deviation) across the six measurement sessions during the first week of the study. There was no evidence of a systematic change in TSQnorm as a function of time of day from the morning 0.9685±0.0092, to lunch 0.9681±0.0101 to afternoon 0.9688±0.0075 measurement sessions. A repeated measures ANOVA showed no statistically significant effect of time of day (P=0.911) or day of week (day 1 versus day 7). Correlation in values of TSQnorm between the right and left eyes of the bare eyes of the same individuals showed a significant association (Pearson's r=0.61).
The Effect of Contact LensesThe wearing of both the hydrogel and the silicone hydrogel lenses caused the TSQ to significantly worsen (see figure 5). The group mean TSQnorm for the bare eye condition averaged over the 6 measurement sessions was 0.9668±0.0120 for the group of measurements corresponding to those of contact lens wear, while during hydrogel lens wear it was 0.9427±0.1640, and for the silicone hydrogel wearing period it averaged 0.9407±0.0179.

A repeated measures ANOVA on the effect of the type of lenses, time of day (morning, lunch and afternoon) and time of week (day 1 or day 7), showed a significant effect of contact lens wear on TSQnorm (P<0.01), but no systematic time of day or time of week effects (P>0.05). Post-hoc analysis showed that both the hydrogel and silicone hydrogel lenses gave significantly worse TSQnorm values than the bare eye condition, but that there was no significant difference in TSQnorm values between the hydrogel and the silicone hydrogel lens wear periods (P>0.05).
Repeated measures ANOVA showed a significant time of day effect for the TSQnorm values derived when wearing the silicone hydrogel lenses. The TSQnorm values improved slightly over the course of the day on day 1 of the week (P=0.045). Similar analysis of the hydrogel lens wear period showed no significant change in the TSQnorm values over the course of the day (P>0.05). There were no systematic changes in TSQnorm values for the hydrogel or silicone hydrogel lens wear periods as a function of time of week (day 1 versus day 7).
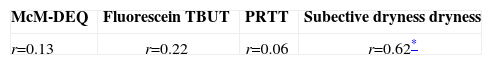
Tear Surface Quality and Other Tear TestsWe compared the tear surface quality values obtained with the bare eye condition (week 1, visit 1) with common tear function tests (McMonnies dry eye questionnaire, fluorescein TBUT, phenol red thread test and subjective dryness rating) conducted at the same visit. The results of Pearson's correlations are shown in table 1 with no significant correlations for the McMonnies dry eye questionnaire (r=0.13, P>0.05), fluorescein TBUT (r=0.22, P>0.05) or phenol red thread test (r=0.06, P>0.05). However there was a weak, but statistically significant correlation between the bare eye subjective dryness rating and the TSQ values (r=0.62, P<0.05). This association between TSQ and subjective dryness was not maintained during contact lens wear.
Pearson's correlation coefficient for TSQNorm and a range of other tear tests.
| McM-DEQ | Fluorescein TBUT | PRTT | Subective dryness dryness |
| r=0.13 | r=0.22 | r=0.06 | r=0.62* |
We found in this study that the high speed videokeratoscope technique can be used to discriminate the effects of soft contact lens wear on the surface quality of the tears compared to the bare eye condition, in subjects selected to have good tear quality. It is well known that soft lens wear leads to unstable tear film, with studies showing diminished tear break-up time,37,38 reduced tear meniscus height,39,40 and pre-lens tear thickness.4,41 Our results add to this body of evidence, showing that during soft contact lens wear the quality of the tear film is poorer in the inter-blink interval.
We can speculate on the potential mechanisms leading to changes in the tear surface quality that we measured with the high-speed videokeratoscopy technique. The Placido rings in the videokeratoscope are reflected from the anterior surface of the tears (i.e., the outer surface of the lipid layer). This is a specular reflection, like that from the surface of a mirror. A general curvature change in the shape of the tear surface would simply cause the reflected image of the Placido ring to be displaced and would not alter the TSQ value, as this is derived from the contrast of the reflected Placido ring edge. Therefore the loss of ring contrast must relate to the quality of the tear surface. This could be either due to regional changes in the refractive index of the lipid surface or due to regional changes in the surface smoothness (i.e., in engineering terms, surface roughness not surface form) of the lipid layer.
A local change in refractive index would alter the contrast of the Placido ring,42 but the change in reflection, governed by Fresnel's law of reflection, would require a large change in lipid layer composition to achieve the required refractive index variation. The image processing procedure used in our methodology also tends to minimize the effect of this potential contrast change at the ring edge. A more likely explanation for the changes in tear surface quality would seem to be the variation of surface smoothness of the tears and, therefore, the lipid layer. There are thought to be significant variations in the smoothness and homogeneity of the lipid layer amongst individuals when measured with the tearscope (Guillon 1998).43 Non-invasive tear film assessment techniques5,18,19 including high-speed videokeratoscopy23 have used the local disruption of the reflected pattern from the tears to estimate tear break-up time (see figure 1). It seems likely that the tear surface quality value that we derive measures a similar characteristic of the tear surface, but at a more subtle level than that observed in the actual break-up of the tears (seen for example with fluorescein). It may be that the TSQ is measuring tear stability at a micro scale, rather than a macro scale seen in tear break-up with fluorescein and other invasive methods.
We investigated various potential time-related changes in tear surface quality in this study. No significant diurnal changes were found in the bare-eye tear film surface quality, even though some aspects of the tear film have previously been shown to experience diurnal changes, such as the inferior tear meniscus height.44 There were no differences in the TSQ after seven days of lens wear compared with the first day of wear, neither for the hydrogel nor for the silicone hydrogel lenses. This was in spite of the fact that group-4 hydrogels (high water content ionic materials) are known to significantly accumulate lysozyme deposits45-48 and silicone hydrogel lenses are prone to lipid accumulation48-51 over contact lens wearing time. One of the more interesting findings of this study was a slight, but statistically significant improvement in TSQ during the first day of silicone hydrogel lens wear. It is not obvious why this should occur, but could be related to progressive surface deposition of mucin or lysozyme during the first day of wear.
There was no correlation between the TSQ results and the measures of fluorescein tear break-up time or tear volume (phenol red thread test). This is not surprising given that all these tests measure different aspects of tear quality and there are various studies which indicate that different tear tests frequently do not necessarily correlate with each other.52,53
The mechanism of the sensation of dryness is not fully understood and is probably multifactorial.54-56 The subjective rating of dryness did show a slight, but significant correlation with the TSQ during the six measurement sessions of the first week in the bare eye condition. However, during lens wear the measured TSQ and the subjective dryness ratings did not significantly correlate.
The use of high-speed videokeratoscopy shows promise as a method for investigating the surface quality of the tear film. The method clearly differentiated between the tear surface of bare eye and contact lens wearing conditions for both hydrogel and silicone hydrogel materials though there was no difference between the two materials. It did show a small but systematic improvement in tear surface quality during the first day of silicone hydrogel lens wear and a significant association with subjective dryness for the bare eye condition. It will be of interest to use this technique in the future to study the tear surface quality of eyes with various tear abnormalities.


