


To evaluate the quality of life and the impact of low vision services in patients with low vision.
MethodsThis prospective study evaluated visual function and vision-related quality of life in 44 Nepalese patients with low vision and compared that with age-gender matched normal population (N=40). The main outcome measure was 25-item National Eye Institute Visual Function Questionnaire (NEI VFQ-25) administered before and four weeks after the first examination. We were able to administer the follow-up questionnaires in only 23 out of 44 consecutive patients. Low vision services which included low vision devices (optical/non-optical), counseling and training were provided to all the participants. Self assessment of the low vision services was also obtained through a structured questionnaire in the follow-up patients.
ResultsThe mean composite score (49.53±14.10) and all of the subscale score in NEI VFQ-25 for the low vision population were significantly lower than age and gender matched normal Nepalese population (89.90±7.8). The mean composite score increased by 5.74±3.9 and the six out of twelve subscale scores also improved significantly after low vision services. The low vision services were associated with improvement in objective measure of visual functioning in 90.9% (40 out of 44) of the patients at the first visit and were rated useful or very useful by 73.9% (17 out of 23) follow-up patients.
ConclusionsLow vision patients have poor quality of life as measured with the NEI VFQ-25. Low vision service is associated with improved visual function, better quality of life and high rate of patient satisfaction.
Evaluar la calidad de vida y el impacto de los servicios de baja visión en pacientes con dicha condición.
MétodosEste estudio prospectivo evaluó la función visual y la calidad de vida relativa a la visión en 44 pacientes nepaleses con baja visión, comparando estos datos con los obtenidos en una población normal de edades y sexos similares (N=40). La medición principal de los resultados se obtuvo mediante el Cuestionario de Función Visual del National Eye Institute, que incluía 25 cuestiones, (NEI VFQ-25), y que se entregó con anterioridad y a las cuatro semanas del primer examen. Únicamente pudimos entregar los cuestionarios de seguimiento a 23 de los 44 pacientes consecutivos. Se proporcionaron servicios de baja visión, que incluían dispositivos de baja visión (ópticos/no ópticos), asesoramiento y formación, a todos los participantes. También se obtuvo una auto-evaluación de los servicios de baja visión mediante un cuestionario estructurado en los pacientes en los que se obtuvo seguimiento.
ResultadosLa puntuación media compuesta (49,53±14,10) y todas las puntuaciones de sub-escalas del NEI VFQ-25 para la población con baja visión fueron considerablemente inferiores a las de la población nepalesa normal, de edad y sexo similares (89,90±7,8). La puntuación compuesta media se incrementó en 5,74±3,9, al igual que seis de doce sub-escalas, que mejoraron considerablemente tras los servicios de baja visión. Dichos servicios de baja visión se asociaron a una mejora de la medición objetiva de la función visual en el 90,9% de los pacientes (40 de 44) tras la primera visita, siendo puntuados como útiles o muy útiles por el 73,9% de los pacientes en los que se obtuvo seguimiento (17 de 23).
ConclusionesLos pacientes con baja visión tienen una pobre calidad de vida, según la medición del NEI VFQ-25. El servicio de baja visión se asocia a una mejora de la función visual, una mejor calidad de vida y una elevada tasa de satisfacción del paciente.
Low vision is a widespread problem in the world, and according to the WHO the number of people with visual impairment worldwide in 2002 was in excess of 161 million, of whom about 37 million were blind and 124 million had low vision.1 The burden of visual impairment is not distributed uniformly throughout the world, largely confined to adults of 50 years or older, female and people living in the least developed regions.1 Although no nationwide survey has been conducted on the prevalence of low vision in Nepal after 1985, it has been estimated that the prevalence of low vision in Nepal is 1% of the total population.2
The presence of low vision affects functional and social life of an individual and has a negative effect on physical and emotional well being. Studies on quality of life in individuals with low vision have reported that visual impairment is significantly associated with decreased functional status, decreased self reported quality of life and increased emotional distress.3–7 Low vision rehabilitation allows people with visual impairment to use their limited residual vision as optimally as possible with the use of assistive devices and technologies and to make adaptations to activities of daily living in order to maintain functionality and independence. Various studies in other countries have shown that the self reported functional status and the quality of life improves as a result of low vision rehabilitation.3,8–11
The low vision services in Nepal are only available in a very few urban based tertiary eye care centers with a huge population with visual impairment still being out of reach of these services. National low vision program is being implemented by a nongovernmental organization since 2005 but still it is believed that the coverage of these services is only one percent.2 Though these services have been provided for many years in Nepal, the effectiveness of these rehabilitation services and the impact of low vision on quality of life in Nepalese population are unknown.
This study was aimed at investigating the Vision Related Quality Of Life (VRQOL) in patients with low vision and to evaluate the impact of low-vision services in tertiary eye care center in Nepal. Patient-reported usefulness of low vision services was also investigated.
Methods and methodologyQuality of life measureThe interviewer administered the 25 items of the National Eye Institute Visual Function Questionnaire (NEI VFQ-25) that was considered as the main outcome measure. The NEI VFQ-25 consists of twenty five items, which generates the twelve visual subscales; eleven subscales constitute independent function specific measures of visual functioning and the twelfth subscale is a single general health rating scale. The NEI-VFQ 25 subscales and overall scores were calculated using the standard scoring algorithm proposed by the developers.12 Item responses were transformed to a scale of 0–100, with higher scores indicating better quality of life. The items within a subscale were averaged together to obtain each of the 11 vision-targeted subscale scores, and the overall score on the NEI-VFQ 25 was calculated from the average scores of all the vision-targeted items.
The NEI VFQ-25 has been used in numerous studies, and is proven to be a valid and reliable questionnaire for a broad range of individuals with a variety of eye conditions5–7,13–16 and in various languages.17–19 Moreover, the NEI VFQ-25 has been shown to be able to detect meaningful changes associated with low vision rehabilitation services.3,8,10,11
NEI VFQ-25 was translated to Nepali and back translated to English to check the consistency in meaning. Few modifications were made in questions to make it suitable for Nepalese culture, such as driving a two-wheeler was included in driving question, local street festival (jatras) was included instead of movies. Face validity was done with bilingual patients to ensure that both versions provided the same response with the same score.
Initial administration of the questionnaire was done before the low vision examination and the participants were called for follow-up interview at least four weeks after acquiring the low vision services. The average follow-up duration was 1.6±0.52 months (range: 1.0–3.0 months). Same questionnaire was used to obtain the scores in follow-up administration by the interviewer.
Additional questions were administered to the patients at the follow-up visit to evaluate the perceived usefulness of the low vision services. Participants were asked to rate by means of a scale from 0 (not useful at all) to 4 (very useful) the usefulness of the low vision services in helping them to do more of the things they wanted to do.
Study populationThis prospective study of one year duration (August 2008 to July 2009) evaluated 44 consecutive patients presenting for the first time at the low vision clinic of B.P. Koirala Lions’ Center for Ophthalmic Studies (BPKLCOS), Kathmandu, Nepal. All the patients were referred from the outpatient services and speciality clinics of BPKLCOS. The initial detailed ophthalmological examinations established the diagnosis and cause for low vision. Pediatric (age≤15 years) and illiterate patients were excluded from the study to ensure cooperation with examination and understanding of the study questionnaire (NEI VFQ-25). Age and gender matched normal people (N=40) having no ocular abnormalities and 0.0 log MAR or better distance visual acuity without any refractive aids in both eyes were enrolled in the study as control group. The control group is only valid for the first part of the study i.e. assessing whether vision-related QOL is normal in individuals with visual impairment. This does not provide a control group for the assessment of the effectiveness of rehabilitation.
Informed written consent was obtained from every patient prior to examination. The study was approved by the Institutional Review board of Institute of Medicine and the tenets of Declaration of Helsinki were adhered.
Low vision servicesA comprehensive Low-Vision examination was performed by an optometrist (RG) in all the patients which included a review of the patient's ocular history and visual functional complaints, establishment of goals of the low vision clinic evaluation, measurement of presenting distance visual acuity with Bailey-Lovie log MAR (3m) chart and near visual acuity with Bailey-Lovie Word Reading Chart, contrast sensitivity using Peli-Robson Contrast Sensitivity chart, measurement of prescription of current glasses, retinoscopy and refraction at distance and near, assessment of binocularity, visual field and color vision assessment.
Magnification necessary for performing specific activities (for example, reading newsprint, watching television, and writing) was determined, and training in the use of low-vision aids was provided. The optical devices available were stand magnifiers, hand held magnifiers, spectacle magnifiers, neck/chest borne magnifiers, spectacle-mounted magnifiers, spectacle-mounted telescope, handheld telescope and electronic devices such as CCTV. Non-optical devices such as reading stands, filters, money-identifier, writing guides, needle threaders were also on offer. Patients requiring orientation and mobility training were referred to Nepalese Association for Blinds for such services. The duration of each patient's low vision clinic visit lasted for 45–60min.
Data analysisData analysis was performed using Statistical Package for Social Science (SPSS) version 14.0. t-Tests were used to compare the scores of this study's low-vision patients with published scores (means) of other study populations. Paired t-tests were used to assess differences between questionnaire scores before and after low vision services.
ResultsThe majority of the participants (75%) were males. The mean age of the patients at presentation was 47.68±24.51 years which ranged from 18 years to 89 years.
The most common cause of low vision was Age Related Macular Degeneration (20%) followed by Diabetic Retinopathy (14%) and Refractive Amblyopia (14%). The other causes were retinitis pigmentosa, inherited macular disorders, glaucoma, etc.
The mean presenting distance log MAR visual acuity, near visual acuity (M) and contrast sensitivity was 0.87±0.24 (≈6/48), 2.22±1.61M and 1.18±0.44 log unit respectively, in binocular viewing condition.
Low vision servicesMost of the patients (91%) had improvement in objective measure of visual function (at least 0.04 log MAR improvement for distance vision and/or one line improvement for near vision) with refractive correction only. Among the total 44 patients, 35 (79.5%) required new spectacles because they never had any refractive correction or their habitual correction was not appropriate for their current refractive and visual condition.
“Refractive correction only” was the most common type of service provided to the patients. Most of the low vision devices prescribed were for near. Specifically, spectacle magnifier (14%) was the most common device prescribed. Telescope for distance vision was prescribed only in 2 (5%) patients (Fig. 1).

Only 23 out of 44 (follow-up response rate: 52.2%) patients came for the follow-up visit. The subjective response concerning the value of the low vision service provided is shown in Table 1. Among the 23 patients who came for follow-up low vision services proved to be helpful in 21 (91.3%) and the services were rated “very useful” by 8 (34.8%) patients. In terms of helping the patients do more of the things they wanted to do, the low vision service enabled them “as much as they expected” in 10 (43.5%) patients.
Patients’ self-assessment of rating for helpfulness of low vision services (on follow-up visit).
| Subjective response concerning the value of the low vision service | No. (%) of the patients (N=23) |
| Do low vision services enable you to do more of the things you need or want to do? | |
| Yes | 21 (93.3) |
| No | 2 (8.7) |
| On a scale 0–4, how useful are the low vision services in helping you do more of the things you need or want to do? | |
| 0 (not useful at all) | 0 (0.0) |
| 1 (of very little use) | 2 (8.7) |
| 2 (occasionally useful) | 4 (17.4) |
| 3 (useful) | 9 (39.1) |
| 4 (very useful) | 8 (34.8) |
| In terms of helping do more of the things you need or want to do, do low vision service help you less, as much or more than you expected they would? | |
| Less | 8 (34.8) |
| As much | 10 (43.5) |
| More than | 5 (21.7) |
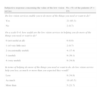
The composite score and all subscale scores were significantly lower in the low vision patients as compared to the normal sample (p≤0.001) (Table 2). Even after the low vision intervention, the scores were significantly lower in low vision group.
Comparing the NEI VFQ-25 scores of low vision cohort (N=44) with that of visually normal age and gender matched population (N=40).
| Questionnaire subscale | Low vision cohort in initial administration (A) | Visually normal population (B) | Difference between A and B (p-value) |
| General health | 36.93±21.9 | 70.71±14.2 | 33.78 (p<0.0001) |
| General vision | 39.09±18.8 | 75.43±12.0 | 36.34 (p<0.0001) |
| Ocular pain | 67.33±20.2 | 79.29±13.2 | 11.96 (p=0.0003) |
| Near activities | 47.44±18.9 | 89.76±9.5 | 42.32 (p<0.0001) |
| Distance activities | 47.25±18.9 | 93.32±6.0 | 46.07 (p<0.0001) |
| Social functioning | 53.69±17.9 | 95.36±8.6 | 42.67 (p<0.0001) |
| Mental | 42.69±20.2 | 86.96±10.3 | 44.27 (p<0.0001) |
| Role difficulties | 42.89±26.5 | 90.36±10.5 | 47.47 (p<0.0001) |
| Dependency | 47.35±20.9 | 90.47±12.3 | 43.12 (p<0.0001) |
| Driving | 55.26±20.6 | 80.36±20.0 | 25.10 (p<0.0001) |
| Color vision | 77.27±25.2 | 95.00±10.1 | 17.73 (p=0.00003) |
| Peripheral vision | 63.64±21.9 | 94.89±10.4 | 31.25 (p<0.0001) |
| Composite score | 49.53±14.1 | 89.90±7.8 | 40.37 (p<0.0001) |
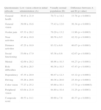
We found significant ceiling effects for color vision subscale (initial visit 45.4%, follow-up visit 56.5%), ocular pain subscale (initial visit 13.6%, follow-up visit 21.7%) and peripheral vision subscale (initial visit 15.9%, follow-up visit 26.09%) but no significant floor effect was observed in any of the subscales of NEI VFQ.
Table 3 compares the initial and follow-up scores in each NEI VFQ-25 subscales and the composite score. The mean rise in overall NEI VFQ-25 score was 5.74±3.9 which was statistically significant. The table clearly shows a significant improvement in the scores of near activities, distance activities, social functioning, mental functioning and dependency. The calculated effect size (using the formula Effect Size=(Composite score for follow-up visit−Composite score for initial visit)/Standard Deviation of composite score for initial visit) was 0.41.
Summary statistics showing the difference in NEI VFQ-25 scores before and after low vision services (N=23).
| Questionnaire subscale | Initial administration | Follow-up administration | Difference in score | p-Value |
| General health | 39.1±23.6 | 38.0±21.1 | −1.087±16.0 | 0.747 |
| General vision | 44.4±19.1 | 47.8±15.7 | 3.478±14.3 | 0.257 |
| Ocular pain | 76.6±20.8 | 77.7±17.3 | 1.087±10.6 | 0.628 |
| Near activities | 54.0±19.1 | 62.3±14.2 | 8.335±11.0 | 0.001 |
| Distance activities | 55.3±19.7 | 61.4±17.0 | 6.160±8.3 | 0.002 |
| Social functioning | 56.0±18.4 | 59.8±18.1 | 3.804±7.9 | 0.031 |
| Mental functioning | 46.4±21.3 | 54.3±20.5 | 7.897±9.5 | 0.001 |
| Role difficulties | 49.5±29.8 | 57.1±25.5 | 7.609±8.2 | <0.001 |
| Dependency | 52.9±20.7 | 62.0±17.4 | 9.061±8.7 | <0.001 |
| Driving | 68.1±14.1 | 63.9±19.2 | −4.167±8.8 | 0.195 |
| Color vision | 80.4±28.2 | 79.3±27.9 | −1.087±11.9 | 0.665 |
| Peripheral vision | 68.5±25.3 | 69.6±22.6 | 1.087±16.0 | 0.747 |
| Composite score | 55.9±14.2 | 61.69±12.9 | 5.744±3.9 | <0.001 |
The p value <0.05 was considered statistically significant and is shown in bold numbers.
The health related quality of life, especially for ophthalmic patients, seems to be a newer concept in Nepalese healthcare system. This study is the first to translate and use the NEI VFQ-25 in Nepal and to evaluate the low vision rehabilitation services in Nepal. These findings are of most interest to low vision clinicians and researchers, health service managers, government and policy makers. The understanding of the impact of low vision on quality of life is necessary for developing appropriate rehabilitation programs and services, and demonstrating the effectiveness of such services is important for funding purposes and planning service delivery.
The low vision group in this study had significantly lower scores than the normal Nepalese population for all the subscales and composite score of NEI VFQ-25. This confirms that the impairment in visual functioning has an effect on the measure of quality of life as suggested in other studies.3,8,10,11,13,20
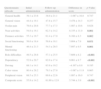
Table 4 compares the results of this study with various other studies conducted in western countries. One of the main differences between this study and the other studies compared in Table 4 is the mean age of the participants. Our study population is much younger than the study population in other studies. Though the direct comparison may not be accurate due to the significant difference in sample population, our findings showing lower quality of life in low vision patients are consistent with other studies that have compared the low vision cohort with a reference group and found that this visually impaired cohort demonstrates a greater degree of self reported visual dysfunction.3,10,13,20 The comparison of NEI VFQ-25 outcomes of our overall sample of low vision with the outcomes of a previously reported low vision sample13 reveals similar findings in general vision, social functioning, mental functioning, role difficulties, dependency, color vision and peripheral vision. The score of near activities and distance activities was significantly higher for our study sample which may be attributed to the higher level of presenting visual status. General health and ocular pain were the only subscales that had lower subscale score for our study population as compared to other studies which might be due to presence of more associated co-morbidities in our study population.3,13 Taji, whose participants had similar visual status as the participants in this study, reported similar scores in distance activities, near activities, role difficulties and color vision and higher scores in all other (except for driving) subscales and composite score.10 The study of Williams et al.20 showed lower scores in all subscales except for general health and ocular pain subscales than those found in our study. It may be due to the lower visual status of their participants which also included blind persons. The driving subscale score in our study was higher than that reported in most of studies, which may be due to the inclusion of two wheeler drivers and less number of participants currently driving. When comparing with the findings of a study by Kuyk et al.11 our participants had higher scores in the subscales of general health, general vision, near and distance activities, color vision, peripheral vision and composite score. The scores are comparable in social function, mental health, role difficulties and dependency. These differences may be because Kuyk et al. included blind persons with considerably poor vision and higher mean age than in our study.
Comparing the findings of this study with other studies.
| This study (n=44) | Williams et al.20 (n=66) | Taji10 (n=120) | Scott et al.3 (n=156) | Mangione et al.13 (n=90) | Kuyk et al.11 (n=206) | |
| Study place | Nepal | United Kingdom | Canada | USA | USA | |
| Mean age | 47.7 years | 81.3 years | 76 years | 72.5 years | NAa | 70.2 years |
| Mean Distance VA | ≈6/48 | NAa (48.5% had VA<counting figure) | ≈6/36 | 6/60 (median VA) | NAa | ≈6/60 |
| Nature/cause of visual impairment | ARMD, DR, rrefractive, retinal cause (low vision) | ARMD, glaucoma, DR (blind and partially sighted) | ARMD, retinal causes, glaucoma (low vision) | ARMD, DR, glaucoma, myopia, retinal causes (low vision) | NAa | Macular diseases, glaucoma, DR (blind persons) |
| Questionnaire subscale | ||||||
| General health | 36.9±21.9 | 57.16±24.7 | 56.7±28.8 | 53.2±10.3 | 57±27 | 55.1±26.4 |
| General vision | 39.1±18.8 | 27.8±11.9 | 45.0±20.5 | 42.8±10.7 | 38±18 | 34.3±17.4 |
| Ocular pain | 67.3±20.2 | 83.9±23.1 | 84.9±22.7 | 97.3±8.3 | 85±20 | 76.2±23.9 |
| Near activities | 47.4±18.9 | 17.6±15.3 | 49.9±23.4 | 38.0±14.5 | 36±23 | 30.3±14.3 |
| Distance activities | 47.3±18.9 | 23.3±19.5 | 49.3±22.8 | 38.3±13.6 | 38±26 | 32.3±18.3 |
| Social functioning | 53.7±17.9 | 45.5±30.7 | 63.2±23.6 | 62.9±23.8 | 50±31 | 54.8±24.7 |
| Mental functioning | 42.7±20.2 | 38.1±22.9 | 54.4±23.4 | 65.9±10.0 | 46±27 | 45.1±27.9 |
| Role difficulties | 42.9±26.5 | 37.5±23.2 | 39.9±28.1 | 47.9±16.2 | 44±29 | 38.2±22.9 |
| Dependency | 47.4±20.9 | 37.5±25.7 | 58.8±29.8 | 54.0±17.0 | 51±31 | 44.5±29.7 |
| Driving | 55.3±20.6 | NA | 5.3±17.3 | 34.1±19.1 | 10±23 | NA |
| Color vision | 77.3±25.2 | 55.7±35.3 | 75.6±32.5 | 60.2±24.0 | 71±31 | 50.1±33.4 |
| Peripheral vision | 63.6±21.9 | 32.9±26.4 | 75.2±31.3 | 37.9±14.9 | 59±32 | 51.3±31.7 |
| Composite score | 49.5±14.1 | NA | 56.1±14.3 | NA | NA | 46.4±14.7 |
The composite NEI VFQ score was not significantly different for the different causes of low vision within the sample of our study, suggesting that the measure is able to provide reproducible and valid data when used across multiple eye conditions which was also suggested in a previous study.10 A study on quality of life in patients with reduced visual acuity due to ARMD and DR suggested that the reduced visual acuity rather than underlying cause was responsible for the reduced quality of life.16
Low vision service offered improvement in visual functions (near and/or distance visual acuity) in almost all the patients. Two-third of patients in this study found the low vision services to be useful or very useful. Majority (65.2%) of the patients found the low vision service helping them as much or more than their expectation. The fact that almost two third of the patients needed a new pair of spectacles implies that many patients with low vision were still un-reached with basic low vision services where they can at least get a refractive correction. “Refractive correction only” was the most common type of service provided indicating that even with the refractive correction, patients feel significant improvement in their functional vision. We agree with the view of Scott et al.3 regarding the reasons for spectacle correction only as low vision service in significant number of cases. A low vision clinician may be more experienced in low vision refraction than primary eye care providers; there is amplitude of time in low vision evaluation for refraction and there are sufficient instruments and charts which may alter the refractive findings. Indeed, the relevant role of refraction in low vision evaluation has been reported in few other studies as well. The magnifiers used for near were also associated with high rate of patient satisfaction and improvement in functional vision. Shaaban et al.21 found that majority of the Egyptian patients who received low vision services were moderately (46%) to highly (30%) satisfied with the LVS. As for the overall rehabilitation service, 94% of the patients in this study found the service was very helpful.
Though we had significant number of patients who required telescope for distance vision, it was less commonly prescribed. In contrast to the western countries where telescope is commonly used,3 it still remains un-preferred in this continent, which may be due to cost factors, finding the device difficult to use and social stigma. Other complex and multisystem devices such as CCTV, autofocus telescopes are either unavailable or are very expensive for these patients.
The follow-up response rate of 52.2% can be considered poor but acceptable taking into the account the poor socio-economic limitations of the study population. Most of the participants who lost follow-up were from outside of the capital city and older in age. Lack of awareness, poor availability of communication resources, low socio-economic status, unfavorable geographic terrains with limited transport facilities, social and individual acceptance, age factors and many other allied factors may be contributing to low follow-up rates.
An improvement in vision related quality of life should not be expected between two time intervals but should only be expected to change after the intervention but will not continue to change afterwards.22 However, as long as the condition causing the reduced vision remains untreatable, a complete improvement cannot be expected.8 A significant improvement was observed in the overall vision related quality of life score after the provision of low vision service to the patients in our study. Low vision services were associated with significant improvement in six subscales of NEI VFQ-25. Higher improvement was seen in the subscales of dependency and near activities which may be due to the adaptation of the devices for near that may have led to the individual's better independency especially for the activities such as reading newspaper and writing notes in class rooms. The subscales of distance activities, role difficulties, social functioning and mental functioning also showed significant improvement after low vision service. It may be considered that the improvement in the functions of near and distance activities may have significant role in the improvement in psychosocial functions such as dependency, mental function, and role difficulties. In a similar study exploring the impact of low vision services, Scott et al.3 found significant improvement in the subscales of general vision, near activities, distance activities and peripheral vision. However, our study did not show any significant improvement in scores of peripheral vision and general vision which can be justified in the way that the low vision services we provided did not address these subscales. Kuyk et al.11 in their study aimed at investigating the outcomes of blind rehabilitation program, found significant improvement in all the subscales except ocular pain and peripheral vision. They also shown higher improvements in near activities followed by mental health, dependency, role difficulties and distance activities. These findings support the positive effect of vision rehabilitation programs in visually impaired persons. In a study aimed at measuring the outcomes in two different low-vision rehabilitation programs, Stelmack et al.8 also noted significant improvements in scores of near activities, social function and distance activities. To confirm the findings and the clinical significance of these positive changes in scores, they emphasized on the development of a controlled clinical trial.
Despite the fact that participants were highly satisfied with the services provided and there was a significant improvement in subscale and overall score, the magnitude of increment in the score may be considered modest (‘Medium’ effect size). Vision is critical to many aspects and is determinant in the quality of life, even a slight improvement in visual performance may lead to large increase in patient satisfaction. It should also be noted that this study evaluates the change in quality of life scores in a single low vision follow-up visit during a relatively short period of time. Studies have suggested the importance of frequent follow-up low vision service and training.3,8
The limitations of the study include the validity issues, the sample size and the lack of proper control group to evaluate the effectiveness of the intervention. The translated questionnaires were checked through face validity technique only. A proper validation study is needed before the translated questionnaire can be used as a standard tool in low vision clinics. Though the initial sample represents significant portion of patients presenting to low vision clinic, the follow-up sample was relatively low in comparison to other studies. The participants who were lost in follow-up part may be the individuals who were less satisfied with the services and this may have introduced a bias on results. Involvement of the same researcher in both the interview and rehabilitation process may also have introduced some bias. The follow-up interview was conducted only after one month period of acquiring low vision services which may be considered short period for adoption to the devices and techniques provided. Further study to analyze long-term impact of such services with inclusion of proper control group is warranted.
ConclusionThis study demonstrated that the low vision patients have poor quality of life as measured by NEI VFQ-25. Patients perceive improved quality of life for vision related activities and psychosocial aspects after acquiring low vision services. Even the spectacle correction and simplest forms of assistive devices such as simple hand held magnifier are associated with high rate of patient satisfaction and improved quality of life. Provision of low vision services can bring significant improvement in near activities, distance activities, social functioning, role difficulties and dependency. Vision related quality of life questionnaires can be used in low vision clinic examination to elucidate the outcomes of rehabilitation services, however, proper modification, validation and trial with a case–control type of study is required especially in this region of world.
Conflicts of interestThe authors have no conflicts of interest to declare.
We would like to thank Prof. Dr. Jeevan Kumar Shrestha, Head of Department of Ophthalmology, BPKLCOS, for his help during data collection, data processing and critical review of the manuscript.


