


To adapt the College of Optometrist in Vision Development (COVD-QOL) questionnaire as a vision screening tool for primary school children.
MethodsAn interview session was conducted with children, teachers or guardians regarding visual symptoms of 88 children (45 from special education classes and 43 from mainstream classes) in government primary schools. Data was assessed for response categories, fit items (infit/outfit: 0.6–1.4) and separation reliability (item/person: 0.80). The COVD-QOL questionnaire results were compared with vision assessment in identifying three categories of vision disorders: reduce visual acuity, accommodative response anomaly and convergence insufficiency. Analysis on the screening performance using the simplified version of the questionnaire was evaluated based on receiver-operating characteristic analysis for detection of any type of target conditions for both types of classes. Predictive validity analysis was used a Spearman rank correlation (>0.3).
ResultsTwo of the response categories were underutilized and therefore collapsed to the adjacent category and items were reduced to 14. Item separation reliability for the simplified version of the questionnaire was acceptable (0.86) but the person separation reliability was inadequate for special education classes (0.79) similar to mainstream classes (0.78). The discriminant cut-off score of 9 (mainstream classes) and 3 (special education classes) from the 14 items provided sensitivity and specificity of (65% and 54%) and (78% and 80%) with Spearman rank correlation of 0.16 and 0.40 respectively.
ConclusionThe simplified version of COVD-QOL questionnaire (14-items) performs adequately among children in special education classes suggesting its suitability as a vision screening tool.
Adaptación del cuestionario para el Colegio de Optometristas para el Desarrollo de la Visión (COVD-QOL), como herramienta para la supervisión de la visión en niños de educación primaria.
MétodosSe realizó una sesión de entrevistas con niños, profesores o tutores en relación a los síntomas visuales de 88 niños (45 de aulas de educación especial y 43 de educación normal) en escuelas estatales de primaria. Se evaluaron los datos para las categorías de respuesta, aspectos de la adaptación del modelo (infit/outfitbb N de la T: Infit=Residual cuadrático medio ponderado estandarizado. Outfit=Residual cuadrático medio no ponderado estandarizado.
Se observó la infrautilización de dos de las categorías de respuesta, colapsando por tanto la categoría adyacente, reduciéndose los ítems a 14. La fiabilidad de la separación de ítems para la versión simplificada del cuestionario fue aceptable (0,86), aunque la fiabilidad de la separación de sujetos fue inadecuada para las aulas de educación especial (0,79), y similar a las aulas de educación normal (0,78). La puntuación de corte discriminante de 9 (aulas de educación normal) y 3 (aulas de educación especial) de los 14 ítems aportó una sensibilidad y especificidad de (65% y 54%) y (78% y 80%), con una correlación del rango de Spearman de 0,16 y 0,40 respectivamente.
ConclusiónLa versión simplificada del cuestionario COVD-QOL (de 14 ítems) se adapta adecuadamente a los niños en aulas de educación especial, lo que indica su viabilidad como herramienta de supervisión de la visión.
Current vision screening procedures for school-aged children might be inadequate as they could miss visual skills or visual information processing problems.1 Previous study reported that a higher score of the COVD-QOL questionnaire was correlated with lower academic performance.1 Children with attention deficit disorders or attention deficit hyperactive disorders (ADD/ADHD) showed higher scores than non-ADD/ADHD.2 The sensitivity and specificity of the 19-items COVD-QOL questionnaire was reported as 71% and 54% respectively based on vision screening data for the referral-score of 20 or more.3The vision screening tests consisted of visual acuity (near and far), stereopsis, near point of convergence, fusion (near and far), non-cycloplegic retinoscopy, King Devick test (a saccade test based on the measurement of the speed of rapid number naming) and vertical imbalance tests. Therefore, it was suggested that the COVD-QOL questionnaire could be a suitable choice as a vision screening instrument because it showed ability to discriminate those with vision problems and those who do not despite its traditional used to evaluate the effectiveness of vision therapy.4
Presentation of visual symptoms may lead to a reduction in visual function, academic performance and might affect quality of life in children. Visual symptoms, visual performance and academic achievements have been found to be correlated with each other.2,5,6 Children with learning disabilities have been reported to have more visual symptoms and vision disorders compared to normal children.2,6 However, clinician might face challenges to get reliable response when dealing with this group of children. It is difficult to report visual symptoms in children with learning disabilities as they may not be able to communicate or complain of visual discomfort. Consequently, the measurement of visual symptoms might be implicit and vision problems among children with learning disabilities may be left untreated. Thus, the assessment of visual symptoms in children with learning disabilities is best conducted by interviewing their parent, guardians or teachers to gain information based on their perception. Parents’ symptoms perception shows good agreement with children and is a good predictor of academic performance in children aged 9 years old and younger but not in older children.1
According to the standard procedure of the 19-items of COVD-QOL questionnaire using Likert scoring, a total score of 20 and above should be classified as a “failure” as it indicates a concern for visual problems. Mean score for those who pass and fail vision examination ranged between 14–21 and 20–33, respectively.3,4 However, recent studies reported that Likert scoring was generally not used as intended and there were poorly fitting items in the traditionally-validated questionnaire.7,8 Therefore, the evaluation of COVD-QOL questionnaire for vision screening for children in mainstream and special education classes aims to adapt the instrument as a vision screening tool and to provide baseline information on appropriate referral-score for different target population based on Rasch analysis.
MethodsParticipantsEighty-eight school children (43 from mainstream classes and 45 from special education classes) aged 7–12 years old were recruited using non-probability convenience sampling. The sample size of more than 30 is adequate for item calibrations stable within ±1 logit with a confidence level of 95%.9 Children who were diagnosed as blind or low vision were excluded from this study. Parental consent was obtained for each subject prior to this study. This study adhered to the tenets of the Declaration of Helsinki 1975 and was approved by the Ethical Committee of UniversitiTeknologi MARA. Children in special education classes was based on definition by Ministry of Education, Malaysia as “children with learning disabilities” which include children with Down syndrome, mild autism, Attention Deficit Hyperactive Disorder (ADHD), Attention Deficit Disorder (ADD), mild mental retardation and specific learning disabilities such as dyslexia.10
An interview session with the children (from mainstream classes) and teachers or guardian (of children in special education classes) was made using the shorter version of College of Optometrist in Vision Development-Quality of Life (COVD-QOL) questionnaire which consists 19 items as shown in Fig. 1.1 Interview method was preferable as the questionnaire was in English which might be needed to be translated to the spoken language of the children. The scoring method was according to the standard procedure: 0 for “never”, 1 for “seldom”, 2 for “occasional”, 3 for “frequently” and 4 for “always”. A total score of 20 and above was classified as a “failure” as it indicated a possible for visual problem.1

19 Item COVD-QOL checklist questionnaire.1
All children underwent a set of examination for evaluation of three types of vision disorders (reduced distance VA, accommodative response anomaly and convergence insufficiency). Early detection of these three components of vision disorders among school children is important due to their impacts on the academic performance and quality of life.5,6,11 Monocular VA were assessed using modified ETDRS chart with Sloan Letters (Lighthouse International, Catalogue no. C110) at 4m and the children were classified as having reduced distance VA if the VA was equal or poorer than 0.2 log MAR in either eye. Prism cover test at near and distance, step vergence test at near and near point of convergence test using Royal Air Force (RAF) rule (Clement Clarke International, model: CE 0120) were performed and the children were classified as having convergence insufficiency if they had at least two of the following signs present; 1: exophoria at near of at least 4 prism dioptres (Δ) greater than the distance heterophoria, 2: insufficient positive fusional vergence (failing Sheared's criterion of at least 15Δ to base-out break), 3: near point of convergence (NPC) greater than 7.5cm break or 10.5cm recovery.12 The children were classified as having an accommodative response anomaly if the Monocular Estimated Method (MEM) retinoscopy results was less than +0.25D or more than +0.75D.13
Statistical analysisThe analysis was performed in three stages: stage I, to assess the response scale and item fitting; stage II, to determine the cut-off score of the simplified version of the questionnaire for both types of classes and stage III to evaluate its predictive validity for each type of classes.
Rasch analysisData was first analyzed using Winstep software (Version 3.71.0.1) for children in mainstream classes. The evaluation of the response scale showed underutilization of two response categories and therefore the scale was collapsed into three categories. Analysis of the item fitting using Rasch-scaled data to identify items infit and outfit (0.6–1.4 Logit) and normality of the distribution (−2.00 to +2.00) led to the removal of 5 items.14,15 The analysis of item fitting using the simplified version of the questionnaire among children in special education classes found that all infit and outfit values were within the acceptable range. Further evaluation of person and item separation reliability was performed for both types of classes.
ROC analysisThe receiver-operating characteristic (ROC) analysis was performed on the new scoring approaches (using 3 response categories in the simplified version of the 14-items COVD-QOL questionnaire) for both types of classes using SPSS version 15.0. The ROC curve plots sensitivity (x-axis) versus 1-specificity to present area under curve (AUC) with values between 0 and 1 (a value closer to 1 indicates better overall diagnostic ability). This analysis provides a discriminate cut-off value of those with vision disorders compared to those who do not. Therefore, it was analyzed based on the results of children who have at least one of the target conditions (reduced distance VA, accommodative response anomaly and convergence insufficiency). However, real clinical cut-off values are influenced by the prevalence of the conditions in the population.16
Predictive validity analysisThe analysis of predictive validity was performed to determine the ability of the questionnaire to accurately predict future outcome.15 A Spearman rank correlation was used where an acceptable cut-off is considered to be >0.3.15
ResultsStage I: assessment on response scale and item fittingCategory response were underutilized for two categories (“seldom” and “frequently”) and therefore merged to a category of “occasionally” based on the assumption that there was no chance of person with any symptom would have ticked “never” and also that those who always and constantly had any symptom would have ticked “frequently”. The new response scale categories improve the diagnosis. Further assessment removed 5 items based on analysis of the item fitting. Item no. 5 (Head tilt/close one eye when reading) was constantly scored as “never” and item no. 12 (Holds reading too close) was found to not comply with normality (Skewness/kurtosis: +2.00 to −2.00). Item no. 6 (Difficulty copying from chalkboard), no. 7 (Avoids near work/reading) and no. 16 (Clumsy, knocks things over) showed infit and outfit values out of the acceptable range (>1.4). The person reliability separation for mainstream and special education classes was inadequate (0.78 and 0.79, respectively) but gave acceptable values for item separation reliability (0.85 and 0.86, respectively). Minimal acceptable rating suggested that at least one (either person or item) separation was ≥0.8.15 The simplified version of the COVD-QOL questionnaire (14-items) for vision screening purpose is shown in Fig. 2.
Stage II: determine cut-off score
The overall prevalence of vision disorders among children in special education classes (88.9%) was relatively higher than children in mainstream classes (79.1%) (Table 1). The results of the ROC analysis are shown in Table 2. The AUC was acceptable (0.77) for special education classes, but lower for mainstream classes (0.63).
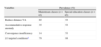
The prevalence of vision disorders among children in mainstream and special education classes in the primary schools.
| Variables | Prevalence (%) | |
| Mainstream classes (n=43) | Special education classes (n=45) | |
| Reduce distance VA | 65 | 53 |
| Accommodative response anomaly | 35 | 53 |
| Convergence insufficiency | 14 | 53 |
| ≥1 targeted conditionsa | 79 | 88 |
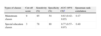
Screening outcomes of the simplified version of COVD-QOL questionnaire for different types of classes.
| Types of classes | Cut-off score | Sensitivity (%) | Specificity (%) | AUC (95% CI)a | Spearman rank correlation |
| Mainstream classes | 9 | 65 | 54 | 0.63 (0.42–0.85) | 0.17 |
| Special education classes | 3 | 78 | 80 | 0.77 (0.57–0.97) | 0.40 |
The predictive validity was evaluated using the simplified version (14-items) of the COVD-QOL questionnaire with three-response categories. The sensitivity and specificity of the questionnaire for mainstream classes was 65% and 54% with a cut-off score of 9 while for special education classes it was 78% and 80% (respectively) with a cut-off score of 3. Spearman rank correlation was acceptable for special education classes (0.40) but was low for mainstream classes (0.16).
DiscussionThe use of Rasch-scaled data improves the validity of the questionnaire. The sensitivity and specificity of the simplified version of the questionnaire with new cut-off referral was found relatively higher than previous study on socially-at risk youth population.3 Similar to the previous findings, traditional-validated questionnaire might have inappropriate response scale categories and items.7,8 The use of Likert-scoring might be difficult to discriminate by the raters due to no appropriate definition on the response categories. The frequency at which symptoms occurs are easier to classify in an extreme condition; never (no symptom at all), occasionally (sometimes have the symptom) and always (symptom persist constantly) but not in less extreme conditions.
The cut-off referral criteria could be dissimilar in different target raters and for specific target conditions. The cut-off referral criteria for children in special education classes might be lower than mainstream classes because the rating was based on their parents’ or teacher's perception. Besides, most of the items targeted visual symptoms related to academic activities; therefore it could not be easily detected by parent or teachers due to limitation in learning ability among children in special education classes. Different target condition might influence the cut-off referral criteria, as there might be discrepancies in the prevalence of different conditions.16
The results from present study imply that simplified version of the COVD-QOL questionnaire (14-items) could be a suitable tool for screening in children with learning disabilities. Currently, this group of children is recommended to undergo a comprehensive examination by the eye care professional.17 However, it might be difficult to fulfill due to limited number of eye care professionals besides poor awareness among parents or teachers. Therefore, vision disorders among children with learning disabilities might be neglected. The use of this questionnaire would facilitate referral to the eye care professional as it could be easily administered by their teachers or parents.
On the other hand, the questionnaire might not be able to discriminate those with vision disorders among children in mainstream classes for this studied population even though they reported more visual symptoms than children in special education classes. Lower score in higher grade children was explained as a result of adaptation to visual symptom which leads to change in symptom perception by age in a group of children without learning disabilities.16 However, dissimilar result between two types of classes in this study suggested that children in mainstream classes exposed to more near work as academic load was higher than children in special education classes. Therefore, they might experience more temporary visual discomfort due to educational stress and reported more visual symptoms even though it might not be the indication of visual problems. Despite lowering the cut-off referral score could increase the sensitivity, it might conversely increase the number of over referral. However, there are various alternative screening method that can be used efficiently among children in mainstream classes as they are able to accurately respond to most of vision tests.
The simplified version of COVD-QOL questionnaire (14-items) performs adequately as a vision screening tool for children in special education classes but it might not be a suitable choice for children in mainstream classes. The revised format of the COVD-QOL questionnaire will render as an appropriate, cost-effective and user-friendly tool for identifying children with learning disabilities at risk of having vision disorders among parents, teachers or primary healthcare practitioners.
Conflicts of interestThe authors have no conflicts of interest to declare.
We would like to thank the Director General of Health Malaysia for the permission to publish this paper and Research Management Institute, UniversitiTeknologi MARA (UiTM) for the Excellence Fund grant. Most sincere appreciation to Ministry of Education, Malaysia and Department of Optometry, UiTM for their contribution in this project.


