
Given the increase in demand for optometry services by society and the importance of the Optometry profession in Portugal and Spain, the objective of this study was to determine job satisfaction and important factors related to this satisfaction in a sample of Portuguese and Spanish optometrists.
MethodsA prospective, cross-sectional, and observational study was carried out from June to December 2021. An adaptation of the 15-item job satisfaction in eye-care personnel (JSEP) questionnaire validated by Paudel et al. was administered to Portuguese and Spanish optometrists. The questionnaire was shared through different social media (Facebook, LinkedIn, WhatsApp, etc.) in a Google form during the months of June to December 2021 in Portugal and Spain.
ResultsA total of 530 surveys were collected in Portugal (42.3%; n = 224) and Spain (57.7%; n = 306). The factors that most influence overall job satisfaction are salary, career development opportunities, recognition/prestige in society, good work-life balance (all p<0.001), workplace equipment and facilities, and encouragement reward positive feedback (both p = 0.002). When comparing the determinants of job satisfaction of optometrists, it was found that Portuguese professionals were generally more satisfied than Spanish ones (p<0.001). However, Spanish optometrists reported feeling more supported by their colleagues (p<0.001).
ConclusionThis study has shown that the level of job satisfaction was higher in Portugal than in Spain. The most important factors influencing job satisfaction were salary, job stability, and support from colleagues.
Job satisfaction is defined as the feelings or emotions that connect workers to their jobs.1 Thus, it is known as “the positive emotional state resulting from the evaluation of one´s work or work experiences.”2 or “the extent to which people like or dislike their job.”3 That is, the attitude of workers towards their work in general, or more specifically, towards their colleagues, payroll, or working conditions. An employee may experience different job satisfaction through job stability, professional development, and growth, as well as a balanced work-life situation. Conversely, job stress can lead to burnout by decreasing people´s abilities to meet the demands of the job. In other words, an adequate workload can improve workers’ skills and enhance their success at work.4
Job satisfaction is considered a protective factor against burnout and the negative consequences of work-related stress.5 In healthcare professionals, job satisfaction is vital, as burnout can directly affect the health of patients and the quality of health care.6 Thus, job satisfaction is comprised of working conditions, communication, nature of work, organizational policies and procedures, salary and conditions, opportunities for promotion (also progression, recognition, or appreciation), safety, and supervision or relationships.7 Job satisfaction is also influenced by various factors, such as working conditions and organizational environment, stress levels, role conflict and ambiguity, role perceptions and content, and organizational and professional commitment.7–10
In Portugal and Spain, optometrists carry out most of their work in optical healthcare establishments. Portugal has 0.80 primary eye care centers per 5000 population whilst Spain has 1.04 primary eye care centers per 5000 population.11 The degree in Optics and Optometry is one of the degrees with the lowest unemployment in Portugal and Spain.12,13
The first studies published about activities, roles, and attitudes of optometrists were done in the USA, through a survey of active-duty military optometrists in 1987 and 1988.14,15 Both studies found that optometrists felt that they have not received proper promotional attention or career opportunities.
Knowing the main factors that cause dissatisfaction among optometrists will help companies to make plans to retain talent and reduce staff turnover. This study aimed to determine job satisfaction and important factors in a sample of Portuguese and Spanish optometrists.
MethodologyThis research followed the principles of the Declaration of Helsinki and it was approved by the Ethics Committee of the Superior Institute of Education and Sciences (ISEC Lisbon) on December 2021 under code CPISEC/PID/001/2021.
A prospective, cross-sectional, and observational study was conducted. For data collection, an adaptation of the questionnaire validated by Paudel et al.16 was used (appendix). This questionnaire consisted of open and closed questions. The questionnaire had two sections: part A and part B.
Part A was comprised of 7 items on the socio-demographic characteristics of the participants —age, gender, highest educational level, work experience, place of work, sector, and reasons to choose the profession—.
Part B was comprised of 14 items, which elicit information on factors responsible for participants’ level of satisfaction with their current job —salary, non-financial incentives, job stability, workplace equipment and facilities, encouragement, reward, and positive feedback from the institution, professional recognition or prestige, recognition by co-workers, level of job responsibility, variety of tasks, workload, support from co-workers, lifelong learning, career development opportunities, and work-life balance. Furthermore, it has also been asked about overall job satisfaction.
A five-point Likert scale was used to evaluate the elements of section B: 1-very dissatisfied, 2-dissatisfied, 3- neither satisfied nor dissatisfied, 4- satisfied, and 5- very satisfied. 16 The questionnaire was shared through different social media (Facebook, LinkedIn, WhatsApp, etc.) using the Google Forms tool that was opened from the 1st of June to the 31st of December 2021 in Portugal and Spain. To avoid multiple answers, each responder should be registered with a Gmail account and only one submission from each email address was permitted by the survey tool.
Statistical analyses were performed using SPSS 27.0 software (SPSS Inc., Chicago, Illinois). - Normality of data was tested using the Kolmogorov-Smirnov test, with a significance level equal to 0.05. Quantitative variables were described by the average ± standard deviation (SD), or median and interquartile range [IQR].
To compare the “Portugal” and “Spain” study cohorts, the chi-square test has been used to find significant differences in the percentage of responses using the Linkert scale. To analyze the quantitative variables, the Likert scale has been assessed as ordinal numerical answers between 1 (very dissatisfied) to 5 (very satisfied). The Mann-Whitney or Kruskal Wallis test has been used to make the comparison and the difference of the score obtained in each analyzed factor depending on the country. To analyze the factors that influence both positive and negative general satisfaction, multiple linear regression has been used. In the multivariate analysis, the factors associated with overall satisfaction were analyzed, including age, sex, salary, non-financial incentives, job stability, workplace equipment/ facilities, encouragement/reward/positive feedback, professional recognition or prestige, level of responsibility, variety of tasks, workload, support from colleagues, lifelong training, career development opportunities, recognition/prestige in society and good work-life balance as dependent variables.
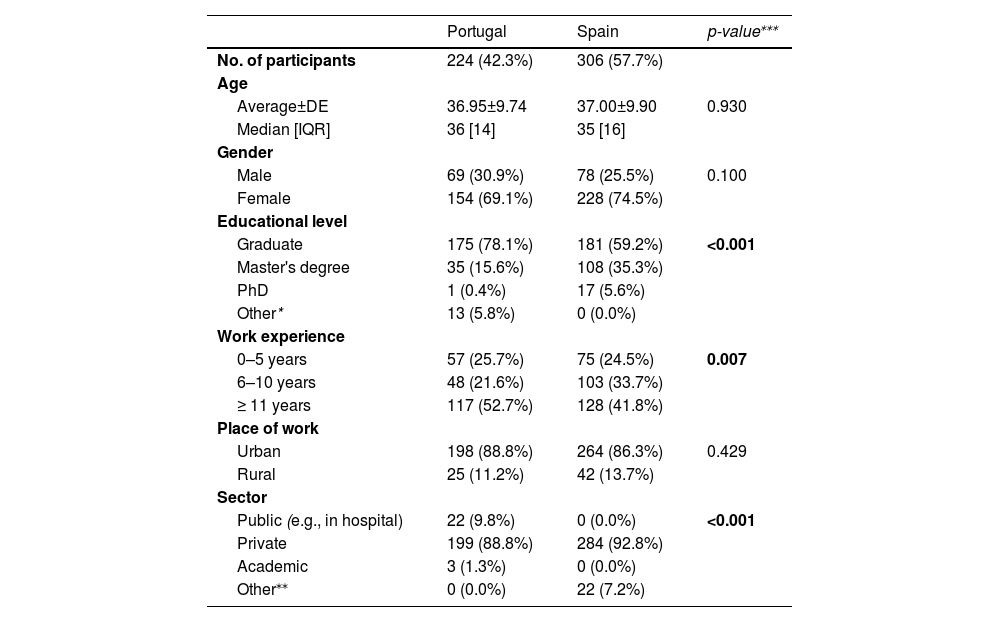
ResultsSocio-demographic characteristicsA total of 530 surveys were collected across Portugal (42.3%; n = 224; 11.9% of the registered optometrist) and Spain (57.7%; n = 306; 1.63% of the registered optometrist). The average age of the participants was 37.0 ± 9.8 years (median 35 years, IQR 15 years). With regards to the gender of the responders, 382 (72.2%) were female and 147 (27.8%) were male. Most responders were from urban (87.3%; n = 462) areas than rural (12.7%; n = 67).
All participants were optometrists, having just a degree in Optometry the 67.2% (n = 356) of the responders, while the 27.0% (n = 143) had also an additional master´s degree and 3.4% (n = 18) had even completed a PhD. Most responders had 11 years of work experience (50.7%; n = 305), 22.9% (n = 138) between 0 and 5 years, and 26.4% (n = 159) between 6 and 10 years.
Table 1 shows the socio-demographic profile of the sample analyzed.
Demographic data of the study population.
| Portugal | Spain | p-value⁎⁎⁎ | |
|---|---|---|---|
| No. of participants | 224 (42.3%) | 306 (57.7%) | |
| Age | |||
| Average±DE | 36.95±9.74 | 37.00±9.90 | 0.930 |
| Median [IQR] | 36 [14] | 35 [16] | |
| Gender | |||
| Male | 69 (30.9%) | 78 (25.5%) | 0.100 |
| Female | 154 (69.1%) | 228 (74.5%) | |
| Educational level | |||
| Graduate | 175 (78.1%) | 181 (59.2%) | <0.001 |
| Master's degree | 35 (15.6%) | 108 (35.3%) | |
| PhD | 1 (0.4%) | 17 (5.6%) | |
| Other* | 13 (5.8%) | 0 (0.0%) | |
| Work experience | |||
| 0–5 years | 57 (25.7%) | 75 (24.5%) | 0.007 |
| 6–10 years | 48 (21.6%) | 103 (33.7%) | |
| ≥ 11 years | 117 (52.7%) | 128 (41.8%) | |
| Place of work | |||
| Urban | 198 (88.8%) | 264 (86.3%) | 0.429 |
| Rural | 25 (11.2%) | 42 (13.7%) | |
| Sector | |||
| Public (e.g., in hospital) | 22 (9.8%) | 0 (0.0%) | <0.001 |
| Private | 199 (88.8%) | 284 (92.8%) | |
| Academic | 3 (1.3%) | 0 (0.0%) | |
| Other⁎⁎ | 0 (0.0%) | 22 (7.2%) |
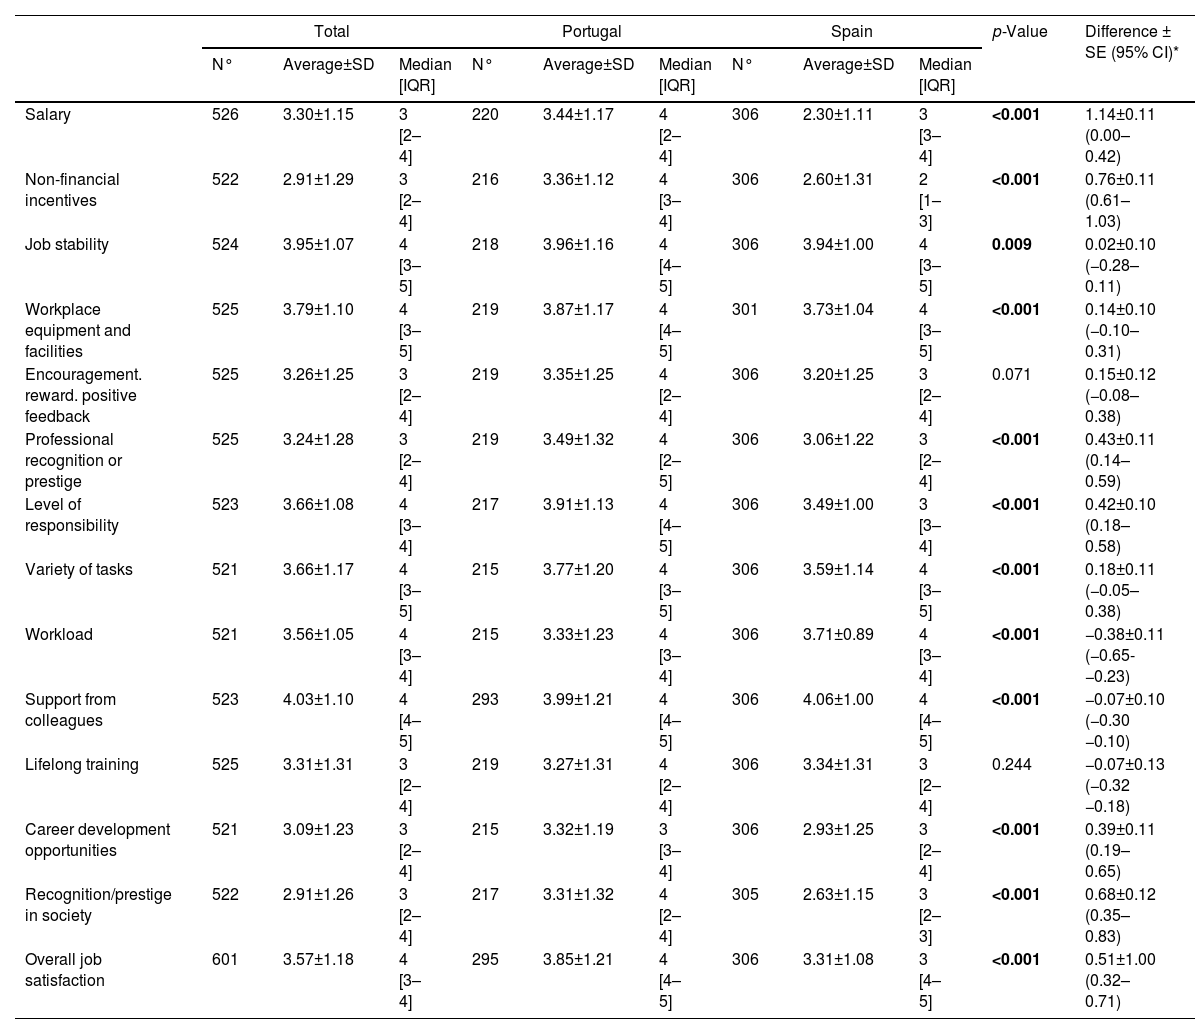
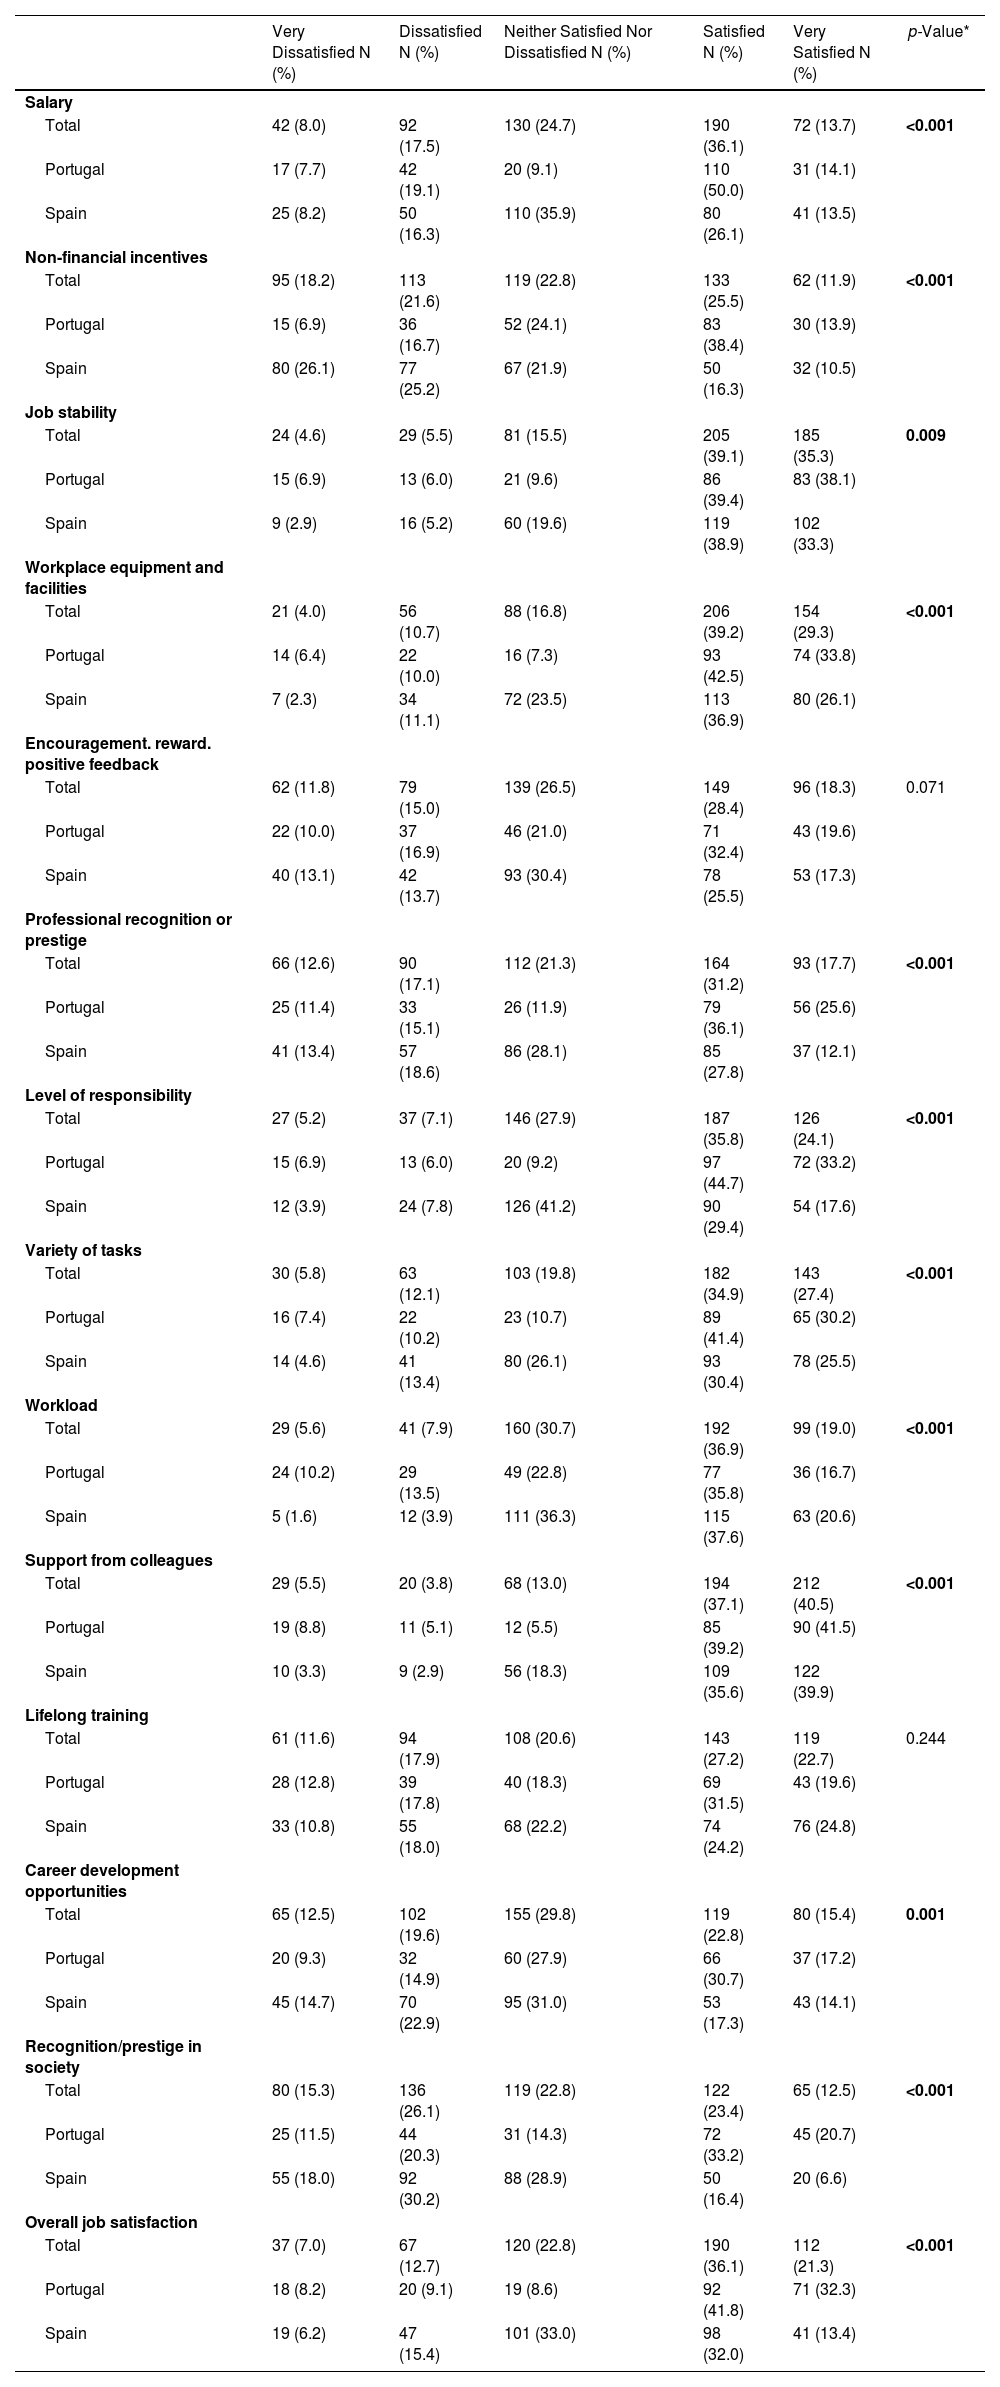
Overall, in the pooled sample, optometrists showed good overall job satisfaction (median [IQR]: 4 [3–4]) (Table 2). Table 2 shows the scores obtained for different factors associated with the satisfaction of optometrists according to country. Table 3 shows the percentage of satisfaction with the different items and overall satisfaction with their jobs from Portuguese and Spanish Optometrists.
Comparison of the determinants of job satisfaction among Portuguese and Spanish optometrists.
| Total | Portugal | Spain | p-Value | Difference ± SE (95% CI)* | |||||||
|---|---|---|---|---|---|---|---|---|---|---|---|
| N° | Average±SD | Median [IQR] | N° | Average±SD | Median [IQR] | N° | Average±SD | Median [IQR] | |||
| Salary | 526 | 3.30±1.15 | 3 [2–4] | 220 | 3.44±1.17 | 4 [2–4] | 306 | 2.30±1.11 | 3 [3–4] | <0.001 | 1.14±0.11 (0.00–0.42) |
| Non-financial incentives | 522 | 2.91±1.29 | 3 [2–4] | 216 | 3.36±1.12 | 4 [3–4] | 306 | 2.60±1.31 | 2 [1–3] | <0.001 | 0.76±0.11 (0.61–1.03) |
| Job stability | 524 | 3.95±1.07 | 4 [3–5] | 218 | 3.96±1.16 | 4 [4–5] | 306 | 3.94±1.00 | 4 [3–5] | 0.009 | 0.02±0.10 (−0.28–0.11) |
| Workplace equipment and facilities | 525 | 3.79±1.10 | 4 [3–5] | 219 | 3.87±1.17 | 4 [4–5] | 301 | 3.73±1.04 | 4 [3–5] | <0.001 | 0.14±0.10 (−0.10–0.31) |
| Encouragement. reward. positive feedback | 525 | 3.26±1.25 | 3 [2–4] | 219 | 3.35±1.25 | 4 [2–4] | 306 | 3.20±1.25 | 3 [2–4] | 0.071 | 0.15±0.12 (−0.08–0.38) |
| Professional recognition or prestige | 525 | 3.24±1.28 | 3 [2–4] | 219 | 3.49±1.32 | 4 [2–5] | 306 | 3.06±1.22 | 3 [2–4] | <0.001 | 0.43±0.11 (0.14–0.59) |
| Level of responsibility | 523 | 3.66±1.08 | 4 [3–4] | 217 | 3.91±1.13 | 4 [4–5] | 306 | 3.49±1.00 | 3 [3–4] | <0.001 | 0.42±0.10 (0.18–0.58) |
| Variety of tasks | 521 | 3.66±1.17 | 4 [3–5] | 215 | 3.77±1.20 | 4 [3–5] | 306 | 3.59±1.14 | 4 [3–5] | <0.001 | 0.18±0.11 (−0.05–0.38) |
| Workload | 521 | 3.56±1.05 | 4 [3–4] | 215 | 3.33±1.23 | 4 [3–4] | 306 | 3.71±0.89 | 4 [3–4] | <0.001 | −0.38±0.11 (−0.65- −0.23) |
| Support from colleagues | 523 | 4.03±1.10 | 4 [4–5] | 293 | 3.99±1.21 | 4 [4–5] | 306 | 4.06±1.00 | 4 [4–5] | <0.001 | −0.07±0.10 (−0.30 −0.10) |
| Lifelong training | 525 | 3.31±1.31 | 3 [2–4] | 219 | 3.27±1.31 | 4 [2–4] | 306 | 3.34±1.31 | 3 [2–4] | 0.244 | −0.07±0.13 (−0.32 −0.18) |
| Career development opportunities | 521 | 3.09±1.23 | 3 [2–4] | 215 | 3.32±1.19 | 3 [3–4] | 306 | 2.93±1.25 | 3 [2–4] | <0.001 | 0.39±0.11 (0.19–0.65) |
| Recognition/prestige in society | 522 | 2.91±1.26 | 3 [2–4] | 217 | 3.31±1.32 | 4 [2–4] | 305 | 2.63±1.15 | 3 [2–3] | <0.001 | 0.68±0.12 (0.35–0.83) |
| Overall job satisfaction | 601 | 3.57±1.18 | 4 [3–4] | 295 | 3.85±1.21 | 4 [4–5] | 306 | 3.31±1.08 | 3 [4–5] | <0.001 | 0.51±1.00 (0.32–0.71) |
Satisfaction levels: 1-very dissatisfied. 2-dissatisfied. 3- neither satisfied nor dissatisfied. 4- satisfied. and 5- very satisfied.
Optometrists' job satisfaction.
| Very Dissatisfied N (%) | Dissatisfied N (%) | Neither Satisfied Nor Dissatisfied N (%) | Satisfied N (%) | Very Satisfied N (%) | p-Value* | |
|---|---|---|---|---|---|---|
| Salary | ||||||
| Total | 42 (8.0) | 92 (17.5) | 130 (24.7) | 190 (36.1) | 72 (13.7) | <0.001 |
| Portugal | 17 (7.7) | 42 (19.1) | 20 (9.1) | 110 (50.0) | 31 (14.1) | |
| Spain | 25 (8.2) | 50 (16.3) | 110 (35.9) | 80 (26.1) | 41 (13.5) | |
| Non-financial incentives | ||||||
| Total | 95 (18.2) | 113 (21.6) | 119 (22.8) | 133 (25.5) | 62 (11.9) | <0.001 |
| Portugal | 15 (6.9) | 36 (16.7) | 52 (24.1) | 83 (38.4) | 30 (13.9) | |
| Spain | 80 (26.1) | 77 (25.2) | 67 (21.9) | 50 (16.3) | 32 (10.5) | |
| Job stability | ||||||
| Total | 24 (4.6) | 29 (5.5) | 81 (15.5) | 205 (39.1) | 185 (35.3) | 0.009 |
| Portugal | 15 (6.9) | 13 (6.0) | 21 (9.6) | 86 (39.4) | 83 (38.1) | |
| Spain | 9 (2.9) | 16 (5.2) | 60 (19.6) | 119 (38.9) | 102 (33.3) | |
| Workplace equipment and facilities | ||||||
| Total | 21 (4.0) | 56 (10.7) | 88 (16.8) | 206 (39.2) | 154 (29.3) | <0.001 |
| Portugal | 14 (6.4) | 22 (10.0) | 16 (7.3) | 93 (42.5) | 74 (33.8) | |
| Spain | 7 (2.3) | 34 (11.1) | 72 (23.5) | 113 (36.9) | 80 (26.1) | |
| Encouragement. reward. positive feedback | ||||||
| Total | 62 (11.8) | 79 (15.0) | 139 (26.5) | 149 (28.4) | 96 (18.3) | 0.071 |
| Portugal | 22 (10.0) | 37 (16.9) | 46 (21.0) | 71 (32.4) | 43 (19.6) | |
| Spain | 40 (13.1) | 42 (13.7) | 93 (30.4) | 78 (25.5) | 53 (17.3) | |
| Professional recognition or prestige | ||||||
| Total | 66 (12.6) | 90 (17.1) | 112 (21.3) | 164 (31.2) | 93 (17.7) | <0.001 |
| Portugal | 25 (11.4) | 33 (15.1) | 26 (11.9) | 79 (36.1) | 56 (25.6) | |
| Spain | 41 (13.4) | 57 (18.6) | 86 (28.1) | 85 (27.8) | 37 (12.1) | |
| Level of responsibility | ||||||
| Total | 27 (5.2) | 37 (7.1) | 146 (27.9) | 187 (35.8) | 126 (24.1) | <0.001 |
| Portugal | 15 (6.9) | 13 (6.0) | 20 (9.2) | 97 (44.7) | 72 (33.2) | |
| Spain | 12 (3.9) | 24 (7.8) | 126 (41.2) | 90 (29.4) | 54 (17.6) | |
| Variety of tasks | ||||||
| Total | 30 (5.8) | 63 (12.1) | 103 (19.8) | 182 (34.9) | 143 (27.4) | <0.001 |
| Portugal | 16 (7.4) | 22 (10.2) | 23 (10.7) | 89 (41.4) | 65 (30.2) | |
| Spain | 14 (4.6) | 41 (13.4) | 80 (26.1) | 93 (30.4) | 78 (25.5) | |
| Workload | ||||||
| Total | 29 (5.6) | 41 (7.9) | 160 (30.7) | 192 (36.9) | 99 (19.0) | <0.001 |
| Portugal | 24 (10.2) | 29 (13.5) | 49 (22.8) | 77 (35.8) | 36 (16.7) | |
| Spain | 5 (1.6) | 12 (3.9) | 111 (36.3) | 115 (37.6) | 63 (20.6) | |
| Support from colleagues | ||||||
| Total | 29 (5.5) | 20 (3.8) | 68 (13.0) | 194 (37.1) | 212 (40.5) | <0.001 |
| Portugal | 19 (8.8) | 11 (5.1) | 12 (5.5) | 85 (39.2) | 90 (41.5) | |
| Spain | 10 (3.3) | 9 (2.9) | 56 (18.3) | 109 (35.6) | 122 (39.9) | |
| Lifelong training | ||||||
| Total | 61 (11.6) | 94 (17.9) | 108 (20.6) | 143 (27.2) | 119 (22.7) | 0.244 |
| Portugal | 28 (12.8) | 39 (17.8) | 40 (18.3) | 69 (31.5) | 43 (19.6) | |
| Spain | 33 (10.8) | 55 (18.0) | 68 (22.2) | 74 (24.2) | 76 (24.8) | |
| Career development opportunities | ||||||
| Total | 65 (12.5) | 102 (19.6) | 155 (29.8) | 119 (22.8) | 80 (15.4) | 0.001 |
| Portugal | 20 (9.3) | 32 (14.9) | 60 (27.9) | 66 (30.7) | 37 (17.2) | |
| Spain | 45 (14.7) | 70 (22.9) | 95 (31.0) | 53 (17.3) | 43 (14.1) | |
| Recognition/prestige in society | ||||||
| Total | 80 (15.3) | 136 (26.1) | 119 (22.8) | 122 (23.4) | 65 (12.5) | <0.001 |
| Portugal | 25 (11.5) | 44 (20.3) | 31 (14.3) | 72 (33.2) | 45 (20.7) | |
| Spain | 55 (18.0) | 92 (30.2) | 88 (28.9) | 50 (16.4) | 20 (6.6) | |
| Overall job satisfaction | ||||||
| Total | 37 (7.0) | 67 (12.7) | 120 (22.8) | 190 (36.1) | 112 (21.3) | <0.001 |
| Portugal | 18 (8.2) | 20 (9.1) | 19 (8.6) | 92 (41.8) | 71 (32.3) | |
| Spain | 19 (6.2) | 47 (15.4) | 101 (33.0) | 98 (32.0) | 41 (13.4) |
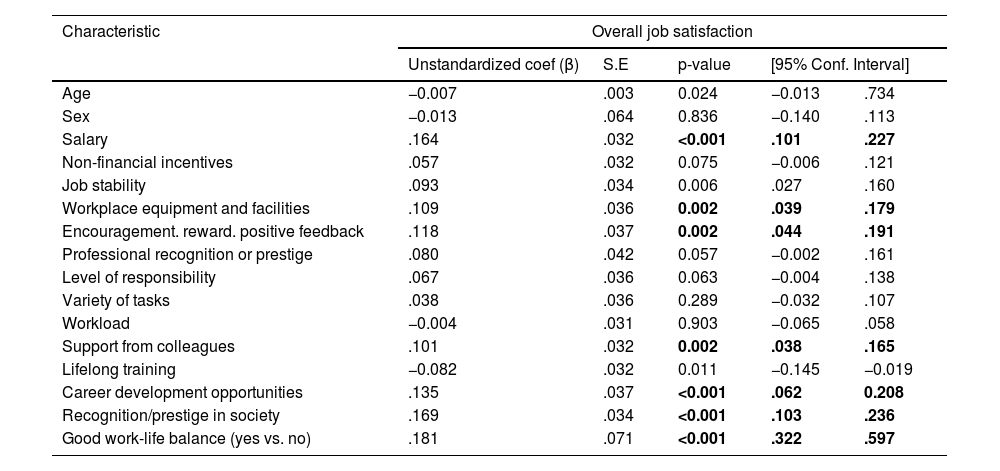
Table 4 shows the results of the multivariate linear regression analysis to evaluate the influence of the different factors on overall job satisfaction. It has been found that the higher the salary, the workplace equipment and facilities, encouragement, reward, positive feedback, support from colleagues, career development opportunities, recognition/prestige in society, and good work-life balance, the greater the overall satisfaction. This analysis shows that the factors with more influence on the job satisfaction of optometrists in both countries are salary, workplace equipment and facilities, encouragement/reward/positive feedback, support from colleagues, career development opportunities, recognition/prestige in society, and good work-life balance.
Linear regression analyses of factors associated with overall job satisfaction.
Satisfaction was greater in Portugal (median [IQR]: 4 [3–5]) than in Spain (median [IQR]: 3 [2–5]); (P<0.001). With regards to education level, professionals who had completed a Ph.D. were more satisfied in Spain, whilst satisfaction was the same across education levels in Portugal (P<0.001).
Regarding the length of professional experience, significant differences were also found in the degree of job satisfaction depending on the country (P = 0.020). In Spain, the most satisfied professionals were those with 11 years of experience (median [IQR]:4 [3–4]) and in Portugal, the degree of satisfaction was the same, regardless of the years of experience (median [IQR]: 4 [3.75–5]). The degree of job satisfaction according to job performance was also significantly different in each country (P<0.001). Therefore, in Portugal (median [IQR]: 5 [2.5–5]) and Spain professionals (median [IQR]: 4 [3–4]), the most satisfied were self-employed professionals, that is, optometrists with their own opticians.
On the other hand, there were significant differences in the good work-life balance depending on the country (P<0.001) where Portuguese professionals (n = 192; 86.1%) reported a better balance than Spanish ones (n = 181; 59.2%).
DiscussionThis study is the first that assesses and compares the job satisfaction rate of optometrists in Portugal and Spain. Because high job satisfaction is of great importance to avoid emotional disengagement, apathy, and decreased quality of services, which result in poorer patient care that could have serious consequences.17,18
There are many studies about the job satisfaction of different healthcare professionals and the results depend on the profession studied but also on the country.19-23 One of the few studies that compare different health professionals showed that the job satisfaction of nurses, physiotherapists, occupational therapists, medical laboratory technologists, dieticians, medical imaging practitioners, environmental health officers, and optometrists in private settings in Malaysia differed, especially in promotion, supervision, operating conditions, co-workers, the nature of the work, and communication.24 This agrees with what was found in our study. One of the factors that influence the general satisfaction of optometrists in Portugal and Spain is the relationship between colleagues and positive feedback.
Regarding optometrists, Bentley et al.25 found a high prevalence of mental health conditions and burnout among practicing optometrists in Australia compared with the general population and other health professionals, highlighting that younger age and burnout were significant risk factors for psychological distress and the most frequently mentioned work-related issues concerned retail pressures, workload, and career dissatisfaction. Using the same validated questionnaire16 optometrists in Ghana26 showed more job satisfaction than those surveyed in Portugal and Spain. Our results agree with factors associated with overall job satisfaction found by Akuffo et al.26 highlighting the importance of good work-life balance and salary. Optometrists have been shown to try to set limits over time to prevent work-related stress and ill health. In this way, they identify strategies to manage stress and create and maintain a sense of coherence.27
Work-life balance influences overall job satisfaction. Thus, the balance between work and personal life is negatively related to perceived stress, general anxiety, and depressive symptoms. That is, it is an indicator of the health of people and organizations.28-30
Portuguese optometrists were more satisfied with their work equipment and work material than Spanish optometrists.
The results found in this study show the importance of a good salary, facilities, relationships between colleagues, family balance, professional recognition, positive feedback, and development opportunities. These results will allow future studies to focus on analyzing how to improve these factors so that satisfaction in Spain is similar to that of Portugal, and to analyze the causes for which Portuguese optometrists have higher satisfaction. In addition, these results will help to make the comparison in other healthcare professions.
One of the limitations of this study was that the rate of response was low. This low response rate is similar to similar survey reports in optometry practice in Portugal and Spain lower than 5% of registered practitioners, so the results of this study must be used with caution.31-39
To summarize, among the main factors that influence job satisfaction in Portugal and Spain, satisfaction with salary, career development opportunities, and prestige in society are low in Spain. It would be interesting for companies to take action to increase those factors to retain talent and improve patient care through job satisfaction.
ConclusionThis study has shown that the level of job satisfaction of the surveyed health professionals satisfied or very satisfied was higher in Portugal (74.1%) than in Spain (45.4%). The most valuable factors were support from colleagues, job stability, and workplace equipment and facilities; while the least valued factors were recognition/prestige in society, non-financial incentives, and career development opportunities.
The Grupo de Investigação Optovisão ISEC Lisboa is made up of the following members: Martina Micaela de Sousa Nobre Antunes; Ana Catarina Imaginário Conceição; Joana Carolina Costa Frederico; Carlos Jorge Nunes Cruz Tavares; Hugo Miguel Valverde Martins Vieira; Jenifer Verissimo Baleia; António José Fernandes das Neves dos Santos; Edna Bandeira Cunha dos Santos; João Pedro Valentim Correia and Renato Luis Rosario Baltazar.


