


The aim of this study is to provide an update on the intraocular pressure measurements in Iberian Peninsula in order to elucidate their relationships with other clinical factors.
MethodsA multicentric cross-sectional prospective study was carried out on patients attending General Optica centres in Spain and Portugal in collaboration with the University of Valladolid. This study included healthy patients with 18 years and older. Intraocular pressure measurements were taken with different air tonometers for one week. A descriptive statistical analysis of the collected data was then performed to discover possible correlations with intraocular pressure.
ResultsStatistically significant differences in the intraocular pressure of the right eye and left eye between patients under 35 years of age and those over 64 years of age were found. An increase in intraocular pressure was also observed in the group with a family history of glaucoma (p < 0.01) and aged over 45 years. Furthermore, intraocular pressure was significantly higher in patients with high blood pressure in the 45–65 age range. The standardised coefficients of variation showed that the variables most strongly related to intraocular pressure were time, followed by a family history of glaucoma and high blood pressure. The variables that had a statistically significant correlation with the intraocular pressure value were the time of measurement and a history of glaucoma.
ConclusionIntraocular pressure increases with age, and among the variables studied, high blood pressure and family history of glaucoma were the most important risk factors.
Intraocular pressure (IOP) is associated with glaucoma as its main risk factor for damage to the optic nerve, which results in the loss of retinal ganglion cells.1 Glaucoma is a group of progressive optic neuropathies characterised by degeneration of retinal ganglion cells and retinal nerve fibre layers that results in changes in the optical nerve head. An estimated 57.5 million people worldwide are affected by primary open-angle glaucoma (POAG), with a global prevalence of 2.2 %. In Europe, 7.8 million people are affected by POAG, and the total prevalence is 2.51 %.2,3 Glaucoma is the second leading cause of irreversible blindness worldwide, with an estimated global prevalence of 3.5 % in people aged 40–80 years, and it is associated with a reduced quality of life.1 Risk factors include age, sex, myopia, genetics, family history, smoking, race, systemic hypotension and hypertension, diabetes, vasospasm, the use of systemic or topical steroids, migraine, obstructive sleep apnoea syndrome, temperature and, most significantly, increased IOP.1,4
Currently, studies in this field focus on the strong relationship between systemic vascular diseases and ocular findings in patients with glaucomatous optic neuropathy, which are associated mainly with normotensive glaucoma.4 Recently, a strong genetic correlation has been found between genomic regions that imply a risk factor for the development of POAG, as some genes influence the increase in IOP, so family history may be important to consider, and a high risk of glaucoma prediction is now possible in an individual.5
Even so, IOP remains fundamental in the detection and management of POAG. In addition to all of the above factors, IOP is affected by the circadian rhythm, so there is variability in this parameter throughout the day, with this variability being greater in glaucoma patients.6 In healthy eyes, the IOP usually varies between 2 and 4 mm Hg over a 24 h period and this variation can reach 5 mm Hg in young adults. Any greater variation may be related to the onset or recurrence of glaucoma.7–9 Furthermore, the maximum value of IOP occurs at night when it is very difficult to record. For this reason, it is complicated but very necessary to carry out epidemiological studies so much so that other studies have focused on the comparison of IOP between studies in different areas of the world, potentially reflecting differences in lifestyle, diet, and latitude, which may have an indirect relationship with the risk of POAG.3,10
Some epidemiological studies on IOP have been performed in Europe, but in some cases, the sample size or geographical area limited the outcomes. A large study examining IOP in >40,000 participants from six European countries in 2016 confirmed previously reported relationships between IOP and body mass index (BMI), systolic blood pressure (SBP), refractive error and previous cataract surgery.3 In this study, IOP data were collected in different geographical areas in Spain and Portugal, taking refractive error, age, sex, high blood pressure (HBP), diabetes and POAG history into account, to elucidate their relationships with IOP and to provide an update on IOP measurements in the Iberian Peninsula population classified by age groups.1,11,12
MethodsStudy designA multicentric cross-sectional prospective study was carried out on patients attending General Optica (a total of 91 centres in Spain and Portugal) in collaboration with the University of Valladolid. This study included adult patients over the age of 18. All patients who had systemic (except diabetes and hypertension for their relationship with glaucoma) or eye pathology (detailing the history of glaucoma), ocular surgery or vision impairment were excluded. This study was approved by the Human Science Ethics Committee (PI 22–2636) of the Valladolid East Area (Hospital Clinic, Castilla y Leon Public Health System-SACYL). All patients were treated in compliance with the Declaration of Helsinki and the European Normative for Data Protection (2016/679 Regulation of the European Parliament and the Council of 27th of April 2016, General Data Protection Regulation).
MaterialsIOP measurements were performed with an air tonometer because noninvasive IOP measurements have shown good agreement with Goldmann applanation tonometry (the gold standard) in IOP values for healthy eyes.2,13 Five different models of air tonometers were used: CT-80 (TopCon, Japan), CT-800 (TopCon, Japan), NCT-200 (Shin nippon, Japan), NT-510 (Nidek, Italy), and NT-530 (Nidek, Italy). The protocol followed in all cases was that specified by the manufacturer. Three measurements per eye were taken in automatic mode, and the means were recorded with respect to the time of measurement.
ProcedureAll participants received information related to the study, and informed consent was obtained prior to any clinical procedure. A complete clinical history was obtained to ensure that patients met the inclusion criteria. Clinical data, such as age, sex, refractive error, and a history of diabetes and HBP, were collected, as were ocular pathology data. Patients underwent three IOP measurements at a single visit, according to the manufacturer's specifications of the tonometer used. Measurements were carried out between 10 a.m. and 10 pm. on 7 consecutive days.
Data analysisA descriptive statistical analysis was performed on the IOP data obtained according to age, sex, systemic history such as diabetes or glaucoma, HBP, refractive error, and country.
The sample was tested for normality with the Kolmogorov‒Smirnov test, and comparisons were made in each group between IOP and risk factors with the Mann‒Whitney U test. A p < 0.05 was considered to indicate statistical significance. To examine the associations between IOP and the variables of interest, linear regression was used. A linear multivariable model included all of the main variables of interest (age, sex, refractive error, HBP or history of diabetes) versus IOP. A logistic regression model was performed with the same variables and was based on Wald's criterion to determine the associations of the studied variables with intraocular pressure by means of correlation coefficients and odds ratios.
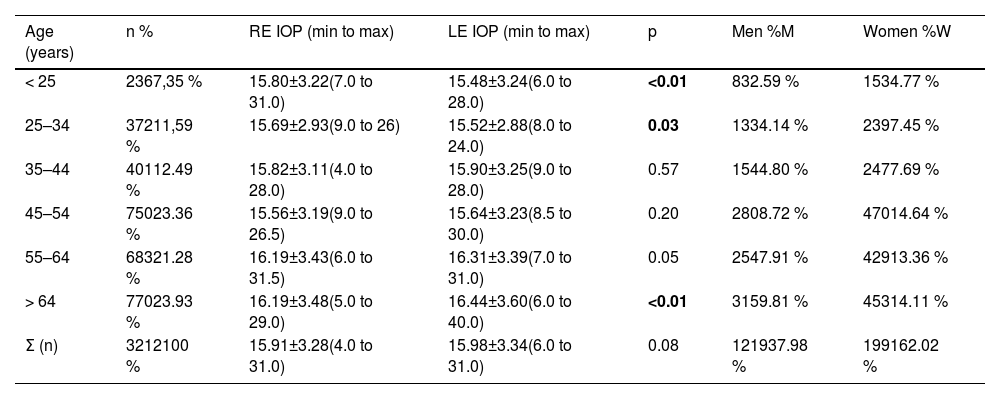
ResultsIOP was measured in 3216 patients, and 3210 RE and 3212 LE IOPs were successfully obtained, with an average of 15.91±3.28 mm Hg for the RE and an average of 15.98±3.34 mm Hg for the LE. In this sample, 1223 patients (38.1 %) were male, and 1993 (61.9 %) were female. No statistically significant differences by sex were found in the IOP values (p > 0.15), as shown in Table 1 of the supplementary material.
Mean, standard deviation and ranges of IOP of patients classified by age group in relation to eye and sex.
n: sample size; RE IOP: right eye intraocular pressure (mean ± standard deviation and range in mmHg). LE IOP: left eye intraocular pressure (mean ± standard deviation and range in mmHg); p: probability; M: men; W: women.
First of all, the differences between the different tonometers were analysed considering the age of the different groups as shows in Table 5 of the supplementary material. No statistically significant differences in measured intraocular pressure and age were found between NT-510 and NT-530 (p > 0.15) and between NT-510 and NTC-200 (p > 0.20). However, NT-510 shows statistically significant differences (p < 0.03) with CT-80 and CT-800 without differences in terms of age (p > 0.13). In the case of NT-530, no statistically significant differences in intraocular pressure and age were found with NTC-200 (p > 0.11) and CT-80 (p > 0.05). Nevertheless, this tonometer (NT-530) showed statistically significant differences with CT-800 (p < 0.04) in intraocular pressure and age. NTC-200 showed statistically significant differences (p < 0.01) compared to CT-80 and CT-800 but there were also statistically significant differences in the age of the groups compared. Finally, between CT-80 and CT-800 there were statistically significant differences (p < 0.01) in the measured intraocular pressure value but not in the age (p = 0.71) of the groups compared.
Table 1 shows the IOP data by age group, with statistically significant differences by age group (p < 0.01) in both eyes. Statistically significant differences were found between the RE and LE in those under 35 years of age and over 64 years of age. For the left eye, there were differences in IOP values between patients younger than 25 years and those aged 55 to 64 years (p < 0.01) and those older than 64 years (p < 0.01); between patients aged 25 to 34 years and those aged 55 to 64 years (p < 0.01) and those older than 64 years (p < 0.01); and between patients aged 35 to 44 years and those older than 64 years (p = 0.02). Significant differences in the IOP in both eyes were found between the 45–54 and 55–64 year age groups (p < 0.01) and the 64+-year age group (p < 0.01).
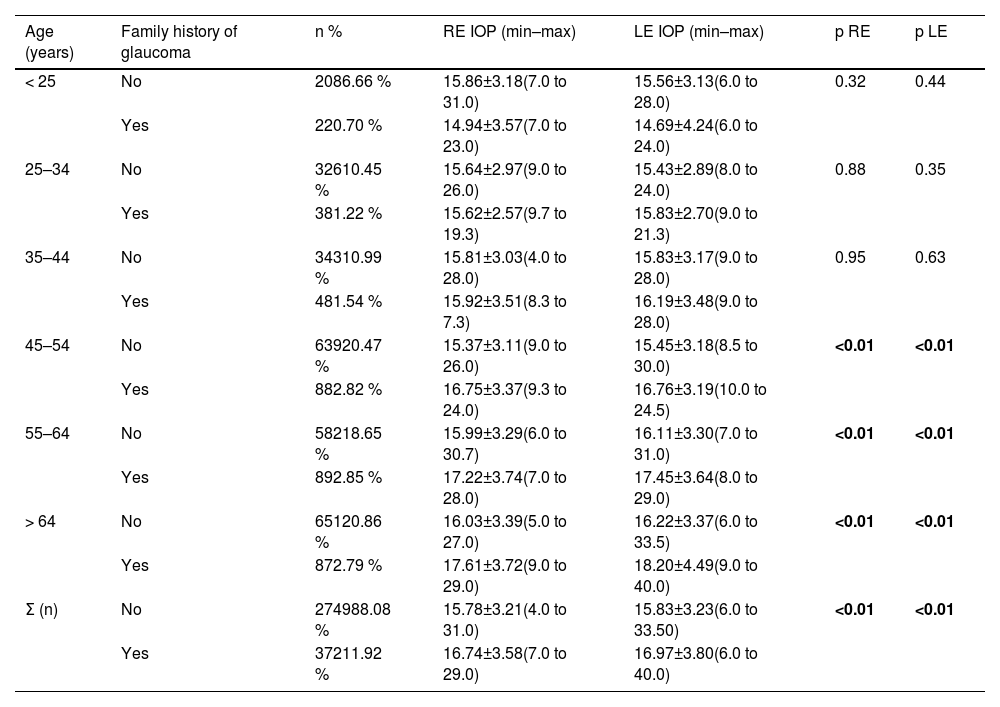
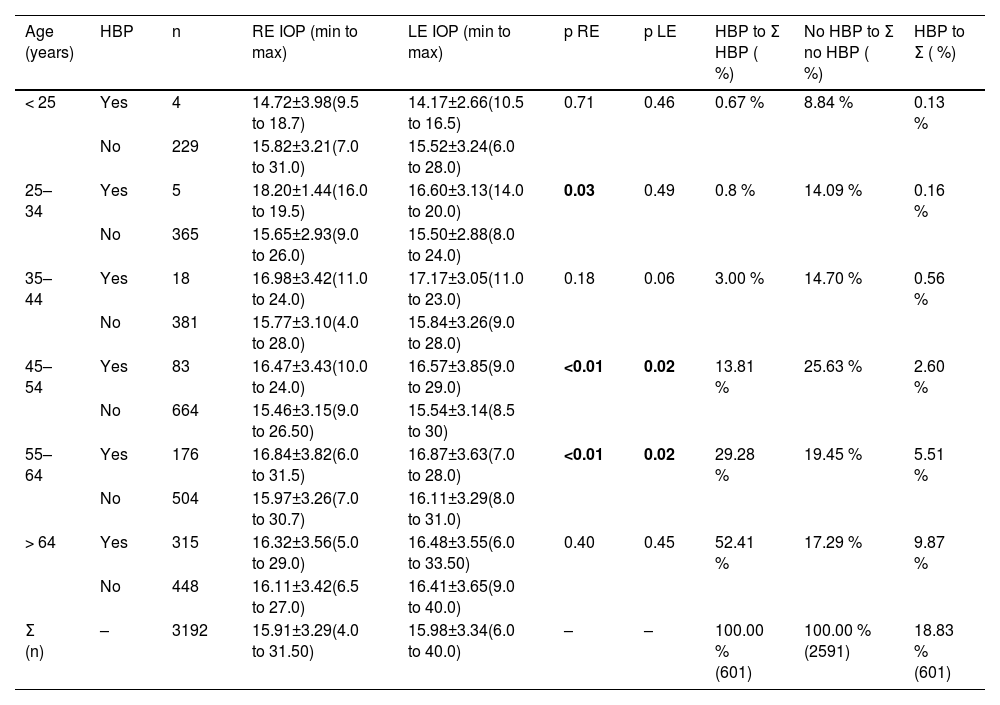
Table 2 shows the data for patients who had a history of glaucoma and those who did not. An increase in RE IOP and LE IOP was observed in the group with a history of glaucoma compared with the group without a history of glaucoma (p < 0.01) in those over 45 years. In addition, IOP was compared by age range between patients with and without HBP (Table 3), which revealed that, in the 45 to 64 age group, patients with HBP had higher IOP, and this difference was statistically significant (p ≤ 0.02). This age group accounted for 43.09 % of the patients with HBP.
Mean, standard deviation and range of IOP values by age and history of glaucoma. A total of 3121 of the initial 3212 patients were aware of their family history of glaucoma.
n: sample size; RE IOP: right eye intraocular pressure (mean ± standard deviation and range in mmHg); LE IOP: left eye intraocular pressure (mean ± standard deviation and range in mmHg); p: probability.n: sample size; RE IOP: right eye intraocular pressure (mean ± standard deviation and range in mmHg); LE IOP: left eye intraocular pressure (mean ± standard deviation and range in mmHg); p: probability.
Grouping by age and high blood pressure (HBP). For easier understanding of the sample size distribution across the age groups, those patients with and without HBP were compared with the total number of HBP patients and non-HBP patients, respectively, as a percentage. In addition, the HBP sample was compared with the full sample.
n: sample size; RE IOP: right eye intraocular pressure (mean ± standard deviation and range in mmHg); LE IOP: left eye intraocular pressure (mean ± standard deviation and range in mmHg); p: probability.
The percentage of patients with diabetes in the sample was low up to the age of 55 years, and no statistically significant differences were found in the IOP values between patients with and without diabetes (p > 0.06), and there was no statistically significant increase with increasing age (p > 0.69), as shown in Table 2 of the supplementary material. The refractive error analysis revealed statistically significant differences in IOP between myopia (RE: 15.83±3.14; LE: 15.88±3.20 mm Hg) and hyperopia (RE: 16.14±3.41; LE: 16.26±3.47 mm Hg) for both eyes (p < 0.04) and between hyperopia (RE: 16.14±3.41; LE: 16.26±3.47 mm Hg) for both eyes (p < 0.04) and between hyperopia and emmetropic (RE: 15.48±3.27; LE: 15.36±3.16 mm Hg) in both eyes (p < 0.02) in the total sample but not by age group, as shown in Table 3 of the supplementary material.
Data were analysed according to country of origin, revealing 257 Portuguese data points and 2955 Spanish data points (Table 4 of the supplementary material), with no statistically significant differences in the IOP for both eyes (p > 0.09). Furthermore, the data were organised according to the time of day at which they were collected, with the aim of identifying variations throughout the day that are compatible with the circadian rhythm of IOP. Fig. 1 shows the right and left eye IOP data according to the time of day at which they were collected. In Fig. 2, the mean and 95 % confidence interval were calculated for the same data as a function of the time at which they were taken. The IOP peaks between 10 a.m. and 12 a.m. and decreases from 6 pm. onwards, with a tendency to decrease further at the end of the day.
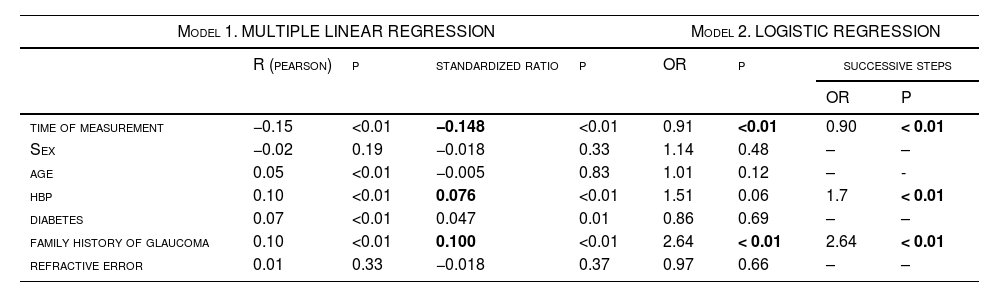
Multiple linear regression and logistic regression.
OR: odds ratio; p: probability.
; LE IOP: left eye intraocular pressure (mmHg).")

Multiple linear regression was performed (Table 4), and a statistically significant relationship was found for all variables (p < 0.01) except for age and refractive error. The overall correlation was 0.21, with R2=0.04; thus, these variables are related to IOP but in a low proportion. The standardised coefficients of variation showed that, of the variables obtained, the one most closely related to IOP variations was time, with a standardised correlation coefficient of −0.148, followed by a history of glaucoma (0.100) and arterial hypertension (0.076). On the other hand, a logistic regression model was used (Table 4) to categorise the IOP as normal (< 22 mm Hg) or altered (≥ 22 mm Hg),14 considering the variables collected. In this case, the variables that had a statistically significant correlation with the IOP value according to the model were the time of measurement and a history of glaucoma, with the latter being a risk factor with an odds ratio of 2.64. By performing this same model in successive steps according to the Wald criterion, the model was reduced to only three factors among those analysed that were related to the IOP value: the time of measurement, HBP and history of glaucoma, as shown in the last two columns of Table 4. This means that HBP and a history of glaucoma are risk factors and, although the time of measurement is correlated, its odds ratio was very close to 1 because it was neither a risk factor nor a protective factor.
DiscussionElevated IOP is commonly accepted as the main risk factor for the development of glaucoma. In this study, we examined IOP in >3000 participants from Spain and Portugal. In this population, significant differences according to sex were ruled out (Table 1 of the supplementary material), as in the Chan et al. EPICNorfolk Eye Study,11 whose results showed sex to be the least important of all of the variables they analysed, with p = 0.52. This is in contrast to the results of Memarzadeh et al.,15 who revealed a small (less than half a millimetre of mercury on average) but statistically significantly higher IOP (p < 0.01) in females than in males, with no clear explanation. The authors proposed it had something to do with women having a more marked tendency for an increase in IOP with age or a higher level of obesity and hypertension in women, along with a longer life expectancy.
Statistically significant differences were found between the IOPs of the left and right eyes (Table 1) in patients younger than 25 years (p < 0.01), in those aged between 25 and 34 years (p = 0.03) and in those older than 64 years (p < 0.01), although clinically, this difference does not seem relevant. Moreover, from the age of 45 years onwards, the mean IOP increased significantly (from 15.6 to 16.4 mm Hg) and not only statistically.
However, a meta-analysis by Khawaja et al.3 revealed a strong inverted U-shaped trend between IOP and age, i.e., the IOP increased with increasing age up to 60 years and then decreased over 70 years. This result is not similar to ours, probably because of the use of different age groupings. However, there is some controversy among studies, as others indicate that IOP increases progressively until the age of 85 years, with little difference between men and women.3,15 Chan et al.16 reported that age can be considered a relevant factor in increasing IOP; however, Terauchi et al.17 reported the opposite findings: IOP does not necessarily increase with age, but the magnitude of IOP decrease throughout life is ∼3 mmHg, and the age-related decreases in IOP are nonlinear and phasic. In our study, although an increase in IOP was observed with increasing age, neither of the two models identified age as a risk factor for increased IOP.
With respect to a family history of glaucoma (Table 2), from 45 years of age onwards, there was an increase in the IOP of the RE and LE in the group with a history of glaucoma compared with the group without a history of glaucoma (p < 0.01). Furthermore, in our outcomes, this group of people over 45 years of age accounted for more than two-thirds of the sample (68.44 %), 59.98 % of whom had no family history of glaucoma, whereas 8.46 % of the total 3121 patients who knew whether they had a family history of glaucoma, or 58.28 % and 8.22 % of the 3212 patients, had a history of glaucoma. A recent study revealed that 0.5 % to 1.5 % of people aged 40–80 years will develop POAG in the next 5 years, an incidence that doubles in cases with a family history of high IOP.18 In contrast, Chan et al.11 reported no association between glaucoma and a history of glaucoma (p = 0.10) in a sample of 314 patients with glaucoma out of a total of >8000 participants, all aged 40–79 years.
Compared with the age range and IOP of patients with and without HBP in Table 3, from the age of 45 years onwards, the percentage of people with HBP increased, and there was a correlation with an increase in IOP (p≤ 0.02 in patients aged 45 to 64 years); however, in those aged over 64 years, this statistically significant relationship disappeared. Khawaja et al.3 also reported an association between HBP and IOP (p < 0.001), which is consistent with both elevated IOP and elevated blood pressure potentially leading to decreased optic nerve head perfusion and a positive association between blood pressure and IOP, as shown in numerous studies.5,8,19,20 Individuals with hypertension have been shown to be at increased risk of developing glaucoma, with more severe neuronal damage in those with glaucoma and hypertension than in those with normal blood pressure. Several studies21–23 have shown correlations between diastolic blood pressure and IOP in the right eye, and these results indicate that there is a correlation of IOP with diastolic blood pressure but not with systolic blood pressure.
Another recent study suggested that both HBP and low blood pressure affect ocular perfusion pressure (OPP) as risk factors for glaucomatous optic neuropathy.24 Abnormal circadian rhythms, such as an increase in nocturnal blood pressure, an absence of a decrease in nocturnal blood pressure, or excessive lowering, have been associated with glaucomatous damage.24 Hypertension and increased blood flow induce an increase in OPP that compensates for elevated IOP. In general, for every 10 mm Hg increase in blood pressure, there is an approximate increase in IOP of 0.28 mm Hg.25,26 A study by Kosior-Jarecka et al. in patients with normotensive glaucoma (NTG) revealed that systemic hypertension was more common in patients with NTG and hypothesised that the systemic vascular profile might predict the morphology of early scotomas in NTG.27
Our data rule out significant differences by diabetes (p > 0.05), probably because the proportion of patients with diabetes in the sample was only 6.07 % (183 out of 3113, see Table 2 of the supplementary material), mainly in the under 55 years of age group (26 cases out of 3013 total). The prevalence of diabetes in Spain is 6.66 %,28 and in Portugal, it is 9.2 %, so the data are consistent but may not be sufficient to find statistical significance.29
IOP variation throughout the day can be very relevant, although difficult to measure. There is evidence analysing long-term and short-term IOP variation showing that many patients diagnosed with NTG actually have POAG, as their ocular pressure curves show IOP fluctuations with high values outside office hours.6 This is why, especially in patients with a family history of glaucoma, an IOP value of <21 mm Hg does not indicate no risk but should be assessed objectively on the basis of a complete examination of the patient. The aim is to detect and reduce IOP fluctuations in patients with such a family history or in those who already have glaucoma.6 The data (Fig. 1) show a representation of the IOP recordings associated with the time they were taken in the expectation that this representation would be similar to that of a curve, as shown in the meta-analysis,30 in which the IOP of patients with glaucoma was analysed at different times of the day, and the results were that only between 10 a.m. and 2 pm. was there a decrease in IOP of approximately 1.5 mmHg (in our data from patients without glaucoma, the variation was smaller), then it stabilized until 6 pm. and continued to decrease until 12 pm., when it started to rise, with the maximum occurring at approximately 8 a.m. In healthy subjects, IOP varies between 2 and 5 mm Hg over the course of a day, being 6 to 8 mm Hg in patients with ocular hypertension (derived from HBP) and reaching a 15 mm Hg daily variation in some cases.31 Another study reported that in patients with glaucoma, the IOP variation over a day can be twice as high as that in healthy patients.32
On the other hand, the IOP of healthy subjects was compared with that of nocturnal experimental animals (rabbits, rats and mice), and it was concluded that humans tend to have increased IOP during the night and that IOP peaks in the early morning, as in the case of mice, whose maximum IOP also occurs during the dark phase. However, these oscillations are generated mainly by the internal circadian clock of the mouse and, to a lesser extent, by ambient light.33,34
Finally, in the multiple linear regression table (Table 4), the correlations are small (overall correlation of 0.21 and r2 of 0.04) and are not sufficient to predict an increase in IOP with these variables analysed. In fact, despite the statistical significance, the model shows a very low predictive power with the data collected. All variables were statistically significant except sex and refractive error, although in the case of refractive error, only the refractive category (myopia magna, myopia, emmetropia, or hyperopia) was taken into account and not the prescription value. Although this is not sufficient to rule out the influence of refractive error on IOP, it is in line with other investigations, such as the Chan et al. EPICNorfolk Eye Study, whose statistical analysis also ruled out this relationship, with a p = 0.13.11 However, it can be concluded that family history, the presence of HBP and the time of day at which the measurement is taken do influence the IOP value, as has been observed in other studies.5,10,20,25,26
Nevertheless, this study is not without limitations. The main limitation is the collection of IOP data via five models of air tonometers, which is a technology that has been shown to be reliable in normal IOP ranges, but these models may not be interchangeable devices, as some studies suggest.35,36 Upon analysis of the study outcomes, no significant differences in intraocular pressure (IOP) measurements were found for some of the tonometers used. In certain cases, statistically significant differences in IOP values were accompanied by differences in the average age of the groups, making it difficult to attribute the differences solely to the type of tonometer. However, in other comparisons—such as NT-510 versus CT-80 and CT-800, and CT-80 versus CT-800—significant differences in IOP were observed despite no differences in age, suggesting that these devices may not be interchangeable. Since this was not the primary objective of the study, group homogeneity regarding other potentially influential variables was not guaranteed. Additionally, the absence of night-time measurements represents a limitation for capturing a complete circadian profile of intraocular pressure. Another possible limitation arises from the origin of the sample, which, being drawn from optometric centres, may limit the generalisability of the results despite the sample size.
In conclusion, IOP values increased with age in this sample, and IOP also increased in patients with HBP, identifying this disease as a risk factor along with a family history of glaucoma. The time at which IOP is taken also seems to be an important factor to consider, although it was not identified as a risk factor, and the results obtained do not correlate with the expected circadian variation.
FundingThis study has not received any funding.
Author contributions statementCB and IS have participated in the processes of Conceptualization, Data curation, Formal analysis, Investigation, Methodology, Project administration, Resources, Supervision, Validation, Visualization, Writing - original draft, Writing - review & editing. BP, AL, JML, PL have participated in the processes of Data curation, Visualization, Writing - original draft, Writing - review & editing.
The authors have no conflict of interest with any company or material used in this study.
We would like to thank the inGO centres of General Optica in Spain and Mais Optica in Portugal, whose support in data collection and protocol adherence was fundamental to this study. We especially acknowledge the investigators at each centre who contributed to data collection with a high level of scientific rigour. Our thanks also go to all individuals who took part in the study, whose involvement made these results possible.


