


We aimed to determine if visual acuity (VA) could differentiate the quality of vision with two ophthalmic lenses with unwanted astigmatism.
MethodsTwenty presbyopic subjects (48 to 62 years old; VA better than 0.0 logMAR) graded the magnitude of their preference between two progressive addition lenses (plano addition 2.00D) and their visual acuities were measured with both lenses at various eccentricities from -12 to +12 mm from the near vision point every 3 mm in controlled conditions.
ResultsThe Lens with the least peripheral astigmatism was preferred by 75% of the subjects. VA measured at the near vision point was statistically worse (p<0.01) with this lens whereas the contrary was observed in the periphery (± 12 and -9 mm of eccentricity). The Friedman test shows that the eccentricity (p<0.001) has a significant effect on visual acuity. However, the lens did not show any significant effect (p=0.76). The choice of the favorite lens was predicted for only 35% when considering central VA (up to 6mm) and 80% of the subjects when considering peripheral VA (9 to 12mm). However, the magnitude of the difference could be predicted by peripheral VA in only 60% of the subjects.
ConclusionHigh contrast Visual acuity was clearly able to differentiate the 2 lens designs tested in our experiment. However, even under the controlled conditions of this study, it was not possible to predict the quality of vision, as measured by a subjective appreciation, through progressive addition lenses at various eccentricities from the near vision with an addition of 2.0D.
Visual acuity, commonly defined as the ability to resolve details of an object, is often considered as the gold standard to determine the quality of an optical correction.1,2 Measuring visual acuity at various contrast (High contrast, low contrast) or measuring contrast sensitivity is an alternative often used in research for a better and complete evaluation of the optical quality,2,3 but rarely used in clinical practice. High contrast Visual Acuity, though still considered as a gold standard, seems not sufficient alone to properly evaluate the quality of vision. Indeed, visual acuity is rarely used as an endpoint of refraction by the practitioner to determine the optimal correction of a patient: a correction will never be worn if the quality of vision is judged unacceptable by the wearer, even if visual acuity is acceptable. In addition, clinicians sometimes report patients with high visual acuity complaining about poor vision quality and vice versa. To our knowledge, this has never been studied in the context of evaluating the quality of vision in progressive addition lenses (PAL). Impact of PAL aberrations on high contrast Visual acuity has been evaluated and clearly demonstrated.4 However, the link with subjective appreciation has not been studied.
The main goal of this work was to determine if high contrast visual acuity alone is able to differentiate the quality of vision obtained in the global field of view with lenses containing various combinations of defocus and astigmatism. Such refractive errors can be found in the periphery of progressive addition lenses. The periphery of progressive addition lenses contains unwanted astigmatism.5-8 The Minkwitz theorem, valid for umbilical lines on a surface (i.e., without any astigmatism), states that astigmatism perpendicular to the corridor (i.e., the vertical meridian line joining the far and near vision points of the lens) changes twice as quickly as the rate of change of power along the corridor.8-9 As modern progressive addition lenses do not show an umbilical principal line, a “generalized Minkwitz theorem” was proposed by Esser et al.22 It stated that the increase of the astigmatism perpendicular to the principal line depends on the power increase but also on the astigmatism increase along the principal line. Thus, unwanted astigmatism is proportional to the addition of the lens and moreover, is more impacting vision in intermediate and near vision than for distance vision.
Mok et al.10 measured the quality of vision at different horizontal eccentricities from the distance vision point of progressive addition lens. Subjects had to grade their quality of vision by scoring the perceived blur on a 0 to 10 grading scale. The authors compared two conditions: (i) a progressive addition lens correcting the distance correction of the subject plus a plano power single vision lens or (ii) a Plano progressive addition lens plus an additional lens correcting the distance correction of the subject. They found significant differences in the subjective rating but not in the visual acuity between the two conditions. However, they only studied the distance optical area of the lens while the near vision area may be more impacting due to the presence of the peripheral aberrations. The difficulty of evaluating the near vision subjective quality is that it is highly dependent on the lens on one hand (addition level, hardness of the design) and the subject on the other hand (accommodative ability, refraction, pupil size).
Ohlendorf et al.11 and Remón et al.12 have compared the effect of simulated and real astigmatism on visual acuity. They found that simulated astigmatism reduced visual acuity by 40% to 60% more than astigmatism induced by a real optical system. This difference could be explained either by the method of simulation or by the uncontrolled accommodation of their subjects. In the real condition, the subjects could exercise some accommodation and hence optimize the retinal image. In the simulated condition, it was assumed that accommodation could only degrade the quality of the retinal image (simulated image cannot be focused on the retina). Thus, it is not clear whether visual acuity alone can account for the subjective preference of a spectacle lens, or whether there are other factors that could explain the preference.
In the present experiment, we measured high contrast visual acuity and the subjective preference in a progressive addition lens with two different optical designs (lens A and lens B), in controlled near vision conditions (i.e., controlling the gaze direction and removing the effect of varying the addition). The ability of visual acuity to differentiate two kinds of progressive addition lenses (i.e., hard and soft design) was tested.
MethodsThe study was approved by a human research ethics committee (Comité de Protection des personnes Ile de France, Aulnay-sous-bois, France) and was registered (ANSM 2018-A03296-49). The study followed the tenets of the Declaration of Helsinki. All subjects provided written informed consent before the experiment.
SubjectsTwenty presbyopic subjects (addition higher or equal to 1.25 D), aged between 48 to 62 years old, with good ocular and general health were enrolled. Fifteen subjects were progressive addition lens wearers and 5 subjects wore only near vision lenses. Refractive error (i.e., spherical equivalent) and absolute cylinder value respectively ranged from -5.50 to +2.50 D and from 0 to 1.50 D. All the subjects had monocular ETDRS visual acuity better than 0.0 logMAR with their best correction. Their higher order aberrations measured on a 4.5 mm pupil size were lower than 0.25 µm RMS. We measured their right eye's remaining accommodation level using the dynamic retinoscopy procedure which provides a precise and valid method for assessing the objective amplitude of accommodation.13-15 Their amplitude of accommodation ranged from 0.08 to 1.72 D (0.76 ± 0.43 D in average).
General methodThe main goal of this study was to test the ability of high contrast visual acuity to differentiate the quality of vision obtained with two progressive addition lenses.
We performed two different experiments in laboratory-controlled conditions: (i) subjective preference gradation and (ii) high contrast visual acuity measurement at controlled eccentricities, with two progressive addition lenses (plano addition 2.00D).
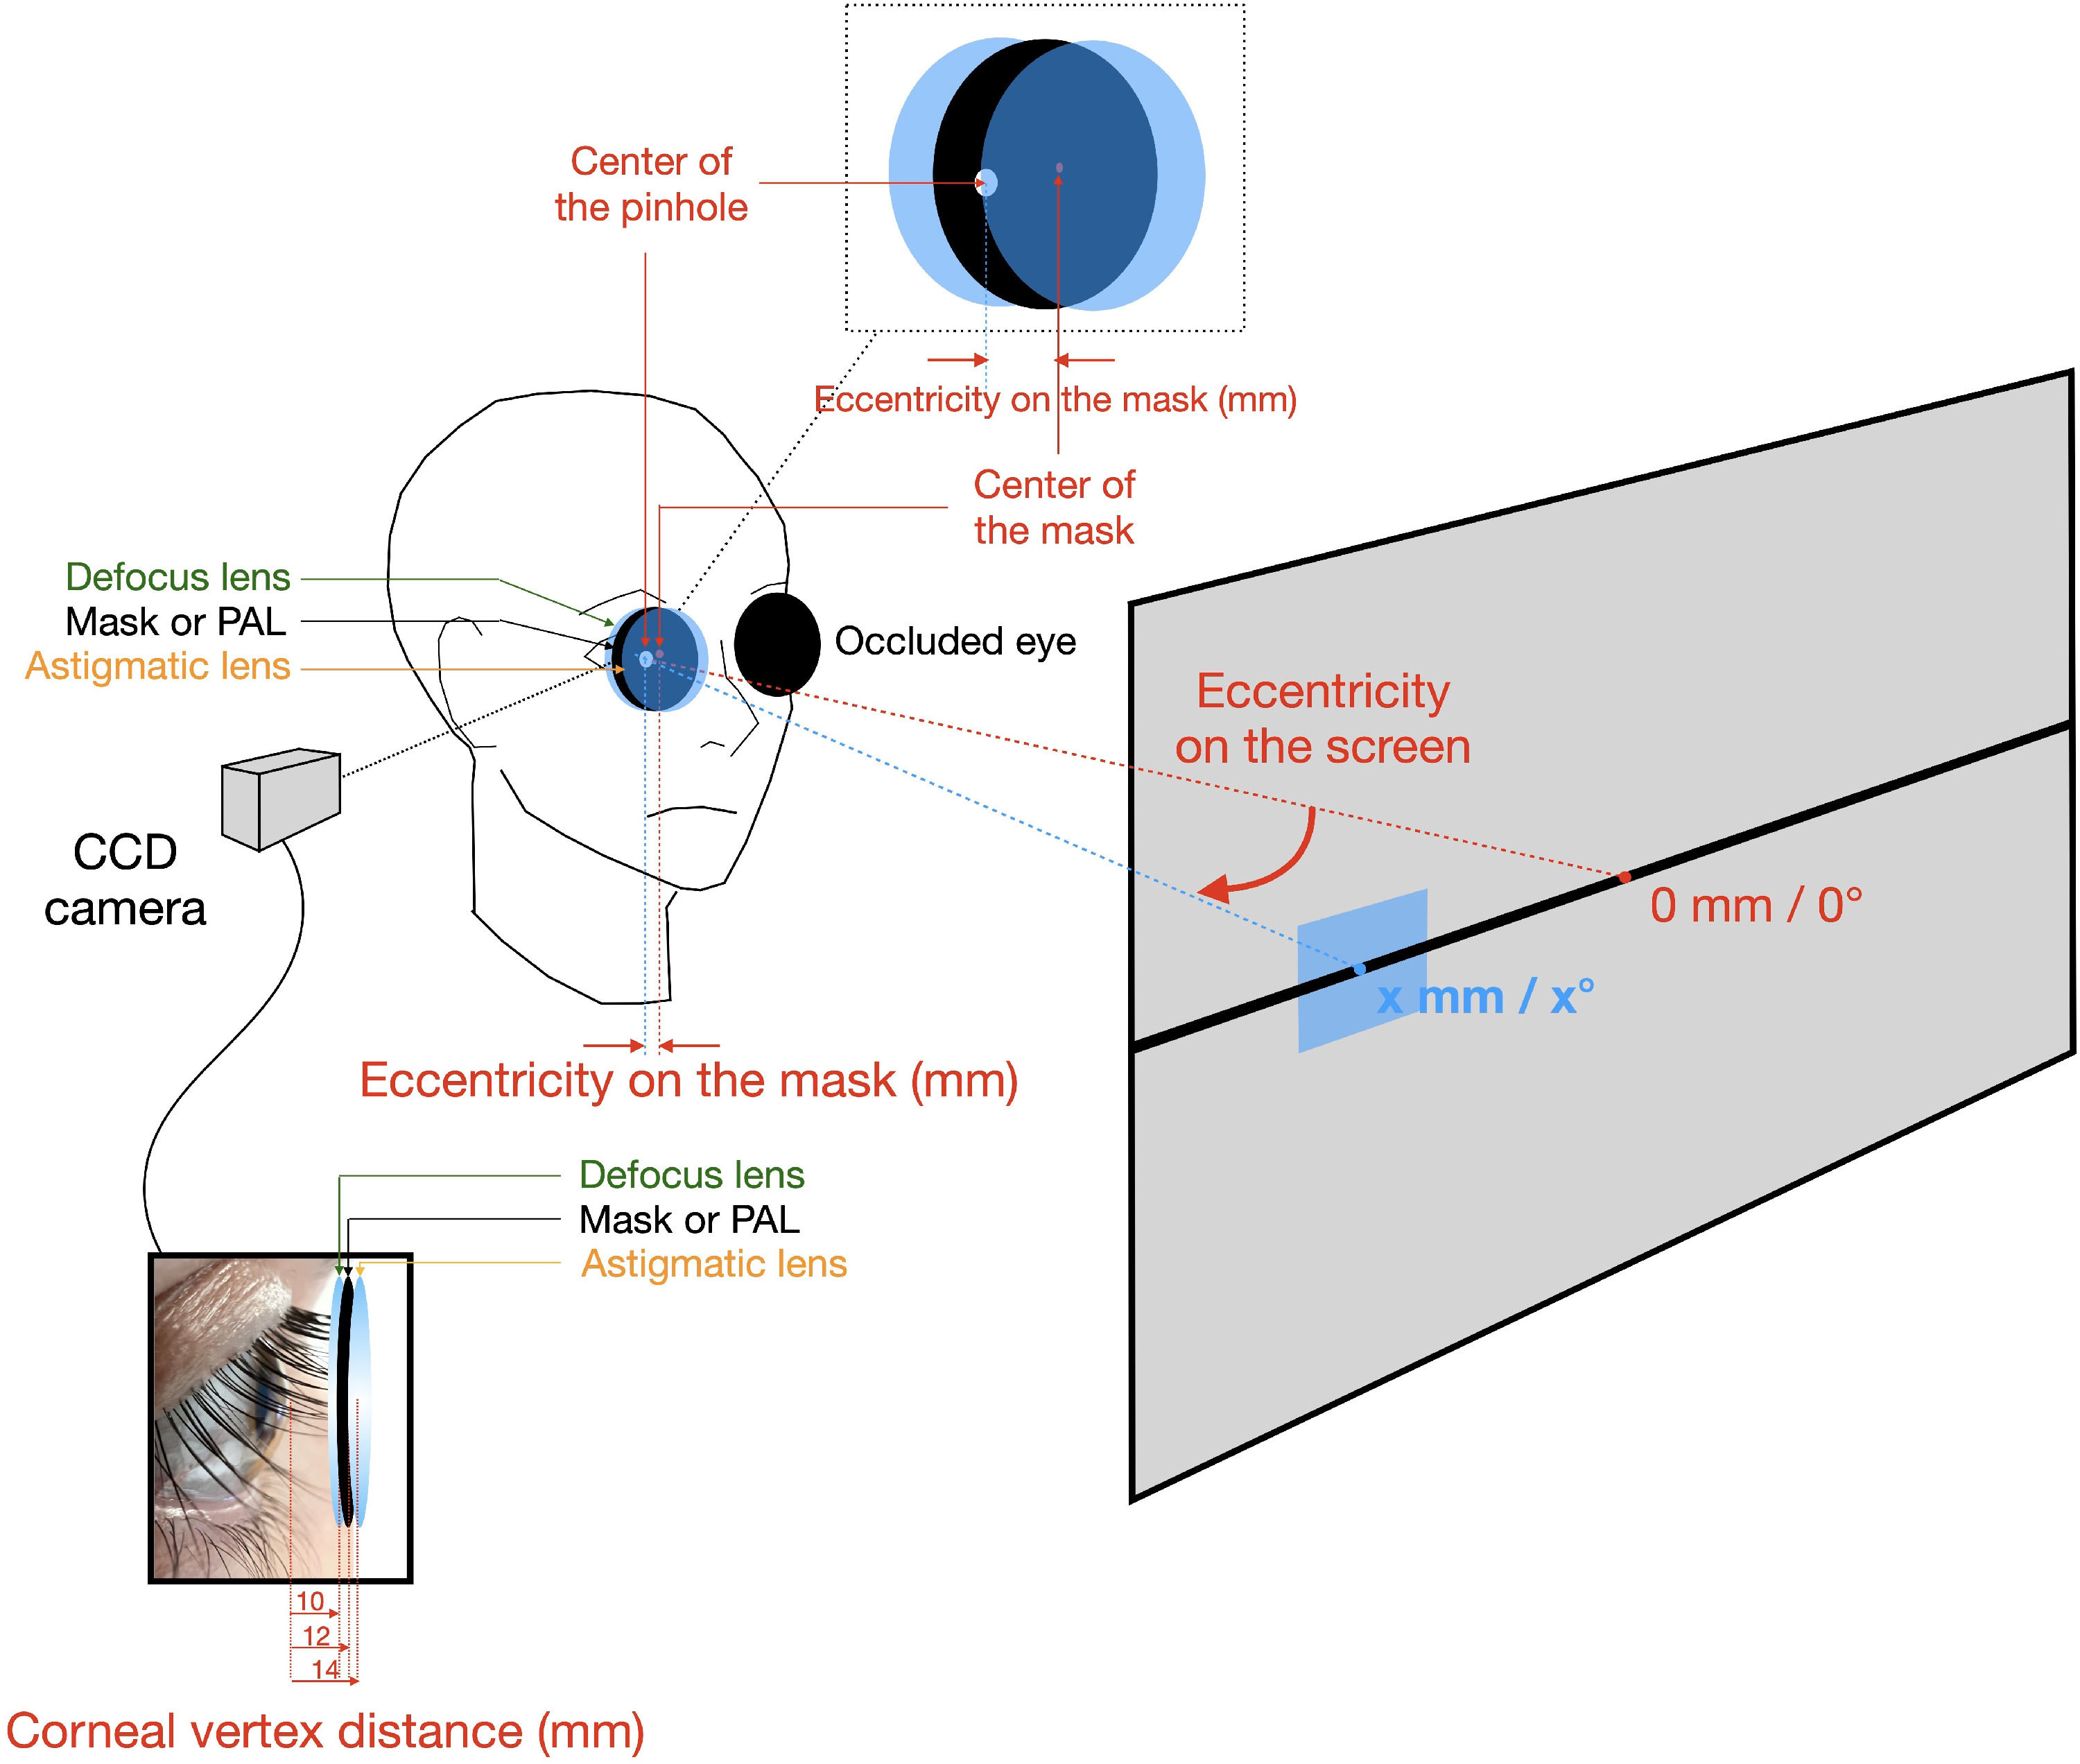
For the subjective preference gradation, the subject viewed a text displayed on a monitor covering the main part of the field of view seen through the aperture of the lenses (around 50°) at 50 cm. For the visual acuity tests, the subject viewed the target on a micro-display (OLED micro-display, Emagin, New-York, United States) through progressive addition lenses. The angular size of the micro-display was 114 × 86 arc minutes with a resolution of 800 × 600 pixels (angular pixel size of 0.143 arc minutes). Its luminance was 100 cd.m−2. During the measurement, the subject's head was stabilized thanks to a bite bar and forehead rest. The micro-display was moved along the horizontal axis placed 50 cm from the subject. The subject did not move his or her head but shifted his or her gaze to look at the image. The goal was that the subject viewed the image through the desired peripheral area of the progressive addition lens. All the experiments were carried out monocularly with the right eye. To achieve the distance refraction and the adjustment for comfortable viewing of the micro-display, subjects wore one or two lenses (i.e., subjects respectively without or with astigmatism) placed either side of the PAL front face (see figure 1). PAL A was used to adjust for comfortable viewing. The same adjustment was used for both PAL since PAL A & B differed by only 0.1 D in the central 6 mm in diameter. Subjects began either with experiment 1 or 2 (half began with experiment 1). The experiments were randomly conducted to limit the impact of the order in the experiments. In both experiments, PAL A and B were randomly tested. In experiment 2, visual acuity was measured at each eccentricity in a random order.
Conditions control method
The subject's pupil size and position were controlled by a camera system placed perpendicularly to the subject's axis of vision. To ensure an identical correspondence between the position of the eccentricities on the PAL and the eccentricity of the gaze direction for all subjects, the eye-lens vertex distance was also controlled with the same camera system and adjusted to be 12 mm for all subjects. The cornea-vertex distance (i.e., 12 mm) was measured between the corneal surface and the rear face of the PAL. The corrective spherical lens was placed at 10 mm from the eye and the corrective astigmatism lens was placed at 14 mm from the cornea (see figure 1). The PAL are optimized for a vertex distance of 12 mm and a pantoscopic tilt of 10°. In the experiments, the same vertex distance was used, however, null angles were used to keep an accurate control of the centering of the lens. Nevertheless, as mentioned in the caption of table 1, the exact values corresponding to the condition of the experiment have been recalculated for the lenses. To ensure a perfect positioning of the eccentricity of the point used on the PAL surfaces, whatever was the correction worn by the subjects, we calibrated the corresponding positions of the micro-display by using a mask with pinholes set at each eccentricity. The calibration mask was positioned at the place of the PAL (i.e., between the eye and subject's refraction (see figure 1). The calibration measurements were made 3 times for each subject. This calibration step was made with the subjects wearing the correction with an addition of 2D, thus allowing taking into account the prismatic effects of the lenses used during the experiments. After the calibration step, the pinhole mask was removed and replaced by the PAL, the field of view remained fully open in the limits of the aperture of the edged lens (36 mm diameter).
Theoretical defocus and astigmatism values that have been calculated on both PALs for horizontal eccentricities every 3 mm from the near experiment. Positive values are for nasal eccentricities. Note that the values presented here are the theoretical optical power values calculated with ray tracing in the experimental set-up conditions to account for the actual oblique incidence of the rays, not the one for which the lens has been optimized. For example, in the experiments, the angular position of the lens in front of the eye is null to ensure a better control of the positioning of the lens compared to the eye pupil, whereas the lens has been optimized for a standard pantoscopic angle of 10°, which is known to vary the effective power of the lens due to oblique incident light pencil21. This is why the spherical defocus value is not purely equal to the addition (2.0D) at the exact near vision point location (0).
All the measurements were repeated three times. The measurements lasted approximately 2 hours per subject. In this study, the subjects tested had a wide range of refractive errors, which raises the possibility that the level of refractive error affects the results. However, the calibration step, with the pinhole mask significantly reduces this risk. Indeed, the calibration step is made with the subjects wearing the correction and the addition used during the experiment, thus allowing taking into account the prismatic effects of the lenses in the settings of the eccentricities. Moreover, the experiment was set so that for each subject, the gaze directions and the point of the PAL that were tested was always the same (the eye-lens vertex distance was adjusted to be 12 mm for all subjects), irrespective of their initial correction needs, reducing even more the variation between subjects and the impact of their refractive error.
In this study, we have decided not to use a gaze contingent method to measure the visual acuity at desired gaze eccentricities. Instead, we use a more basic method with a pinhole calibration. Though gaze contingent presentation is seen as the most advanced method today to control the gaze direction,16-17 we believe that it has some inconvenient and that it was not adapted to our experiment: to avoid any bias in the visual acuity, it would have requested a perfect synchronization with very low latency that would have need expensive material and add a high complexity in the experiment. Moreover, the system for eye tracking may have disturbed or limited the field of view, something that we try to avoid as much as possible in our experiment. Finally, eye tracking systems are poorly adapted to work through ophthalmic lenses, especially progressive ones. On the contrary, our calibration system with pinholes to place correctly the micro-display and the displayed target was simple, robust and very efficient. The accuracy of the micro-display positioning was better than +-5 mm at 50 cm, corresponding to an error less than +-0.12mm in the positioning of the point used on the PAL surfaces, without the need of any complex system potentially disturbing the field of view during the experiment.
To remove the impact of varying the addition, all the subjects viewed the target (either the text or the visual acuity target), positioned at 50 cm, through a progressive addition (plano, add +2.00D) and their best distance correction, adjusted to be comfortable at 50 cm, irrespective of their natural addition needs in natural condition, that may take into account various near vision distance. The main reason for doing this is to avoid the natural variation in subjective judgment, due to the change in peripheral aberration according to the addition level. The second reason is to better control the conditions (distance) in which the lenses are evaluated. By doing this, the lenses were not used in their optimal conditions, since they were optimized for a near vision distance of 40 cm. Moreover, subjects were not with their optimal natural correction for near vision (prescribed addition). However, both quality of vision and visual acuity were measured in the same condition. Moreover, since the control of gaze direction and conditions implied the use of a bit bar with fixed head, the objective of this study was not to reproduce the natural conditions of use of the lenses but rather, by controlling the conditions, to ensure a comparison in similar conditions as much as possible. This implies that the aberrations perceived in any of the conditions were different from the one seen in natural conditions of use. The goal of this experiment was not to compare lenses in real conditions of life but to test the ability of high contrast visual acuity measurement to differentiate two progressive addition lenses. However, the differences are small compared to the level of aberration typically observed in the lenses (see table 1).
Two progressive addition lenses (Varilux Ipseo Crizal Stylis Essilor© available in different designs associated with different eye-head coordination) were tested. They differ in the level of peripheral astigmatism along horizontal eccentricities at the height of the near vision point. They were edged (i.e., 36mm full aperture) such that the near vision was in the center of the lens.
The design of the first lens (Lens A), dedicated to patients who mainly turn their eyes to view an object in their eccentric field of view, is called “hard” design since the level of astigmatism increases rapidly in the periphery of the lens. The area of the lens devoted to near vision and free of astigmatism is large. The design of the second lens (Lens B), called “soft” design, is worn by patients who preferentially turn their head when viewing an eccentric object. The level of astigmatism increases slowly from the near vision point of the lens. The area free of astigmatism is only present close to the near vision point. A quantitative description of the variation of astigmatism is given in table 1 for the two designs. Hard and soft designs are more largely discussed by Meister et al.4.
Nine eccentricities were tested in the experiment (see Table 1). They corresponded to horizontal eccentric points ranging from -12 mm (i.e., nasal direction) to +12 mm (i.e., temporal direction) every 3 mm from the near vision point, with levels and axis of astigmatism and defocus that can be calculated from the progressive addition lens design and are detailed in table 1. When viewing at the edge of the page or when measuring acuities at the highest eccentricities, the distance between the eye and the target increased by around 10% involving a less accommodative demand of around 0.2 D.
Subjects’ taskTwo experiments were carried out in random order.
Experiment 1: Preference gradationSubjects viewed a page of a newspaper with different font sizes and different contrast (see figure 2). It was displayed on a monitor at 50 cm. The total angular size of the page was around 50° (+-25°) when rotating the eye. To view the edges of the page, the subject had to turn his/her eyes so that his/her visual axis passed at ± 12 mm of eccentricity from the near vision point of the progressive addition lens.

Subjects were asked to look at the whole document, to look at peripheral areas of the document, to read some pieces of text and to appreciate the overall view. Both progressive addition lenses were randomly tested. Subjects did not know which lens they wore. Subjects had to indicate which of the progressive addition lenses gives the overall best quality of vision and they had to score their preference (i.e., low, moderate or high preference).
Experiment 2: Visual acuity measurementsWe used the software FrACT (Freiburg Acuity and Contrast Test) developed by the University of Freiburg18-19 to measure the visual acuity with a forced-choice 8 orientations Landolt's C following a best-PEST psychometric procedure. Visual acuity was measured three times for each eccentricity from -12 mm to +12 mm (corresponding to +/-24° eccentricity for a 12 mm vertex distance when rotating the eye) in a 3 mm step and in a random order. The order in which lenses A and B were tested varied randomly between subjects.
Statistical analysisA Friedman and Wilcoxon signed rank test were used to test the significance of the difference between all the visual acuity measurements. A Mann-Withney U test was used to check the potential link between age, addition or amplitude accommodation with the preferred lens.
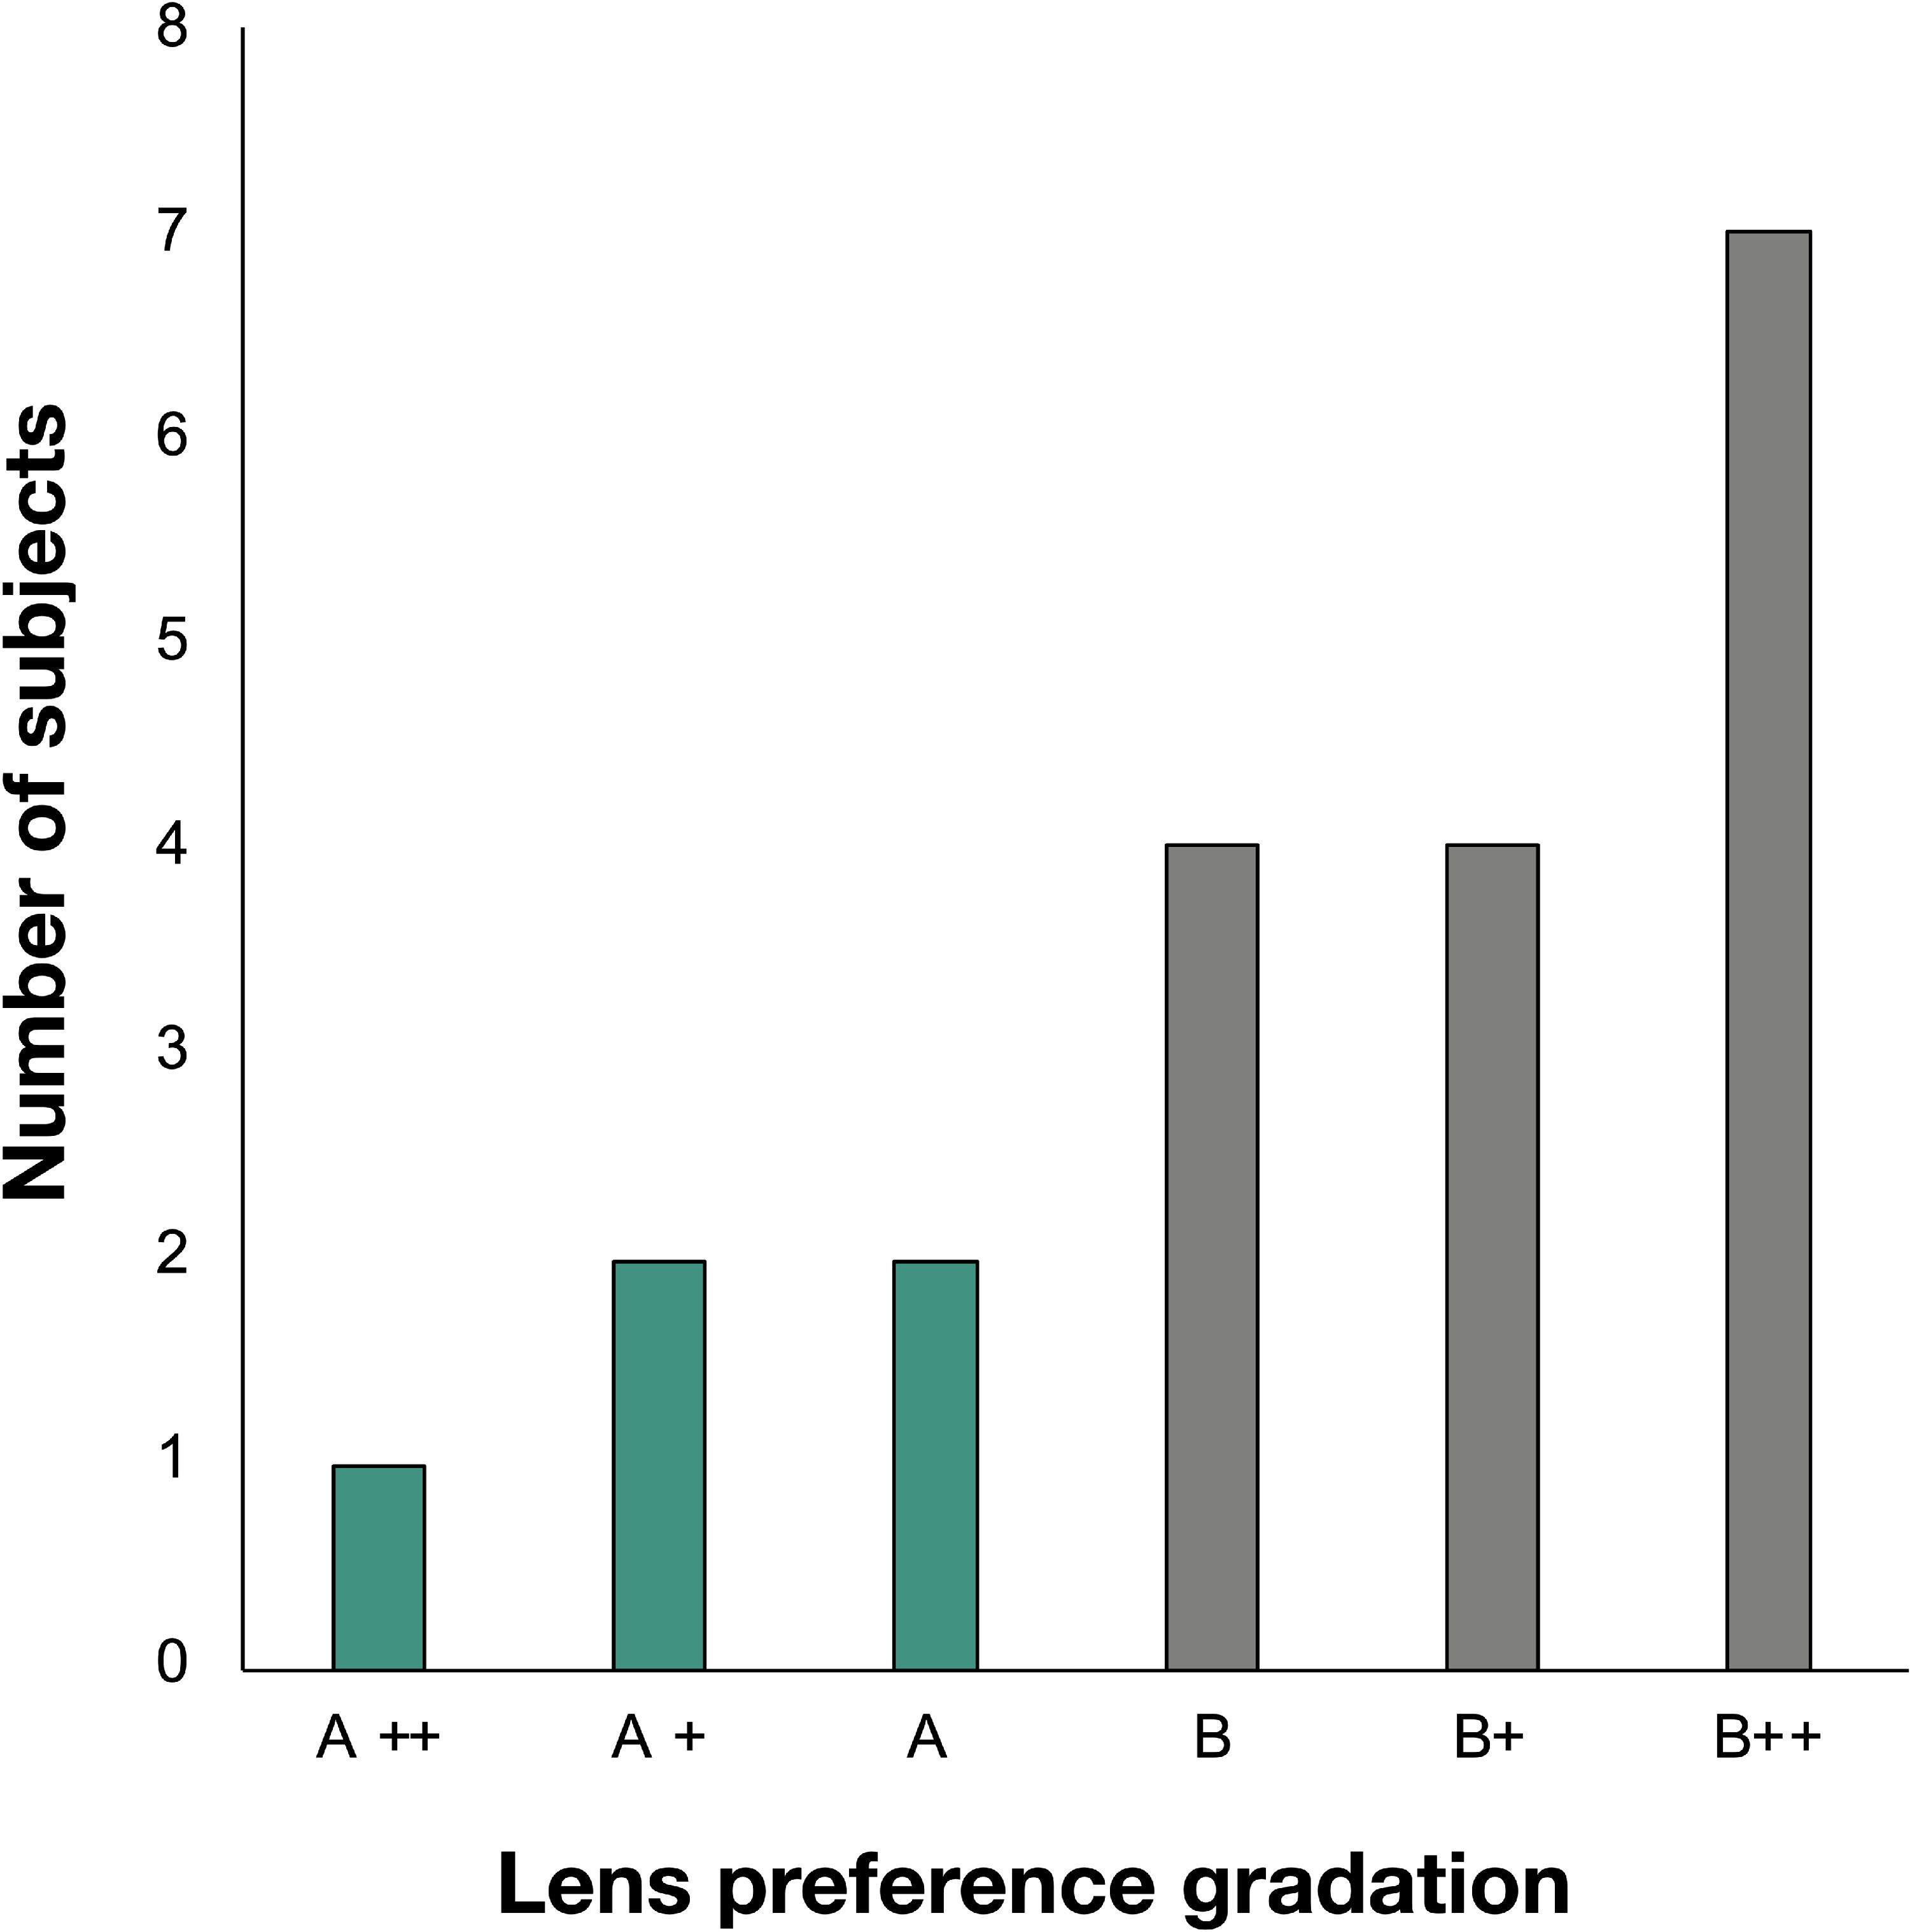
ResultsExperiment 1: Preference gradationSubjects had to choose which lens A or B gave the better quality of vision when viewing a page of a newspaper and to grade this difference (i.e., low, moderate or high). Figure 3 represents the number of subjects according to their preference. 15 subjects preferred the quality of vision with lens B and 5 preferred Lens A and in most cases, the preference was slight or moderate. For 8 of them (40%) the difference was strong, for 6 of them (30%), it was moderate and for the remaining 6 (30%), the difference was low. However, Lens B was often highly preferred. No relations were found between the appreciations and the age (p=0.29), nor with the addition (p=0.46) and the amplitude of accommodation (p=0.87) of the subjects (Mann-Withney U test).
Experiment 2: Visual acuity
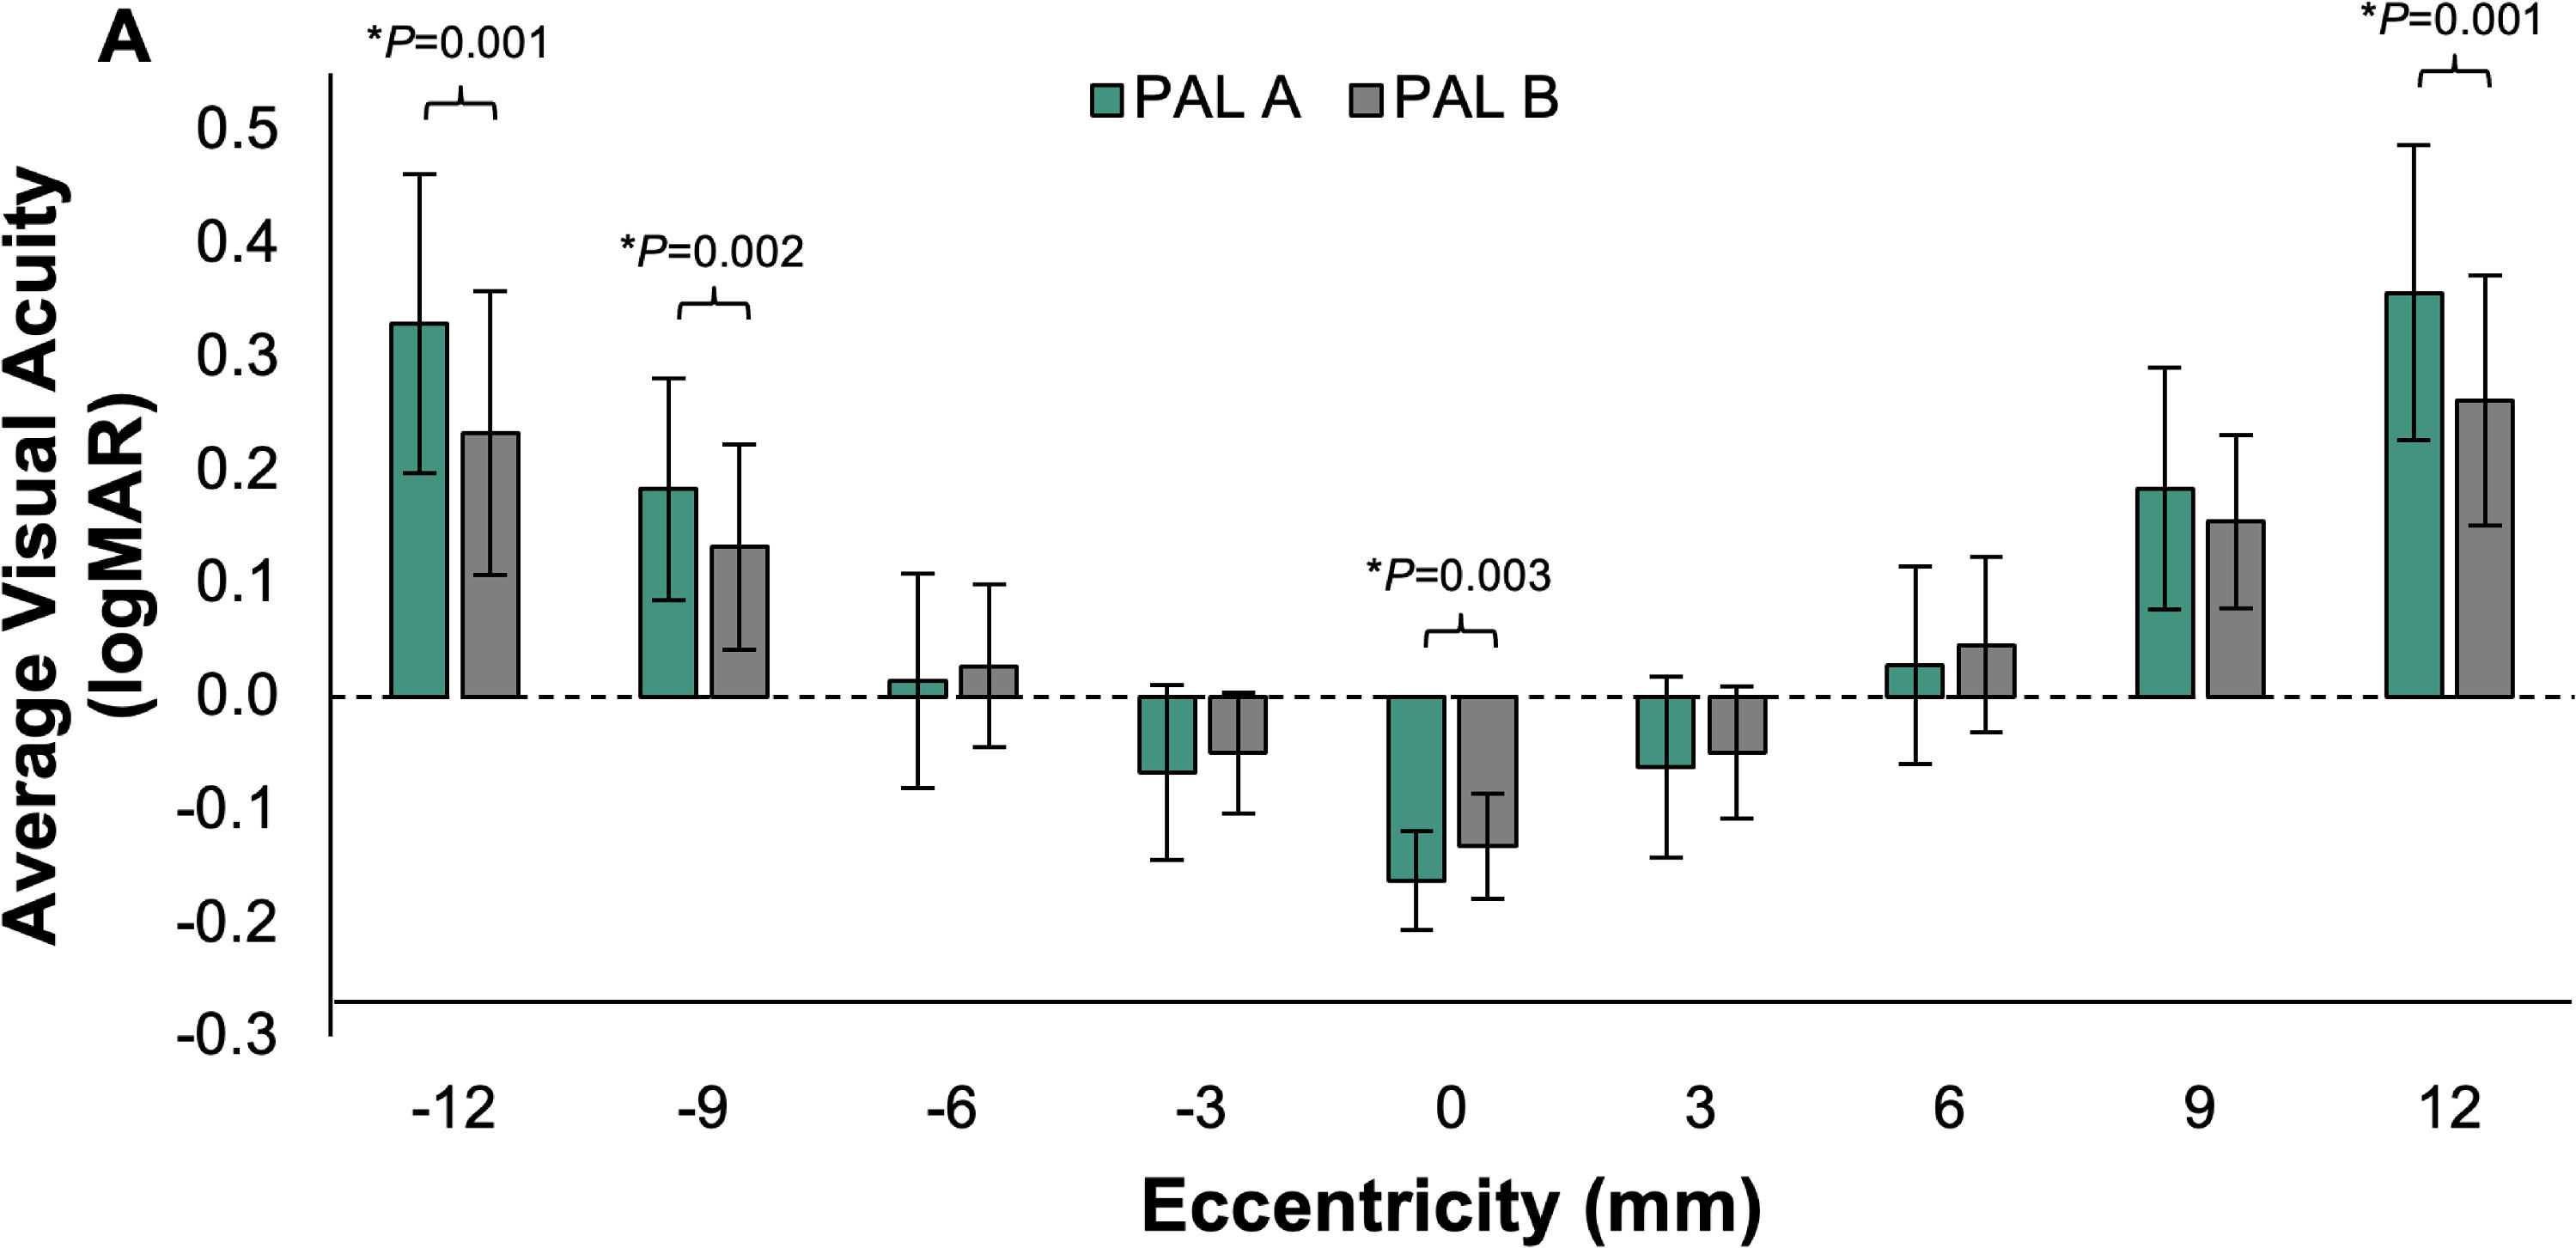
The averaged intra-individual standard deviation was 0.03 logMAR in the lenses A and B conditions, which is close to the step of measurement (i.e., 0.02 logMAR). The average inter-individual standard deviations were 0.09 and 0.08 respectively for lens A and lens B. Figure 4 represents the average visual acuity for each eccentricity (-12 to +12 mm each 3 mm) and each progressive addition lens. The difference between the two PALs was statistically significant at -12, -9, 0 and +12 mm of eccentricity (Wilcoxon signed rank test, P < 0.01). Close to the near vision point of the progressive addition lenses (between -6 to +6 mm), visual acuity with lens A was better than with lens B, but the difference was only statistically significant in the near vision point (i.e., 0 mm). In the periphery (i.e., -12 to -9 mm and +9 to +12 mm), visual acuity with lens B was better than with lens A. The average difference was always lower than one line of acuity (0.1 logMAR). The mean visual acuity difference between both progressive addition lenses was 0.02 logMAR, with a 95% limit of agreement of 0.18 logMAR. The Friedman test shows that the eccentricity had an effect on visual acuity (p<0.001). However, the lens did not show any significant effect (p=0.76).
 obtained with PAL A (green) and PAL B (grey) for each eccentricity (mm). Vertical bars represent standard deviations. Positive values are for nasal eccentricities.")
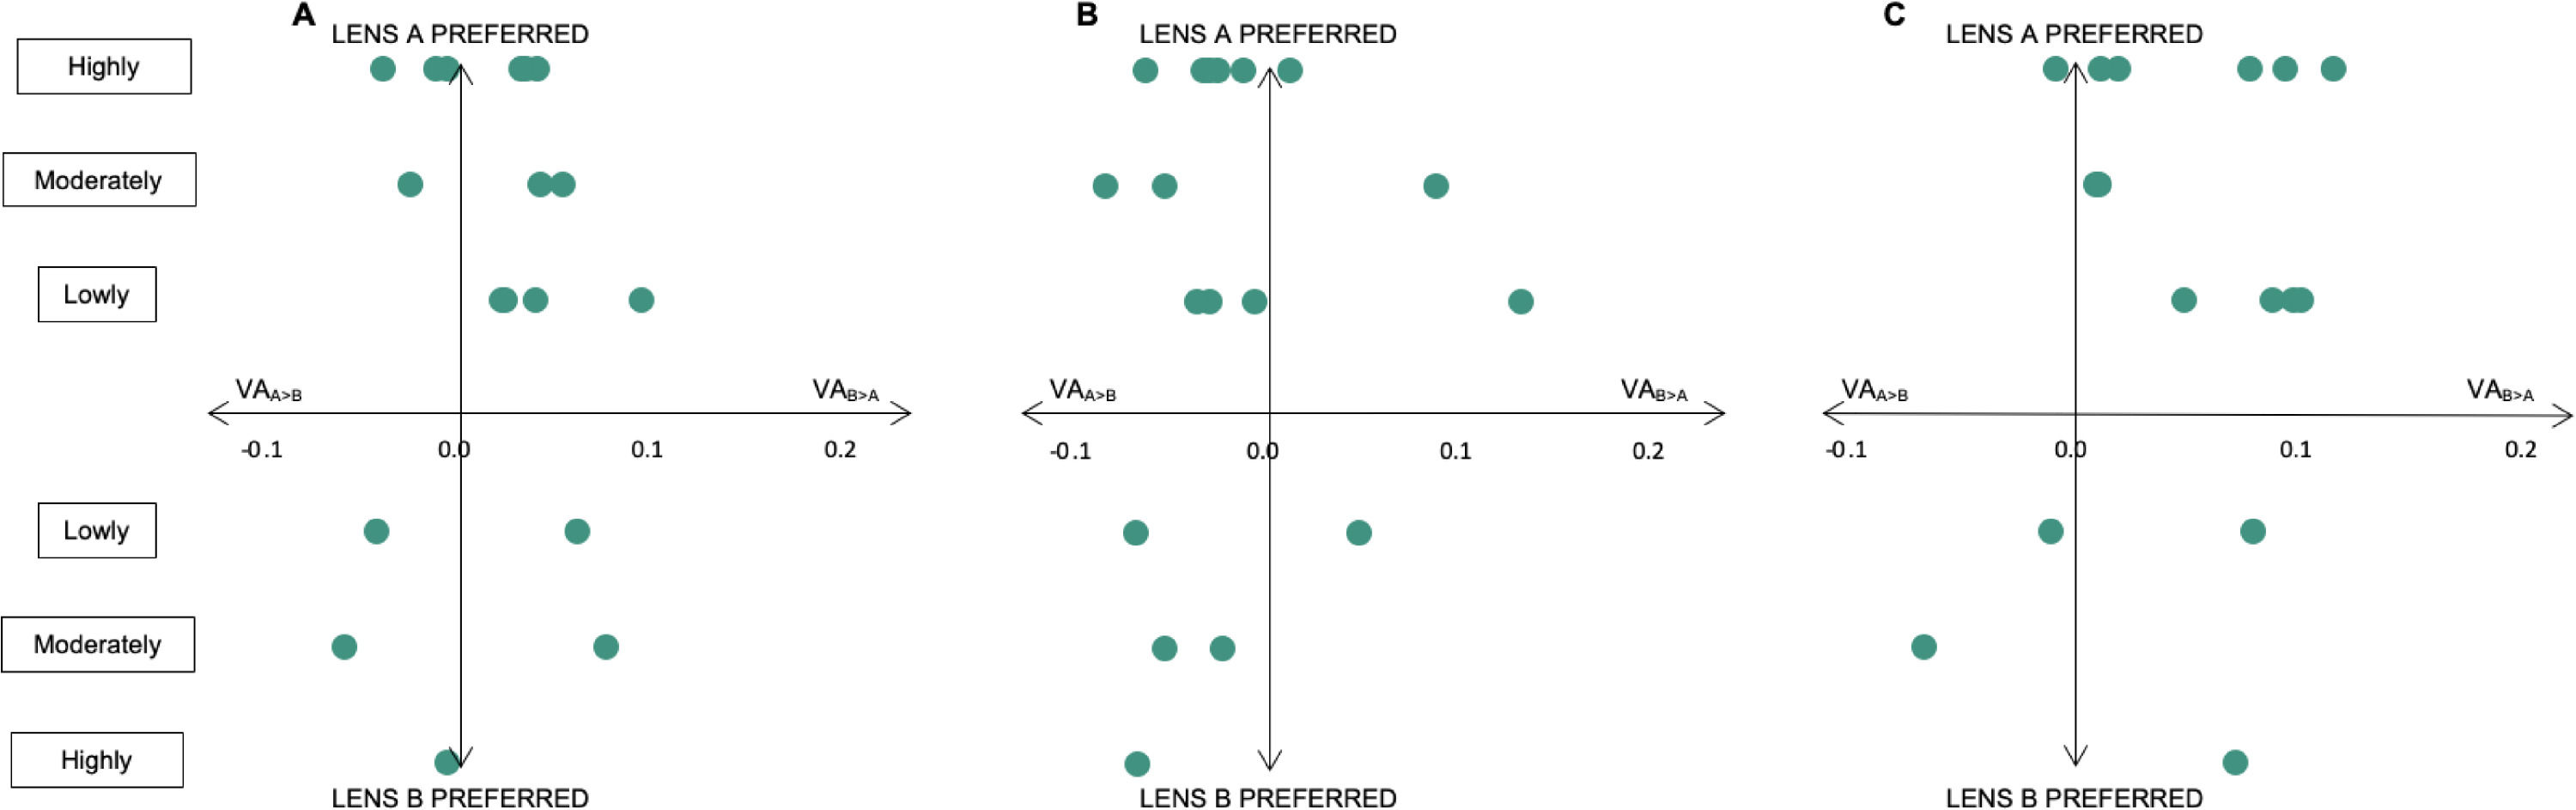
The level of preference (low, moderate, high measured in experiment 1) was analyzed against the mean difference of visual acuity between both PALs considering either the total eccentricities, or only the center or the periphery. Figure 5(A) shows the mean difference in visual acuity between progressive addition lenses A and B as a function of the subjective preference. Each point corresponds to one subject. To consider visual acuity as a discriminant factor, all the dots should either be on the top-left or bottom-right part of the graph. The higher visual acuity difference (X-axis) should involve a higher preference gradation (Y-axis). Figure 5 (B) and (C) considered respectively only the center of the progressive addition lens (from -6 to +6 mm) or only the periphery (from -12 to -9 mm and +9 to +12 mm). Visual acuity is not in accordance with the preference gradation for 7 subjects (35%) when considering all the eccentricities, for 13 subjects (65%) when only considering the central area of the lens close to the near vision point and for 4 subjects (20%) when only considering the more peripheral area from the near vision point of the lens.
, when only considering the more central eccentricities (-6 to +6 mm) (B) and when only considering the more peripheral eccentricities (-12 to -9 mm and +9 to +12 mm) (C).")
Preference gradation as a function of the difference in visual acuity when considering all the eccentricities (A), when only considering the more central eccentricities (-6 to +6 mm) (B) and when only considering the more peripheral eccentricities (-12 to -9 mm and +9 to +12 mm) (C).
When viewing a page of a newspaper in experiment 1, the subjects were able to differentiate the two lenses. It should be noticed that the choice was forced; Subjects should make a choice between both progressive addition lenses. Only 6 subjects (30%) judged the difference to be low whereas all others rated differences as more significant (moderate or high). Whereas in experiment 2 visual acuity measured in the area close to the near vision point (i.e., -6 to +6 mm) was better with lens A, it became worse with this lens when measured in the periphery (i.e., -12 to -9 and +9 to +12 mm) at the same height than the near vision point. This result, confirmed by the Wilcoxon and ANOVA test, is in accordance with the horizontal distribution of astigmatism at this height. Lens A exhibits larger levels of astigmatism in the periphery of the near vision point. Furthermore, it is not surprising that at eccentricity +9 mm there is not a statistically significant difference in visual acuity since astigmatism is very similar between the 2 designs at this eccentricity. On the other hand, it is very different at other intermediate eccentricities; indeed, the design A is a hard design varying rapidly in astigmatism at wider eccentricities whereas design B is a soft design varying slowly in astigmatism. However, it should be noticed that these differences were always lower than the clinically significant difference 20 (i.e., 0.10 logMAR), meaning that the statistically significant differences in visual acuity could not be appreciated by the subjects.
In the same way, visual acuity differed by 0.03 +/- 0.03 logMAR between PAL A & B at eccentricity 0°. Even if the difference was found statistically significant, the difference is equal to the intra-individual standard deviation (0.03 logMAR) meaning that PAL A & B can be considered equivalent at this eccentricity.
Lens B was clearly preferred to lens A by 15 subjects (75% of the subjects). This result means that the quality of vision in the periphery of the lens seems to be a key factor when viewing through a progressive addition lens. This also suggests that the difference observed close to the near vision point of the lens is not so important compared to the difference occurring in the periphery. However, the relative importance of the periphery compared to the center may also be a consequence of the methodology. The goal of this experiment was not to compare lens A and B in real conditions of life but to test the ability of visual acuity measurement to differentiate the quality of vision in two progressive addition lenses. Subjects had their heads maintained. They must turn their eyes to view in the periphery of the lens, thus using a larger size of the lens than they would have if they turned their head, -12 to 12 mm of eccentricity corresponding to a visual field close to the angular size of the page of the newspaper (i.e., 50°). This may explain that lens B was preferred to lens A by a larger proportion of the population. Indeed, several subjects spontaneously reported the blur in the periphery of the newspaper when experimenting with lens A.
All of the 5 near vision lens wearers preferred PAL B. Subjects who preferred PAL A were all PAL wearers. The low number of subjects in the near vision lens wearer group do not permit to conclude on the role played by the typology of the lens wearer but it seems that experience of blurred vision may affect the level of sensitivity to blur.
An additional finding of the experiments is that even in the very controlled conditions with a bite bar that ensure that only the eyes can be moved while reading the newspaper page the lens intended to be worn by “eye movers” is appreciated by less subjects and to a lesser extent than the lens intended to be worn by “head movers”. As already said, the difference of astigmatism level between PAL A (i.e., dedicated to “eye movers”) and PAL B (i.e., dedicated to “head movers”) was the key factor in the newspaper experiment which is not the real conditions of use of a PAL. In real life, conditions are not as static as in the experiment and are rather dynamic, meaning that eye-head coordination and distortion induced by the design will have a significant impact. In this experiment, on the contrary we wanted to focus on image quality perception, thus removing the dynamic impact of distortion (often called “swimming effect”).
We can observe that lens A exhibits a larger level of astigmatism in the periphery involving a smaller preference for this lens. We think that subjects who chose lens A did not pay attention to these more peripheral parts of the lens. In intermediate periphery (i.e., 6 mm), lens B shows a larger level of astigmatism that may be considered as unacceptable by the ones who preferred lens A. To conclude, visual acuity and astigmatism are linked but the choice of the lens is probably mainly based on the area where the subjects pay attention. This area is subject dependent.
One can argue that the vertical refractive power change in the lenses could have influenced the results. However, PAL A & B do not differ significantly by their spherical equivalent power vertically nor horizontally but mainly by their level of astigmatism horizontally. Though both lenses may have a significant variation in power vertically due to the progression, the difference in the spherical equivalent power should not have played an important role in the choice of the subjects. Based on values of Table 1, we calculated the difference of spherical equivalent power between the same points of the two lenses for each eccentricity (i.e., between -12 mm to +12 mm corresponding to +/-24° eccentricity approximately similar to the newspaper angular size). On average the lenses differed by 0.06 D in terms of spherical equivalent power with a higher difference of 0.18 D.
On the contrary, the level of astigmatism had a real impact. Differences of visual acuity measured at each eccentricity between PAL A & B were correlated to differences of astigmatism (r²=0.75). PAL B had the least level of astigmatism explaining why it was mainly chosen by the subjects.
The main limitation of this study remains in the fact that the lenses were not used in the worn conditions for which they have been optimized. Indeed, as mentioned in table 3, in the experiments, the angular position of the lens in front of the eye was null to ensure a better control of the positioning of the lens compared to the eye pupil, whereas the lens was optimized for a standard pantoscopic angle of 10°. This has been compensated by using the recalculated power values for the exact position used in the experiment (see table 1). In a future experiment, it could be worth improving the positioning method to be closer to the condition of wear for which the lens has been optimized.
The objective was to find out whether visual acuity tests could distinguish two different ophthalmic optics in terms of induced astigmatism, and whether they could predict the preference gradation of the subjects. The level of preference (low, moderate, high) was analyzed against the mean difference of visual acuity between both PALs considering either the total eccentricities, or only the center or the periphery. Preference gradation (i.e., which lens was preferred and how much) is clearly not predicted by visual acuity measurement from the central area (figure 5B). Indeed, only 6 subjects (30%) had a choice and gradation preference associated with the visual acuity difference in the central part. The preference gradation seems better related to the acuity in the peripheral area. 80% of the choices are well predicted when considering visual acuity of the peripheral area (figure 5C). When considering all eccentricities, in only two thirds of the cases, the subject's preference was in accordance with the difference in visual acuity between the two lenses. However, the magnitude of the difference could not be closely predicted. If we remove subjects having meaningless differences in visual acuity, i.e., below or equal 0.05 logMAR, and with a high preference, or below or equal 0.02 logMAR, and with a moderate preference, the remaining acceptable accordance drop to 40% of the subjects with all eccentricities, 25% with the central area and 60% with the peripheral area.
Even under the controlled conditions of the study it was not possible to predict the amount of subjective appreciation well from the differences in visual acuity averaged over a horizontal line in the lenses through the near vision point.
To compare the global perception and visual acuity, we only considered the VA measured either in the center part (i.e., -6 mm to + 6 mm) or the peripheral part (i.e., -12 to -9 mm and +9 mm to +12 mm) or the total near vision field (i.e., -12 to +12 mm). Do more sophisticated ponderations across the lens could have optimized the link between VA and perception? Such an optimization may be confirmed by additional future experiments.
ConclusionHigh contrast Visual acuity was clearly able to differentiate the 2 lens designs tested in our experiment. However, even under the controlled conditions of this study, it was not possible to predict the quality of vision, as measured by a subjective appreciation, through progressive addition lenses at various eccentricities from the near vision with an addition of 2.0D. We may anticipate that the size of the field of view perceived as acceptable in the near vision of a progressive addition lens may then not be adequately evaluated. A recommendation of a design of progressive ophthalmic lens for a specific person should thus not be based on high contrast visual acuity measurements only.
Author 3 is an employee of Essilor. He was involved in the experiment design and writing of the paper. The study has been funded by Essilor International.
Authors 1 and 2 have no other conflicts of interest and have no proprietary interest in any of the materials mentioned in this article.
- Myopia progression in children during home confinement in the COVID-19 pandemic: A systematic review and meta-analysis
- Challenges and impact of COVID-19 lockdown on Indian optometry practice: A survey-based study
- Acute community ophthalmology services provided by independent prescribing optometrists supporting hospital eye services during the COVID-19 outbreak
- The impact of COVID-19 on global contact lens education
articles


www.publicationethics.org.


