


To analyse the asphericity of the anterior corneal surface (ACS) for different diameters, and correlate those values with corneal higher order aberrations (cHOA) before and after myopic treatments with corneal refractive therapy (CRT) for orthokeratology and customized (CL) and standard laser (SL) assisted in situ keratomileusis (LASIK).
SettingClínica Oftalmológica NovoVisión, Madrid, Spain.
MethodsThe right eyes of 81 patients (27 in each treatment group), with a mean age of 29.94±7.5 years, were analysed. Corneal videokeratographic data were used to obtain corneal asphericity (Q) for different corneal diameters from 3 to 8mm and cHOA root mean square (RMS) obtained from Zernike polynomials for a pupil diameter of 6mm.
ResultsThere were statistically significant differences in asphericity values calculated at different corneal diameters for different refractive treatments and their changes. The difference between asphericity at 3 and 8mm reference diameters showed statistically significant correlations with spherical-like cHOA that was also significantly increased after all procedures.
ConclusionsThe shift in corneal asphericity and the differences among different treatment techniques are more evident for the smaller reference diameters. These differences can be much reduced or even masked for a peripheral reference point at 4mm from centre, which is used by some corneal topographers.
Analizar la asfericidad de la superficie corneal anterior (SCA) para diferentes diámetros, y correlacionar dichos valores con las aberraciones corneales de alto orden (cHOA) antes y después de tratamientos miópicos con terapia refractiva corneal (TRC) para ortoqueratología y LASIK personalizado y estándar.
CentroClínica Oftalmológica NovoVisión, Madrid, España.
MétodosSe analizaron los ojos de 81 pacientes (27 en cada grupo de tratamiento), con una edad media de 29,94±7,5 años. Se utilizaron los datos videoqueratográficos para obtener la asfericidad corneal (Q) para diferentes diámetros corneales, de 3 a 8mm, y el error cuadrático medio de las cHOA caracterizadas mediante los polinomios de Zernike para un diámetro de pupila de 6mm.
ResultadosSe obtuvieron diferencias estadísticamente significativas en cuanto a los valores de asfericidad calculados con diferentes diámetros corneales para diferentes tratamientos refractivos y para sus cambios tras el tratamiento; asimismo la diferencia entre la asfericidad para los diámetros de referencia de 3 y 8mm mostró unas correlaciones estadísticamente significativas con las cHOA spherical-like, que experimentaron un incremento considerable con posterioridad a todas las intervenciones.
ConclusionesEl cambio en la asfericidad corneal y las diferencias entre las diferentes técnicas de tratamiento es más evidente para los diámetros de referencia más pequeños. Dichas diferencias pueden ser reducidas mucho más, e incluso enmascararse, para un punto de referencia periférico a 4mm de distancia del centro, el cual es utilizado por algunos topógrafos corneales.
Laser-assisted in situ keratomileusis (LASIK) and CRT for orthokeratology are two techniques that attempt a complete independence from conventional compensation as spectacles or traditional contact lenses in myopic patients.1–3 Both techniques use a similar principle to achieve myopia correction, flattening the anterior corneal surface (ACS), thus reducing the total power of the eye but they are substantially different in the way they produce such effect. LASIK removes stromal tissue while CRT does a redistribution of the corneal tissue. In both cases the peripheral cornea is supposed to remain unchanged.4
There is an increase in corneal asphericity, changing from its initially prolate shape (Q<0) to an oblate contour (Q>0), being flatter in the centre than in the paracentral zone surrounding the treatment area.1,5–8 However even if the ACS has been classically defined by a unique value of corneal asphericity, or two values corresponding to the orientations of the two principal meridians,9 corneal asphericity changes significantly depending on the peripheral reference points. An evidence of this is the different values of Q that can be obtained in the same individuals using different corneal topographers. In a previous study we have observed those differences in Q values for different reference diameters and the different shift of Q values from the more central to the more peripheral reference points according to the corneal astigmatism.10 It is also expected that these multi-aspheric concept of the cornea can also differ significantly depending on the corneal refractive treatment being performed.
With the development of techniques for measuring the optical quality of the eye, several studies have allowed a better knowledge of the optical quality of the corneal surface after LASIK3,11,12 or orthokeratology.13,14 Both refractive techniques significantly increase the ocular higher order aberrations,1 particularly third and fourth order aberrations.13,15,16
Alterations in corneal asphericity and the corresponding increase in optical aberrations have a significant impact not only in the quality of vision,17 but also on contrast sensitivity12,14 and other visual functions as night vision disturbances.3
Since the treatment zone varies according to treatment technique and the cornea's response to the different correction procedures,4,18 and because the cornea possesses different degrees of asphericity according to the corneal zone being analysed,10 it is important to study asphericity values for different corneal diameters in order to fully characterise this important property that defines the post-surgical corneal contour and evaluate its impact on the higher order aberrations induced as a consequence of such changes.19 Furthermore, Patel's analysis of the corneal shape within the apical zone of operated eyes and normal eyes suggests that the corneal contour would be better defined using different conic sections with different shape factors depending on the corneal region to be represented.20
Thus, the purpose of this study was to evaluate corneal asphericity for different corneal diameters after refractive treatments (CRT, LASIK SL and LASIK CL), as well as to correlate these values with corneal high order aberration (cHOA). To the best of our knowledge, this is the first report characterizing the multi-aspheric description of the cornea after surgical and non-surgical corneal refractive interventions for myopia correction.
Materials and methodsSubjects and inclusion criteriaThe clinical records of 81 patients submitted to corneal refractive therapy (CRT, n=27), standard LASIK (SL, n=27) and customized LASIK (CL, n=27) at the Clínica Oftalmológica Novovisión, (Madrid, Spain) have been retrospectively evaluated. Mean age was 29.94±7.5 years (ranging from 14 to 49), of which 50 were female (61.7%) and 31 were male (38.3%). Only patients with myopia between −0.75D and −4.25D and astigmatism below −1.75D were included in order to match the range of treatments more commonly used with CRT. No patient suffered from ocular disease or had been submitted to previous ocular surgery. Complete optometric and ophthalmological examinations were performed before surgical and non-surgical correction of myopia through the aforementioned techniques. A minimum of 3 months was required to guarantee that the topography was completely stable.21,22 After that, the patients should have demonstrated to be successfully treated with respect to residual refractive error (≤±0.50D), visual acuity (≥20/20 or higher uncorrected visual acuity), surface regularity and centring of the treatment zone (below 0.5mm of decentration) before being elected for this study. Another important inclusion criterion was that the videokeratoscope examinations had been performed between 4:00 and 8:00 P.M. to minimize the influence of diurnal variations in corneal thickness23 that might potentially influence anterior corneal topography.24
This study followed the tenets of the Declaration of Helsinki. Informed consent was obtained from all patients before all the interventions and they also gave their consent to treat their data anonymously for research purposes.
LASIK surgeryIn all cases the ablation was central, with an optic zone of 6.50mm for all LASIK treatments. A transition zone of 0.30mm for the spherical cases in the SL group and 1.25mm for astigmatic corrections and CL procedures was used.
Surgical routine for LASIK surgery was held according to international standards, and the commonly accepted criteria for refractive surgery procedures were observed with regards to predictability, efficacy and safety. After creating a 120μm, 9.5mm diameter flap with a Hansatome microkeratome (Chiron Vision, model 2765; Bausch & Lomb, Claremont, CA, USA), SL (Munnerlyn based) and CL (topography based) ablation profiles were produced using the Allegretto Wave Eye-Q – 400Hz – (Wavelight, Erlangen, Germany). All surgical procedures were uneventful and successful.
Corneal refractive therapy: lens characteristicsParagon CRT (paflufocon D, Dk=100 barrer) sigmoid reverse geometry rigid gas permeable lenses were used (Paragon Vision Sciences, Mesa, AZ, USA). Trial lenses were derived from sliding table monograms provided by the manufacturer and which have shown high levels of predictability in terms of first trial success.25 Fitting was evaluated according to the recommendations of the manufacturer regarding fluorescein pattern, topographical evaluation, refractive and visual outcomes.
Calculations of Q values and corneal monochromatic cHOA from corneal topographyTopographic data were obtained using the Atlas Mastervue videokeratoscope (Humphrey Zeiss Instruments, San Leandro, CA, USA). The corneal topographer was calibrated before data acquisition according to the manufacturer's recommendations. Corneal videokeratographic data were downloaded onto floppy disks in ASCII file format, which contained information about corneal elevation, curvature, power and position of the pupil.
The Q-value was calculated for different corneal chord diameters: 3.0mm (Q3), 4.0mm (Q4), 5.0mm (Q5), 6.0mm (Q6), 7.0mm (Q7) and 8.0mm (Q8) using the calculations feature of Vol-CT 6.89 software (Sarver & Associates, Inc., Carbondale, IL, USA).
cHOA were expressed as Zernike polynomials Z3−3 to Z66 which comprise front corneal surface aberrations up to the sixth order using the calculations modes of Vol-CT 6.89 software (Sarver & Associates, Inc., Carbondale, IL, USA) using as a reference point the centre of the pupil. Total cHOA root mean square (RMS) (including Zernike polynomials Z3−3, Z3−1, …, Z64, Z66) and RMS values for 3rd, 4th, 5th and 6th order, spherical-like aberrations (including Zernike polynomials Z40 and Z60), coma-like aberrations (including Zernike polynomials Z3−1, Z31, Z5−1 and Z51) were calculated. All aberrations were calculated for a pupil diameter of 6mm.
Statistical analysisThe SPSS software package v.16 (SPSS Inc., Chicago, IL, USA) was used for statistical analysis. Kolmogorov–Smirnov Test was applied in order to assess normality of data distribution. Kruskal–Wallis Test or ANOVA (Bonferroni post hoc test) for non-normally or normally distributed variables, respectively, was performed to evaluate whether statistically different values were present among the clinical groups of SL, CL and CRT. When normality could not be assumed, Wilcoxon Signed Ranks Test was used for paired comparison between techniques and Paired Samples Test was used when normality could be assumed for pair comparisons between treatments. Bivariate correlation analysis was used to evaluate potential correlations between differences in cHOA and Q for different corneal diameters. When normality could be not assumed, Spearman correlation was used; Pearson correlation was used when normality could be assumed. For statistical purposes, a p value lower than 0.05 was considered statistically significant.
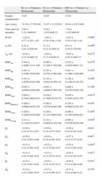
ResultsBaseline demographic characteristicTable 1 shows the pre-treatment demographic data for each group including mean values, standard deviation, maximum and minimum values. No statistically significant differences were found for the initial mean spherical equivalent refraction among the three clinical groups (p=0.998, Kruskal–Wallis Test).
Demographic characteristics (mean, S.D., maximum and minimum) of the population under evaluation before the treatment in each group: standard LASIK, custom LASIK and Corneal Refractive Therapy.
| SL (n=27)mean±SDmax/min | CL (n=27)mean±SDmax/min | CRT (n=27)mean±SDmax/min | p | |
| Gender (female/male) | 21/6 | 12/15 | 17/10 | |
| Age (years) | 32.30±5.7923/48 | 31.07±5.3325/43 | 26.44±9.6714/49 | |
| Time interval (months) | 5.04±2.313.00/9.63 | 5.28±1.833.00/8.23 | 3.79±1.423.00/8.93 | |
| M (D) | −2.82±0.77−4.25/−1.63 | −2.82±0.79−4.38/−1.50 | −2.82±0.78−4.38/−1.63 | 0.998¥ |
| J0 (D) | 0.23±0.41−0.65/0.88 | 0.11±0.22−0.25/0.74 | 0.15±0.29−0.47/0.86 | 0.406¥ |
| J45 (D) | −0.01±0.17−0.48/0.38 | −0.03±0.17−0.63/0.43 | −0.03±0.16−0.40/0.37 | 0.971¥ |
| RMS3rd | 0.342±0.2900.111/1.495 | 0.299±0.1220.172/0.599 | 0.322±0.2030.089/1.121 | 0.873¥ |
| RMS4th | 0.291±0.1200.152/0.683 | 0.255±0.0710.158/0.488 | 0.291±0.1560.124/0.899 | 0.392¥ |
| RMS5th | 0.143±0.2050.034/1.096 | 0.135±0.0810.014/0.314 | 0.128±0.1240.031/0.552 | 0.406¥ |
| RMS6th | 0.093±0.0990.020/0.480 | 0.091±0.0640.019/0.320 | 0.086±0.0730.019/0.340 | 0.748¥ |
| RMSTotal | 0.504±0.3540.280/2.033 | 0.438±0.1400.287/0.772 | 0.478±0.2630.255/1.576 | 0.931¥ |
| RMSSpherical | 0.204±0.0880.043/0.359 | 0.160±0.0730.044/0.288 | 0.216±0.0890.033/0.415 | 0.039* |
| RMSComa | 0.240±0.1690.035/0.690 | 0.258±0.1110.090/0.562 | 0.260±0.1550.055/0.643 | 0.369¥ |
| RMSS.Astg | 0.113±0.1340.011/0.677 | 0.112±0.0930.011/0.344 | 0.096±0.0750.027/0.349 | 0.954¥ |
| Q3 | −0.29±0.14−0.71/−0.07 | −0.29±0.14−0.57/−0.03 | −0.26±0.14−0.55/−0.01 | 0.661* |
| Q4 | −0.30±0.13−0.62/−0.06 | −0.30±0.14−0.59/−0.05 | −0.27±0.14−0.57/−0.03 | 0.667* |
| Q5 | −0.31±0.12−0.58/−0.05 | −0.32±0.13−0.58/−0.07 | −0.28±0.14−0.56/−0.04 | 0.484¥ |
| Q6 | −0.31±0.12−0.59/−0.05 | −0.33±0.13−0.57/−0.10 | −0.29±0.14−0.55/−0.07 | 0.447* |
| Q7 | −0.32±0.12−0.61/−0.05 | −0.35±0.12−0.55/−0.12 | −0.30±0.14−0.58/−0.09 | 0.354* |
| Q8 | −0.34±0.13−0.64/−0.05 | −0.37±0.13−0.59/−0.15 | −0.31±0.14−0.60/−0.12 | 0.279* |
SL, standard LASIK; CL, custom LASIK; CRT, corneal refractive therapy; RMS, root mean square higher order aberrations; Q, asphericity.
Fig. 1 shows the RMS values for higher order aberrations after treatment in the three groups. RMS values for 4th-order, 6th-order, total RMS, spherical aberration and coma were significantly different among the three groups, with CRT showing the higher values. There were no statistically significant differences between the three groups for the 3rd-order, 5th-order RMS and secondary astigmatism. Overall, there has been only difference in pair comparison CL vs CRT and SL vs CRT for 4th, total, spherical aberration (sph) and coma RMS.
. Significance values correspond to the comparison of the three clinical groups (Kruskal Wallis Test). Comparison of pair of treatments: θ for statistically significant differences between SL and CL; § for statistically significant differences between SL and CRT and δ for statistically significant differences between CL and CRT.")
HOA RMS for the three different groups after refractive interventions for a 6-mm pupil. Bars represent standard deviation (SD). Significance values correspond to the comparison of the three clinical groups (Kruskal Wallis Test). Comparison of pair of treatments: θ for statistically significant differences between SL and CL; § for statistically significant differences between SL and CRT and δ for statistically significant differences between CL and CRT.
The differences between pre and post-refractive surgery procedures and CRT are illustrated for cHOA RMS in Fig. 2. Statistically significant differences were found between the differences in the three techniques for fourth order aberrations (p<0.001, ANOVA), total RMS (p<0.001, Kruskal–Wallis Test), spherical-like RMS (p<0.001, ANOVA) and coma-like RMS (p=0.016, ANOVA). Conversely, no differences were found between the different techniques for third, fifth and sixth order aberrations, as well as for secondary astigmatism.
 for HOA in the three different groups after refractive interventions for a 6-mm pupil. Bars represent standard deviation (SD). Significance values correspond to the comparison of the three clinical groups (*ANOVA and ¥Kruskal Wallis Test). Comparison of pair of treatments: θ for statistically significant differences between SL and CL; § for statistically significant differences between SL and CRT and δ for statistically significant differences between CL and CRT.")
Differences in values of RMS (post–pre) for HOA in the three different groups after refractive interventions for a 6-mm pupil. Bars represent standard deviation (SD). Significance values correspond to the comparison of the three clinical groups (*ANOVA and ¥Kruskal Wallis Test). Comparison of pair of treatments: θ for statistically significant differences between SL and CL; § for statistically significant differences between SL and CRT and δ for statistically significant differences between CL and CRT.
Fig. 3 shows the post-surgical values of Q at different corneal diameters. Post-surgical Q values were statistically different between these three treatments with most positive values being found for CRT. We also separately compared SL with CL and found no statistically significant differences between them, either in the calculation of post-treatment aberrations (p>0.093, t-test) or for the Q values for different diameters (p>0.117, Mann–Whitney Test). In comparison pair-by-pair, only for 8mm diameter no statistical significant differences were found.
. Significance values correspond to the comparison of the three clinical groups (Kruskal Wallis Test). Comparison of pair of treatments: θ for statistically significant differences between SL and CL; § for statistically significant differences between SL and CRT and δ for statistically significant differences between CL and CRT.")
Asphericity at different corneal diameters after refractive interventions. Bars represent standard deviation (SD). Significance values correspond to the comparison of the three clinical groups (Kruskal Wallis Test). Comparison of pair of treatments: θ for statistically significant differences between SL and CL; § for statistically significant differences between SL and CRT and δ for statistically significant differences between CL and CRT.
The differences between pre and post-refractive surgery procedures and CRT are illustrated for Q at different corneal diameters in Fig. 4. The differences in Q after the intervention at different corneal diameters were statistically significant among the clinical groups, except for the asphericity obtained at 8mm.
 at different corneal diameters after refractive interventions. Bars represent standard deviation (SD). Significance values correspond to the comparison of the three clinical groups (*ANOVA and ¥Kruskal Wallis Test). Comparison of pair of treatments: θ for statistically significant differences between SL and CL; § for statistically significant differences between SL and CRT and δ for statistically significant differences between CL and CRT.")
Differences in values of asphericity (post–pre) at different corneal diameters after refractive interventions. Bars represent standard deviation (SD). Significance values correspond to the comparison of the three clinical groups (*ANOVA and ¥Kruskal Wallis Test). Comparison of pair of treatments: θ for statistically significant differences between SL and CL; § for statistically significant differences between SL and CRT and δ for statistically significant differences between CL and CRT.
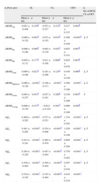
Table 2 shows mean values, standard deviation and the value of statistical significance for differences (post–pre) in cHOA and corneal Q after SL, CL and CRT treatments. In all three cases we can observe the increase in values of cHOA being statistically significant in the three interventions for the values of fourth order RMS and spherical-like aberrations. For the CRT technique statistically significant differences were found for all aberrations after treatment. Statistically significant differences were also found for corneal Q for all diameters analysed. No significant differences were found between SL and CL regarding cHOA RMS (p>0.287, t-test) or Q values for different diameters (p>0.164, t-test). The changes in Q value depending on the diameter where the values are obtained are different depending on the procedure being considered (LASIK or CRT). Differences between Q3 and Q8 values were lower for refractive surgery procedures (0.5–0.6 for Q3 to 0.3 for Q8), than for CRT treatment group (1.15 for Q3 to 0.45 for Q8). CRT creates smaller treatment zones, more abrupt changes of curvature at the edge of the treatment zone (at the transition zone) and somewhat flattening outside the transition zone.
Differences between alterations in HOA and asphericity for different diameters (post-minus pre-intervention) after each refractive intervention and their statistical significance (values of RMS are expressed in microns).
| Δ (Post–pre) | SL | CL | CRT | §-SLvsCRTδ-CLvsCRT | |||
| Mean±SD | p | Mean±SD | p | Mean±SD | p | ||
| ΔRMS3rd | 0.051±0.404 | 0.156¥ | 0.073±0.237 | 0.212¥ | 0.217±0.337 | 0.002¥ | |
| ΔRMS4th | 0.090±0.152 | 0.001¥ | 0.073±0.155 | 0.014¥ | 0.368±0.189 | <0.001¥ | §, δ |
| ΔRMS5th | 0.006±0.246 | 0.068¥ | 0.003±0.139 | 0.923¥ | 0.052±0.141 | 0.007¥ | |
| ΔRMS6th | 0.005±0.111 | 0.171¥ | 0.011±0.108 | 0.866¥ | 0.045±0.076 | 0.003¥ | |
| ΔRMSTotal | 0.099±0.448 | 0.021¥ | 0.101±0.296 | 0.124¥ | 0.439±0.330 | 0.000¥ | §, δ |
| ΔRMSSpherical | 0.098±0.126 | <0.001* | 0.108±0.113 | <0.001* | 0.369±0.166 | <0.001* | §, δ |
| ΔRMSComa | 0.094±0.257 | 0.041¥ | 0.037±0.181 | 0.280¥ | 0.236±0.308 | 0.001¥ | δ |
| ΔRMSS.Astg | 0.009±0.170 | 0.337¥ | −0.012±0.124 | 0.581¥ | 0.080±0.166 | 0.020¥ | |
| ΔQ3 | 0.469±0.282 | <0.001* | 0.573±0.521 | <0.001¥ | 1.154±0.385 | <0.001* | §, δ |
| ΔQ4 | 0.441±0.265 | <0.001* | 0.534±0.498 | <0.001¥ | 1.029±0.349 | <0.001* | §, δ |
| ΔQ5 | 0.414±0.241 | <0.001* | 0.494±0.470 | <0.001¥ | 0.895±0.304 | <0.001* | §, δ |
| ΔQ6 | 0.384±0.220 | <0.001* | 0.447±0.444 | <0.001¥ | 0.750±0.263 | <0.001* | §, δ |
| ΔQ7 | 0.350±0.202 | <0.001* | 0.394±0.420 | <0.001¥ | 0.597±0.234 | <0.001* | §, δ |
| ΔQ8 | 0.316±0.192 | <0.001* | 0.335±0.404 | <0.001¥ | 0.443±0.219 | <0.001* | |
SL, standard LASIK; CL, custom LASIK; CRT, corneal refractive therapy; RMS, root mean square higher order aberrations; Q, asphericity.
Comparison of pair of treatments: CL and SL no statistically significant differences for any parameter; § for statistically significant differences between SL and CRT and δ for statistically significant differences between CL and CRT.
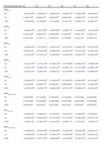
Table 3 shows the correlations and statistical significance for differences in aberrations and in Q for different diameters. As expected, the strongest correlations between the values of aberrations and Q were found in the values of spherical-like aberration, with a positive correlation between the alterations in Q (post-treatment minus pre-treatment) and those in spherical-like aberration (which becomes more positive after the intervention). These correlations are statistically significant for all diameters studied and for the three techniques and greatest for those diameters within the ablation zones (SL for 5mm diameter, r=0.776, p<0.001; CL 6mm diameter, r=0.853, p<0.001; CRT 5mm diameter, r=0.627, p<0.001). Fig. 5 presents those correlations for spherical-like aberration, the one with the strongest correlation.
Correlation analysis and statistical significance between differences in cHOA (for three techniques) and differences in asphericity (post minus pre-intervention) for different corneal diameters.
| Correlation/significance | Q3 | Q4 | Q5 | Q6 | Q7 | Q8 |
| RMS3rd | ||||||
| SL | −0.4430.020¥ | −0.4680.014¥ | −0.4640.015¥ | −0.4560.017¥ | −0.4280.026¥ | −0.3960.041¥ |
| CL | 0.1260.530¥ | 0.0850.673¥ | 0.0360.858¥ | 0.0020.992¥ | −0.0660.745¥ | −0.1220.546¥ |
| CRT | −0.3240.099* | −0.3350.087* | −0.3310.092* | −0.3220.102* | −0.2950.135* | −0.2620.187* |
| RMS4th | ||||||
| SL | −0.0160.935¥ | −0.0510.802¥ | −0.0500.805¥ | −0.0680.737¥ | −0.1040.605¥ | −0.1030.609¥ |
| CL | 0.4330.024¥ | 0.4040.037¥ | 0.3620.064¥ | 0.3420.081¥ | 0.2840.152¥ | 0.2490.211¥ |
| CRT | 0.3020.126* | 0.3120.113* | 0.3200.103* | 0.3270.096* | 0.3210.103* | 0.2890.143* |
| RMS5th | ||||||
| SL | −0.4480.019¥ | −0.4730.013¥ | −0.4670.014¥ | −0.4720.013¥ | −0.4480.019¥ | −0.4270.026¥ |
| CL | 0.0220.915¥ | −0.0280.888¥ | −0.0990.624¥ | −0.1260.532¥ | −0.1910.339¥ | −0.2450.218¥ |
| CRT | −0.2220.265¥ | −0.3130.112¥ | −0.3400.083¥ | −0.4100.033¥ | −0.4040.037¥ | −0.4200.029¥ |
| RMS6th | ||||||
| SL | −0.2720.170¥ | −0.3170.107¥ | −0.3180.107¥ | −0.3570.068¥ | −0.3960.041¥ | −0.3990.039¥ |
| CL | −0.2180.275¥ | −0.2460.215¥ | −0.2730.167¥ | −0.2940.137¥ | −0.3150.109¥ | −0.3000.129¥ |
| CRT | −0.2610.189* | −0.2850.149* | −0.3040.123* | −0.3320.090* | −0.3580.067* | −0.3880.045* |
| RMSTotal | ||||||
| SL | −0.3480.075¥ | −0.3780.052¥ | −0.3700.057¥ | −0.3740.055¥ | −0.3640.062¥ | −0.3370.085¥ |
| CL | 0.1250.536¥ | 0.0840.677¥ | 0.0300.881¥ | 0.0000.999¥ | −0.0750.710¥ | −0.1200.552¥ |
| CRT | −0.0450.825¥ | −0.0590.770¥ | −0.0600.766¥ | −0.0750.712¥ | −0.0820.683¥ | −0.1020.613¥ |
| RMSSpherical-like | ||||||
| SL | 0.7590.000* | 0.7710.000* | 0.7760.000* | 0.7720.000* | 0.7450.000* | 0.6940.000* |
| CL | 0.7810.000¥ | 0.8100.000¥ | 0.8460.000¥ | 0.8530.000¥ | 0.8400.000¥ | 0.7860.000¥ |
| CRT | 0.5940.001* | 0.6220.001* | 0.6270.000* | 0.6230.001* | 0.5850.001* | 0.5050.007* |
| RMComa-like | ||||||
| SL | −0.4610.016* | −0.4800.011* | −0.4700.013* | −0.4610.015* | −0.4290.025* | −0.3650.061* |
| CL | −0.0560.782¥ | −0.0840.677¥ | −0.1330.508¥ | −0.1710.394¥ | −0.2290.250¥ | −0.2670.178¥ |
| CRT | −0.1990.320* | −0.2160.279* | −0.2120.288* | −0.2000.317* | −0.1720.391* | −0.1280.523* |
| RMSAstigmatism | ||||||
| SL | −0.4160.031¥ | −0.4470.020¥ | −0.4270.026¥ | −0.4350.023¥ | −0.4190.029¥ | −0.4150.031¥ |
| CL | −0.1000.618¥ | −0.1420.479¥ | −0.1920.337¥ | −0.2200.269¥ | −0.2670.178¥ | −0.2830.152¥ |
| CRT | −0.0250.901¥ | −0.0770.704¥ | −0.0860.668¥ | −0.1670.405¥ | −0.1580.431¥ | −0.1810.367¥ |
SL, standard LASIK; CL, custom LASIK; CRT, corneal refractive therapy; RMS, root mean square higher order aberrations; Q, asphericity.
 and differences in asphericity for different corneal diameters. Filled circles for SL (full line), open triangle for CL (hatched line) and open squares for CRT (line point and trace).")
The analysis of corneal Q for different diameters and its alterations as a consequence of surgical and non-surgical procedures for visual compensation allows us to obtain a more complete description of post-LASIK and post-CRT corneal contour, as well as to better differentiate how each of these strategies for myopia compensation works. The authors have recently shown that in normal corneas, Q becomes more negative as it is more peripherally analysed, especially for more astigmatic corneas.10 However, the differences for normal corneas are small varying from −0.10 to −0.20 for corneas with astigmatism below 3 diopters and from −0.15 to −0.35 for those with astigmatism over 3 diopters. These values refer to Q calculations computed from 3mm (Q3) and 7mm (Q7) reference diameters. This demonstrates that even for the normal, non-treated cornea, a single value of corneal asphericity cannot suffice to accurately describe the corneal topography.
After the interventions evaluated in this study the cornea presents positive Q values, and these values become lower as the reference point for calculation moves towards periphery. In the case of refractive surgery, for an 8mm diameter (Q8), Q even becomes negative, whereas for ortokeratology it remains positive. However, it comes to attention that the differences are much larger for corneas that have undergone ortokeratology with alterations in the value of Q from 0.9 for Q3 to 0.17 for Q8. These results reveal another interesting phenomenon, which is the fact that post-treatment outcomes of Q vary considerably according to the corneal zone analysed for the different treatments. In clinical terms a given instrument (videokeratoscope) can apparently indicate a post-surgical prolate shape if takes the reference point more towards periphery and other could show an oblate shape if considering a more central reference point. This can also limit our ability to identify difference in the outcomes of different refractive treatments; for example, for a corneal topographer considering the peripheral zones at 4mm (equivalent to the Q8 in this study, differences in Q will be masked showing no statistical significant differences among treatments). Conversely, the differences are maximized as we go closer to the centre of the treatment zone (i.e. Q3). Therefore, this multi-aspheric analysis of Q allows us to obtain more representative and “unbiased” information about post-treatment corneal Q-value irrespective of the instrument used to obtain the measurements. In a certain way it will act as a normalization procedure.
As far as current knowledge is concerned, no studies are known that simultaneously analyse the effects caused by standard LASIK surgery, by customized LASIK surgery and by orthokeratology on cHOA and corneal asphericity (Q). The results of the present work allow us to characterize the changes in cHOA and asphericity confirming that different treatments have a significantly different impact on these descriptors of corneal shape and optical properties. One of the purposes of this study was the analysis of the optical quality of the corneal front surface among these three techniques, an effort was made to ensure that baseline values of refractive error were comparable for the different groups, since several studies have reported increases of high order aberrations according to the amount of refractive error.13,26,27
As seen on the results (Fig. 1), in the post-treatment we found higher increase of high order aberrations in CRT compared to LASIK surgery. Corneal Q also changed for all three techniques from the initially prolate shape to positive values (oblate shape). The alterations in corneal Q after the treatments represent an important impact on HOA and especially on spherical-like aberrations and, therefore, on the optical function of the eye14,28,29 and its visual experience as spherical aberration is one of the most relevant optical errors influencing on the degradation of the image quality.30,31
Similar results were found by Anera et al., who analyzed mean values of corneal Q for 24 eyes submitted to LASIK surgery. In their study they found an initial Q of −0.12 changing to a mean value of +0.41 3 months after surgery.6 The study recently published by Anera et al., in which they analyse the differences between LASIK and CRT with pupil values of 5mm, for values of refractive error, age and number of eyes similar to ours, they have found increases in third, fourth and fifth order aberrations, for both emmetropization processes, with these increases being higher for CRT. In the same study the Q values found were higher after CRT (+0.45±0.42) than after LASIK (+0.13±0.12). This is in agreement with the results of the present study, although those authors have not performed the analysis for different Q zones.14
Our results show that spherical-like aberrations are those which suffer the highest increase after the treatments (fourth order and spherical-like aberrations). This is not surprising considering the limitations in pre-treatment astigmatism, thus reducing the potential increase in secondary astigmatism and other aberrations, and the requirement of well centred treatments thus reducing the amount of coma-like aberration. However, the values of coma-like aberrations were higher for CRT cases, which agrees with the fact that for this therapy there is a certain degree of decentring compared with LASIK being responsible for such aberration.22 An alternative explanation for this difference could be found on potentially different reference points for both treatments. However, in our study, both LASIK and CRT treatments were intended to be centred on pupillary area and VolCT analysed the HOA with reference to pupil centre as well, thus equalizing this potential source of error among treatments. Both spherical-like and coma-like aberrations are those which produce a larger deterioration in the optical quality of the eye, whereas aberrations of a higher order (5th, 6th and above) exert a lesser influence on vision.30,31 The increase in spherical-like aberrations and the changes in Q are related by the different topographical profiles created after each intervention (smaller optical zone and higher corneal steepening at the edge of the optical zone for CRT compared to LASIK procedures).4 From our analysis, the higher correlations between spherical-like aberration and Q values obtained for different diameters were found for Q5, Q6 and Q7. This might be expected considering that the spherical-like aberration has been obtained for a 6mm diameter zone.
One of the limitations of this study was to have obtained corneal aberrations only before and after the treatments, and not having measured total optical aberrations of the eye. As is commonly known, total aberrations are the result of the combination of corneal and internal aberrations.32,33 However, it is to be expected that the alterations observed in total aberrations of the eye follow the same pattern than those observed on the ACS, where the largest aberrations occur, and such was demonstrated by Anera et al.’s14 recent study both for refractive LASIK surgery and CRT. In this study Q values obtained in each corneal location were averaged among individuals. As stated by de Ortueta and Arba-Mosquera, using simple arithmetic's to average asphericity of different individuals might present some limitations. The authors propose a mathematical methodology to compute Q values in order to provide a more consistent result of the average asphericity from different individual corneas.34 Moreover, both Q values and cHOA are obtained from the same data, thus must reflect similar changes as the present study shows. However, we still believe that there is a rationale to explore both of them. Q values show the mathematical representation of shape changes and are used in clinical practice quite frequently. Thus, it is important to highlight how they can vary depending on the area being analysed, particularly after reshaping procedures. This fact is even more critical after orthokeratology given the larger changes between Q3 and Q8. At the same time, cHOA provide an insight on the optical quality of the surface and provide information about the visual quality after these procedures. Another limitation of the present study is the potential decentration between the treated areas which are targeted regarding the pupil centre and the aberration analysis carried out with reference to the corneal centre as analysed by the corneal topographer. As reported by other authors, this differences can have an impact on comatic aberrations.35
The new concept of multi-asphericity for the ACS has been applied in defining the normal cornea by the authors10 and has now been applied to the modified corneas by means of different refractive procedures, surgical and non-surgical. Its results have different implications; a unique value of asphericity might confound the results of different refractive treatments whereas a more complex determination of asphericity at different diameters can elucidate significant differences in the behaviour of those treatments, and other field of application could be the definition of the functional optical zone of the cornea previously defined by others as the zone where the corneal curvature will vary only within a narrow interval of power.36 Finally, the multi-aspheric modelisation of the human cornea (before and after refractive interventions) will help to design optical devices that mimic the natural aspheric nature of the cornea for example with the purpose of fitting contact lenses or to develop optical devices that compensate or reinforce a certain desirable refractive pattern for the whole eye from the asphericity pattern of the ACS.
The present results show that there is deterioration in terms of multi-aspheric description of the ACS compared to the pre-treatment situation. Although the present study does not report data on the total wavefront aberration, it is expected that those changes reported here will be closely related to a degradation of the optical quality of the eye.14 That same deterioration found by Anera et al.14 was larger for the CRT group than for LASIK surgery which agrees with our results; in addition we have shown absence of significant differences between standard LASIK surgery and customized LASIK surgery regarding multi-aspheric corneal shape description after the interventions and the inherent aberrations generated.
In summary, literature reports values of corneal asphericity in normal populations that range from −0.01 to −0.80.37–40 Indeed, as shown here, both in normal but above all, in corneas altered by refractive procedures, the same instrument might report values of asphericity completely different.
Conflicts of interestThe authors have no conflicts of interest to declare.
This work was supported by a grant from the Science and Technology Foundation (FCT) of Ministry of Science and Superior Education (MCES) (European Social Funding) under contract BD/61768/2009 granted to Dr. António Queirós. The authors have no proprietary interest in any of the instruments or materials mentioned in this article.


