


This study aims to compare eye movements monitored with an eye tracker during two visuo-verbal tests for assessing ocular motility. The study explores the potential of digital assessment and eye tracking technology in enhancing the understanding of ocular motility during these tests.
Methods47 healthy participants were included (20 males, 27 females), with a mean age of 21.34±1.77 years. The participants underwent optometric examinations to ensure visual health and exclude any dysfunctions or pathologies. The experimental protocol involved the digitized versions of the DEM and King-Devick tests, monitored with an eye tracker.
ResultsThe vertical subtests of DEM test showed fewer saccades, longer fixation durations, smaller saccade amplitudes, and slower saccade speeds compared to the horizontal subtest. The King-Devick test exhibited comparable fixation and saccade numbers, while fixation duration slightly increased with test difficulty. Statistically significant differences were found between the tests, but a positive correlation was observed.
ConclusionsStatistically significant differences were observed between the DEM and King-Devick tests, indicating that they measure similar aspects but are not interchangeable. The DEM test offers more comprehensive information with vertical saccade assessment. Test duration correlates positively with saccade and fixation count, fixation duration, and saccade speed.
Assessing ocular motility is crucial for evaluating visual function in children and patients with brain damage. The Developmental Eye Movement (DEM) and King-Devick (KD) tests are simple psychometric methods used to evaluate eye movement.1,2 These visual-verbal tests consist of identifying and naming single-digit numbers with irregular spacing and are commonly employed in optometric practices, providing an easy, practical, and cost-effective way to indirectly evaluate the eye movements involved in reading processes. They are valuable for assessing oculo-motor function in diagnostic evaluations and monitoring progress during treatment. Some studies suggest that the DEM test with irregular spacing between digits is more effective in identifying individuals with reading difficulties compared to tasks involving a single line or regular spacing between stimuli.3-5
The DEM test and the KD test primarily assess saccadic movements. These movements are responsible for bringing the object of interest to the fovea and are closely related to the reading process. Saccades are rapid, conjugated movements, reaching speeds of up to 500° per second, and have a short duration of less than 100 ms.6 They enable the transition from one fixation point to another. Saccadic movements are ballistic, meaning that once initiated, their trajectory cannot be altered, and a new saccade is required to correct any errors. In the reading process, visual information processing occurs during fixations, and saccades facilitate progression to the next fixation point, from left to right on the same line and from right to left to go to the next line (return sweeps).5-7
It is important to note that ocular motility is not evaluated in isolation from these tests, as cognitive factors such as motivation, cognition, attention, and verbalization can influence the results.4 While other observational tests like the Northeastern State University College of Optometry oculomotor (NSUCO) test do not involve this cognitive component, they heavily rely on the observer's experience.8
Both the DEM and KD tests present numbers arranged with irregular spacing, mimicking the saccadic demands encountered during reading. However, the DEM test includes two subtests where the numbers must be read vertically, aiming to differentiate whether poor performance is due to eye movements, the number naming process, or both.4 Although initially these tests were designed to assess motility in children, both tests have been found to have validity as concussion-screening tools and as part of a multifactorial assessment, particularly in the case of the KD.9 To address the limitations of the DEM test, Gené-Sampedro et al.10 developed an adult version since the test's data were primarily obtained from a child population. Furthermore, these tests have been utilised to investigate ocular motility and reading performance in children with learning disabilities and developmental disorders such as dyslexia and developmental coordination disorder, and have been compared to children with neurotypical development.11,12
Originally, these tests were developed to evaluate ocular motility without utilising eye tracker technology. However, a digital version of the KD test controlled by an eye tracker has recently been introduced to the market.13
The performance of these tests can be influenced by various factors such as the quality of eye movements, attention, language, and other cognitive abilities. Consequently, these tests have been utilised in different investigations involving patients with neurological conditions including multiple sclerosis, Alzheimer's, Parkinson's, and sports-related concussions.14-16
On the other hand, an eye tracker can determine the direction of gaze by analysing the position of the corneal reflection of infrared light in relation to the pupil, providing objective measurements.17 This device allows the characterisation of eye movements during reading or other visual activities. Some studies have used eye trackers to analyse eye movements during these tests.5,13,18,19 To our knowledge, this study is the first to compare the performance of both tests digitally and monitored with an eye tracker.
This study is designed to systematically address two principal objectives: firstly, to objectively characterise ocular motility by employing eye-tracking technology during the execution of the DEM and KD tests in young healthy individuals; and secondly, to assess the level of agreement between these tests based on eye-tracking metrics. This dual focus not only enhances our understanding of the efficacy of eye trackers but also contributes significantly to the field of ocular motility assessment test.
MethodsThe present study employed a prospective research design to examine the association between the digital versions of the DEM and KD tests. A total of 47 healthy participants were included; 20 were males, and 27 were females, with a mean age of 21.34±1.77 years. The study was approved by the Comité de Ética de la Investigación de la Comunidad de Aragón (CEICA) with reference PI21-074, and it adhered to the principles outlined in the Declaration of Helsinki. Informed consent was obtained from all participants on the day of the test.
Participants were selected based on the following criteria: age between 18 and 30 years, monocular best corrected visual acuity (BCVA) equal to or better than 0.1 logMAR (6/8 on the Snellen chart), absence of pathology, previous eye surgery, or binocular or accommodative dysfunctions. To exclude individuals with symptoms, participants completed the Symptom Questionnaire for Visual Dysfunctions.20 Additionally, a complete optometric examination was conducted to ensure the absence of binocular vision or accommodative dysfunctions, as well as ocular pathologies.
Experimental protocolThe optometric protocol included the following tests: measurement of monocular BCVA, assessment of heterophoria using the cover test and prism bar, the Northeastern State University College of Optometry (NSUCO) test to evaluate subjective pursuits, saccades, and fixations, near point of convergence, the Worth test to confirm the presence or absence of simultaneous vision, stereopsis measurement using the Randot Stereo Acuity Test (Stereo Optical Company, Chicago, IL, USA), measurement of positive and negative fusional vergence in near and far vision, and assessment of accommodative (+/−2.00 D) and vergence (3∆ base-in/12∆ base-out) facility in near vision. Once binocular vision dysfunctions or ocular pathologies were ruled out, the volunteers completed one trial of digitized versions of the DEM and KD tests, monitored with an eye tracker. It was decided to perform the test only once to avoid participant fatigue. The eye tracking device used was the Tobii Pro Fusion eye tracker (Tobii AB, Danderyd, Sweden). The eye tracker was positioned just below a 23-inch screen located inside a cabinet with neutral grey-colored walls. The screen was illuminated with cool white LEDs (6670 K correlated color temperature) to achieve controlled lighting conditions, resulting in a lighting level of 945.65 lx on the monitor surface. The eye tracker recorded data binocularly at a sampling rate of 250 Hz with a spatial precision of approximately 0.5°.
Both tests were digitized and calibrated for a visual acuity of 0.1 logMAR and participants were positioned with their head in a chin rest 60 cm away from the screen to minimize head movement and improve measurement accuracy. The tests were conducted binocularly, and participants wore their habitual refraction for distance vision. The eye tracker device was selected and characterized using the eye tracker Manager program (Tobii AB, Danderyd, Sweden), and eye movement calibration and both tests were performed for each participant using the Tobii Pro Lab program (Tobii AB, Danderyd, Sweden).
Prior to each test, participants received instructions on how to perform the task, emphasizing the need to read the numbers on each slide as quickly and accurately as possible. To minimize bias, participants were randomly assigned to either start with the DEM or KD test.
Developmental eye movement test (DEM)The DEM test consists of a pretest and three test cards. The pretest determines the participant's ability to undertake the test. Cards A and B present 40 single-digit numbers arranged vertically in two columns, while card C contains 80 numbers placed horizontally in 16 rows with varying distances between them. Participants are required to read the numbers as quickly and accurately as possible, and the time taken to complete each card is recorded. The vertical time is obtained by summing the time taken for subtests A and B, while the adjusted horizontal time considers the time for subtest C, as well as errors (substitutions, omissions, additions, and transpositions). The ratio is calculated by dividing the adjusted horizontal time by the vertical time. A higher ratio suggests that naming numbers in the horizontal subtest is more challenging than in the vertical subtest, indicating a diagnosis of oculomotor dysfunction. In such cases, optometric vision therapy would be recommended. The vertical subtest's prolonged time suggests difficulty in rapidly naming numbers (rapid automated naming). The test is standardized for children aged 6 to 13, and four clinical response types have been identified: Type I, Type II, Type III, and Type IV. The vertical subtest predominantly assesses automatic visual-verbal naming skills (automaticity), allowing differentiation between automaticity problems and ocular motility dysfunctions.4
While some authors have indicated that the DEM test is valid for evaluating ocular motility,1,21; particularly saccadic movements, others have questioned its ability to isolate saccadic movements due to the involvement of different verbal and visual processing abilities.22,23 Several studies have found a relationship between reading ability and DEM test results, but the standard parameters offered by the test (vertical time, adjusted horizontal time, ratio, and number of errors) do not seem to be directly related to ocular motility.22,24 Regarding reliability, Facchin and Maffioletti25 found high reliability with excellent values for vertical and adjusted horizontal time, medium-to-high for the ratio, and medium for errors. However, other researchers, such as Orlansky et al.,23 have presented findings that are somewhat less conclusive, reporting inconsistencies in the reliability of these measures, especially for the measures of the ratio and the errors.
The conventional DEM test, rather than the adult version, was employed to facilitate comparison with the KD test results.
King Devick testThe KD test comprises a demo card and three test cards, which progressively increase in difficulty. Participants are instructed to verbally read the numbers from left to right as quickly and accurately as possible. The time required to complete each of the three subtests and the number of errors are registered. Each card consists of 40 numbers arranged in 8 rows of 5 numbers, with the difficulty increasing by manipulating the spacing between numbers and lines. The demo card serves as a task demonstration and includes lines connecting each number, including oblique lines connecting the end of one row to the beginning of the next (regression). Subtest I only includes horizontal lines joining the numbers within each row. Subtest II and subtest III cards do not have lines connecting the numbers. The spacing between text lines is smaller in the subtest III card, making the task more challenging. The time taken to read all three cards, along with the number of errors, was recorded.26
The KD test has been well-validated and is frequently used as a sensitive measure of performance for detecting concussions. Studies have demonstrated that completion times on the test increase after a concussion.27,28
A digital version of the KD test guided by an eye tracker is currently available, offering additional parameters not provided by the conventional version, including the number of saccades, maximum saccade speed, number of fixations, fixation duration, number of blinks, average fixation polyarea, and average saccade velocity. However, a digitized version of the standard KD test was employed, ensuring its execution under identical conditions to the DEM test for a meaningful comparison of results.13
Data collectionThe data were obtained from the Tobii Pro Lab software and time intervals (“events”) were delimited for each of the subtests in both tests (DEM and KD) and for each participant. These events corresponded to the period between the fixation before starting the subtest and immediately after finishing it. Each subject subtest was exported separately to Excel (Microsoft Office Excel 2011, Microsoft Corporation, Redmond, WA, USA). A custom-made in-house program called Etracker Parse (University of Zaragoza, Zaragoza, Spain) was created to analyse the parameters of interest: each subtest duration (s), number (n) and mean duration (s) of saccades and fixations, saccadic length (mm) and saccadic speed (m/s) of the RE and LE separately and the mean. Only time was used as an indicator of performance because no errors were made by the subjects. In order to compare both tests, the set of data from subtests II and III (40 + 40 numbers) of the K-D test was established as equivalent to subtest C (80 numbers) of the DEM.
Statistical analysisAll the data were exported to Excel to a more manageable database to carry out the statistical analysis in the IBM SPSS Statistics 25.0 (IBM Corp., Somers, New York, USA) software. Descriptive statistics of the sample were performed according to the quantitative variables specified in the previous section for each subtest, calculating the mean, standard deviation, maximum and minimum.
The normality of distributions was tested with the Shapiro–Wilk test. Wilcoxon signed-rank test was used to compare both methods for related samples. To measure the relationship between variables, the Spearman correlation coefficient was used. A p-value < 0.05 was considered statistically significant.
Bland and Altman plots were used to assess agreement; all of the procedures were represented by displaying the differences between the measurements of the two methods against the mean of the two measurements.29
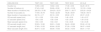
ResultsA total of 47 healthy subjects (20 males and 27 females), ranging in age from 18 to 27 years (mean age: 21.34±1.77), were recruited for the study. Descriptive statistics for various parameters of the DEM test are presented in Table 1, including the duration of each subtest, number of fixations, mean duration of fixations, number of saccades, mean duration of saccades, as well as the speed and amplitude of saccades for each eye individually and their average.
Mean and standard deviation (± SD) obtained from the evaluation of the DEM test with eye tracker. Abbreviations: RE: right eye; LE: left eye.
Note: The digits for subtests A and B should be read vertically and subtest C horizontally.
It can be observed in Table 1 that the sum of the saccades number of the vertical subtests is lower (104.38) than that performed during the horizontal subtest (189.62). The duration of fixations is notably longer in the vertical subtests (496.73±180.09, 491.70±159.55) compared to the horizontal subtest (243.88±47.025), nearly doubling the duration The saccades performed in the vertical subtests (32.38±15.74, 34.74±21.35) have a smaller amplitude than the horizontal ones (42.07±15.73) due to the arrangement of the digits in the vertical and horizontal cards of the test. On the other hand, the speed of the saccades of the vertical subtests (0.91±0.29, 0.93±0.,36) is lower than that of the horizontal subtest (1.27±0.33).
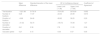
Table 2 shows the mean and standard deviation of the parameters obtained during the KD test. In order to be able to compare the DEM subtest C (80 numbers) and the KD test, the values of subtests II and III of the KD test (40+40 numbers) were added. The values of duration, number of fixations, number of saccades, and the mean duration of the fixations were performed, as well as the speed, duration, and amplitude of the saccades of both tests, thus comparing the verbalization of 80 digits in both cases.
Mean and standard deviation (± SD) obtained from the evaluation of the KD test with the eye tracker. Abbreviations: RE: right eye; LE: left eye.
Note: The digits for all subtests should be read horizontally.
In the case of the KD test (Table 2), we observed a comparable number of fixations and saccades across all three subtests (57.43±6.42, 59.68±8.10, 61.85±10.39), despite subtest III posing greater difficulty while having the same number of digits as subtests I and II. The average duration of fixations becomes slightly more pronounced as the test difficulty increases (230.53±37.66; 234.23±33.51, 236.17±38.77). However, the speed and amplitude of the saccades remained similar in all three cases.
When comparing these parameters between the horizontal subtest of the DEM and the combined horizontal subtests II and III of the KD, we can observe similarities in the time required to verbalize the 80 digits (35.43 s ±6.82, 34.20 s ±6.19) and the number of fixations (121.26±15.69, 121.53±16.84), and their duration (243.88 ms ±47.025, 235.20 ms±34.29). However, the KD test exhibits a higher mean duration, amplitude, and velocity of saccades compared to the DEM test. On the other hand, the KD test shows a lower number of saccades than the subtest C of the DEM. The Wilcoxon test shows statistically significant differences between the values of both tests, except for the number of fixations (Duration: p = 0.006, Number of fixations: p = 0.857, Duration of fixations: p = 0.020, Number of saccades: p < 0.001, Duration of saccades: p < 0.001, Mean saccadic speed: p < 0.001, Mean saccadic length: p < 0.001).
Although there are statistically significant differences between the parameters obtained by the eye tracker during the performance of the two tests, it is observed that there is a significant positive correlation between both tests (Table 3).
The correlation was calculated between the duration of the horizontal subtest C of the DEM test and the rest of the variables (Table 4 and Fig. 1) as well as between the duration of the combination of the horizontal subtests II and III of the KD test and the rest of the parameters of that test (Table 4 and Fig. 2).
Correlation analysis of the duration of the subtest C of the DEM with the other variables. and the duration of the subtest II and III of the KD with the rest of the variables. Abbreviations: CC: correlation coefficient.
 Scatter diagram with regression line of duration of subtest C in the DEM test by number of fixations of each participant. (b) Scatter diagram with regression line of duration of subtest C in the DEM test by duration of fixations. (c) Scatter diagram with regression line of duration of subtest C in the DEM test by number of saccades. (d) Scatter diagram with regression line of duration of subtest C in the DEM test by saccadic speed.")
(a) Scatter diagram with regression line of duration of subtest C in the DEM test by number of fixations of each participant. (b) Scatter diagram with regression line of duration of subtest C in the DEM test by duration of fixations. (c) Scatter diagram with regression line of duration of subtest C in the DEM test by number of saccades. (d) Scatter diagram with regression line of duration of subtest C in the DEM test by saccadic speed.
 Scatter diagram with regression line of duration of the combined subtests II and III of the KD by number of fixations of each participant- (b) Scatter diagram with regression line of duration of the combined subtests II and III of the KD by duration of fixations. (c) Scatter diagram with regression line of duration of the combined subtests II and III of the KD by number of saccades. (d) Scatter diagram with regression line of duration of the combined subtests II and III of the KD by saccadic speed.")
(a) Scatter diagram with regression line of duration of the combined subtests II and III of the KD by number of fixations of each participant- (b) Scatter diagram with regression line of duration of the combined subtests II and III of the KD by duration of fixations. (c) Scatter diagram with regression line of duration of the combined subtests II and III of the KD by number of saccades. (d) Scatter diagram with regression line of duration of the combined subtests II and III of the KD by saccadic speed.
As shown in Table 4, the duration of both tests exhibits a significant positive correlation with the number of saccades and fixations, the duration of fixations, and the speed of the saccades. However, there is no correlation between the duration of the test and the duration or amplitude of the saccades.
Fig. 3 displays the Bland-Altman plots for the duration of tests, along with the number and duration of fixations and saccades, and the speed of saccades, with pertinent values detailed in Table 5. These plots reveal a measure of variation and a slight inclination towards bias within certain metrics, yet the preponderance of data lies within acceptable limits of agreement. This indicates that while there are minor differences, the two tests generally provide commensurate results within the tested parameters. The analysis of test duration and saccade count demonstrates a high concordance coefficient, signifying a very good level of agreement. In contrast, the duration of fixations exhibits greater variability and a higher standard deviation, suggesting lower concordance.
, number and duration of fixations (b) (d), number of saccades (c), duration of saccades (e), and saccade speed (f).")
Key values from the Bland-Altman analysis of parameters obtained via eye tracker.
Additionally, a substantial proportion of measurements cluster within the 95 % confidence interval for most parameters, underscoring the tests' reliability. Saccadic speed, however, shows noticeable variability with lower concordance coefficients, denoting more significant differences between the tests. The number of fixations also shows variability with a concordance coefficient that is not quite optimal. From the detailed insights provided by the Bland-Altman plots, the parameters that display the greatest variability and the largest number of outliers are the duration of fixations and saccadic speed. These differences between the two tests may stem from the varying spacing between the digits comprising each test.
DiscussionThis study aims to compare eye movements monitored with an eye tracker during two commonly used visuo-verbal tests in optometry clinics for assessing ocular motility. However, to our knowledge, the relationship between the parameters obtained by the eye tracker in the DEM and KD tests has not been previously analyzed. The study explores the differences in ocular motility as measured by the DEM test and the KD test, both administered using eye-tracking technology. This research is the first documented comparison of specific eye-tracking parameters from these two tests. Statistically significant differences were found between the DEM test and the KD test. These differences suggest that while both tests measure similar aspects of ocular motility, they are not interchangeable. However, there was a clear concordance between the two tests in assessing the overall test duration, as well as the number and duration of fixations and saccades, including saccadic speed, facilitated by the use of an eye tracker.
DEM vs. KDAs observed in Fig. 3 (Bland-Altman plot), there is a clear concordance between the two tests in assessing the overall test duration, as well as the number and duration of fixations and saccades, including saccadic speed, facilitated by the use of an eye tracker. The parameters that exhibit the greatest variability and the highest number of outliers are the duration of fixations and saccadic speed. The employment of the eye tracker has enabled us to quantify and compare these parameters of ocular motility, thereby providing us with enhanced insights into this aspect of visual function.
Heick et al.16 conducted a study to evaluate the relationship between horizontal and vertical saccades using both tests. They found a strong correlation coefficient of 0.67 between the two tests. In our research, we observed a significant higher correlation coefficient of 0.888. This disparity may be attributed to the fact that the authors correlated the values of the horizontal subtest of the DEM with the overall time taken to perform the KD test. In our study, we compared subtests II and III of the KD test with the horizontal subtest of the DEM test, focusing on the time taken to name the same number of digits. Furthermore, Heick et al.16 suggested that the DEM test evaluation appears to be more effective in concussion cases due to its assessment of both horizontal and vertical saccades, as these eye movements are controlled by different brain areas. Additionally, vertical and oblique movements play a role in reading when line breaks are necessary.
In their research comparing both tests, Basulto et al.30 proposed using a combination of subtests II and III of the KD test to match the number of digits presented in subtest C of the DEM test. They found a statistically significant correlation with a moderate correlation coefficient of 0.498 in the school population. A significant connection with a high correlation coefficient value (0.888) was also observed. The difference in age between the two populations may account for the variation in correlation coefficient values.
DEMSeveral studies have reported a correlation between the values obtained in the DEM and reading ability and processing speed.3,18,22 Powers et al.24 examined high school students' performance on the conventional horizontal subtest C of the DEM test and found poor performance in individuals with reading difficulties. They concluded that these subjects exhibited inadequate horizontal saccades, while their vertical subtest scores were within the normal range, suggesting that their difficulties were not due to an inability to decode and verbalize numbers.
There are not many studies that have utilized eye-tracking during the administration of the DEM test, highlighting the contribution of our study. Eye-tracking during the Developmental Eye Movement (DEM) test has been conducted in a paediatric population.5,11 Moiroud et al.11 examined eye movements during the DEM C test between a group of dyslexic children and a group of non-dyslexic children of the same age (9.2 ± 0.4 years). They discovered a higher number of fixations in dyslexic children (150±14) compared to their non-dyslexic peers (114±7). In our study, the number of fixations was lower at 121.26±15.69, but it involved a population of young adults. Interestingly, the number of saccades reported by Moiroud et al.11 was consistent at 127±9 in both groups, whereas in our study, this figure was significantly higher at 189.62±99.23. This discrepancy in saccadic numbers might be attributed to differences in the devices used for recording eye movements.
Tanke et al.18 measured eye movements in healthy children using a digital version of the DEM test and assessed visual processing speed using the Speed Acuity test. They observed that the time spent on saccades during the test was minimal, with the majority of time devoted to fixations. A lower number of saccadic movements was also observed within a short time frame when performing the horizontal subtest C of the DEM test. Similar trends were observed in our study for both the DEM and the KD tests. Furthermore, Tanke found that more saccadic movements were performed in the horizontal subtest C of the DEM test compared to the vertical subtests A and B of the DEM test, which aligns with our present findings. The authors also noted a higher occurrence of orthogonal eye movements during the horizontal subtest C of the DEM test compared to the vertical subtests A and B of the DEM test. They reported a strong positive correlation between the responses in the vertical and horizontal subtests of the DEM test and visual processing speed. The authors suggested that while the DEM test may not be suitable for measuring saccadic behavior, it can serve as an index for visual-verbal naming skills and visual processing speed.
Hindmarsh et al.5 conducted an analysis of eye movements using an eye tracker during the performance of the DEM test. In their study, children aged 7.9 ± 0.3 years with average or superior reading abilities exhibited 199.1 ± 47.31 saccades, a value higher than that found in our research. Their findings revealed that the group of subjects with poor reading ability exhibited significantly poorer results across all standard DEM test metrics compared to those with average or higher reading ability. Specifically, during the horizontal subtest C of the DEM test, they observed and characterized eye movement patterns, considering both horizontal and vertical movements. Children with poor reading performance demonstrated inferior control of vertical movements, longer fixations, distinctive behavior in horizontal movements (including a higher occurrence of interlinear eye movements and regressions), and a greater number of errors attributed to loss of place. The study emphasized the importance of evaluating both vertical and horizontal movements, as both are involved in reading multiple lines of text and showed differences in subjects with varying reading levels.
An attempt has been made to implement the measurement of eye movements using virtual reality technology through a head-mounted display and the DEM test. However, it appears that measuring ocular motility in a real environment using eye tracking exhibits a stronger correlation with the conventional method.31
KDThe KD test has been widely utilized in research involving adults, athletes, and as part of the assessment battery for mild brain damage.13,26 In a study by Hecimovich et al.,13 they compared the results of the KD test monitoring the ocular movement through eye tracker of athletes with concussion and without concussion of two rugby teams between 18 and 21 years of age. The clinical duration of the KD test was identified as the most helpful characteristic in diagnosing concussions. However, the study's results did not indicate that total saccades, average saccade velocity, total fixations, average fixation duration, or average fixation polyarea were useful diagnostic tools. It is important to note that one limitation of this study was the small sample size of participants. When comparing the results obtained from the group of subjects who had not experienced a concussion with the findings of our investigation, we found very similar values for the test duration (55.6 s/50.17 s), number of fixations (170.6 /178.96), and fixation duration (247.1 ms/233.64 ms). This divergence may be attributed to the use of different devices for data collection.
Rizzo et al.26 discovered that the average time per card for subjects was 17.47 (± 3.77) seconds for the first card, 17.44 ± 4.28 s for the second, and 16.33 ± 2.77 s for the third. Additionally, they noted that the duration of saccades was 36.9 ± 9.8 ms, which is longer than the 29.37 ms found in our study. These authors agree with our findings that subjects make more saccades than the number of digits on the test, even among those who perform it correctly.
The utilization of an eye tracker enables the objective characterization of eye movements and the acquisition of parameters that cannot be measured using conventional visuo-verbal tests employed in this study. Notably, it provides insights into the speed and precision of saccadic movements, including hypermetric or hypometric movements, as well as fixation duration. Both the KD and the DEM tests could be conducted digitally instead of their original format in print paper, yielding additional values related to ocular motility that can offer further information and complement the existing data obtained from these tests. Moreover, with the aid of these devices, the eye movement patterns during the reading process can be analyzed among individuals with varying levels of reading ability.
We believe it is crucial to assess not only horizontal movements but also vertical movements since during reading, although a greater number of horizontal movements are made, individuals with poorer reading performance tend to struggle with oblique movements when transitioning between lines. This difficulty is also observed during the performance of both the DEM and the KD tests. However, we have found challenges in performing the DEM test in many cases due to a higher number of lines and a greater potential for getting lost, particularly in the middle section of the subtest C. In addition, in our clinical experience with the DEM test, there have been instances where patients exhibit a low percentile in the vertical subtests A and B, but a normal or high percentile in the horizontal subtest C, making it difficult to characterize this type of patient using this test. Gil-Casas et al.14 reported similar findings in a study conducted on patients with multiple sclerosis. The development of both the DEM and the KD tests was analyzed and compared with those of healthy subjects. They noted that a small percentage of patients in both the control group and the multiple sclerosis patient groups, with or without optic neuritis, could not be classified according to the ratio because they exhibited longer vertical times than horizontal times.
While it is important to consider certain limitations that the eye tracker may present, such as challenges in detecting the eyes of certain patients, Tanke et al.18 pointed out in their study that performing the test with children can be difficult if they do not maintain a still head position, as the eye tracker may stop detecting their eyes at some point. This issue can be resolved by incorporating a chin rest, as we have done in this study. On the other hand, it is also important to highlight that it is necessary to have sufficient and uniform ambient lighting, as well as to avoid reflections or excess light coming from the windows in order to be able to carry out the measurements with the eye tracker properly. Additionally, it is necessary for these devices to be more economically accessible so that this technology can be implemented beyond the realm of research.
This study has several limitations that merit consideration. Firstly, the relatively small sample size, Additionally, the study sample consists solely of young and healthy individuals. This limits the ability to generalise the results to broader or more diverse populations, such as children, older adults, or individuals with pre-existing neurological or visual conditions. The study was conducted in a controlled environment, which is ideal for research purposes but may not reflect the typical conditions under which these tests would be administered in clinical or educational settings.
On other hand, although the use of eye trackers provides detailed and objective measurements of ocular motility, the accuracy and reliability of these devices can vary. Furthermore, eye trackers may be prone to errors if not properly calibrated or if participants do not maintain a fixed position during the test. Further research is needed to investigate ocular motility in individuals with oculomotor dysfunction to analyze how eye tracking parameters are detected in such cases.
ConclusionsStatistically significant differences were found between the DEM and the KD tests, but the variables measured in both tests are positively correlated. This suggests that both tests measure similar aspects but are not interchangeable.
The DEM test provides more comprehensive information as it includes two sheets for assessing vertical saccades.
The duration and amplitude of saccades in both tests are not related to the duration of the test. However, the duration of both tests shows a positive correlation with the number of saccades and fixations, the duration of fixations, and the speed of saccades.
Declaration of generative AI and AI-assisted technologies in the writing processDuring the preparation of this work the authors used ChatGPT in order to improve language and readability. After using this tool/service, the authors reviewed and edited the content as needed and take full responsibility for the content of the publication.
This research was funded by the Agencia Estatal de Investigación, Ministerio de Ciencia e Innovación of the Spanish Government (Grant PID2019-107058RB-I00 funded by MCIN/AEI/10.13039/501100011033), Gobierno de Aragón-Departamento de Ciencia, Universidad y Sociedad del Conocimiento-No LMP39_21, and “Ayudas para la adquisición de infraestructura de investigación (Modalidad A). Contrato Programa Plan De Inversiones e Investigación Gobierno de Aragón-Universidad de Zaragoza. Fondos Feder-2020″.


