


This systematic review evaluates current literature on the impact vision impairment has on reading and literacy levels within education.
MethodsSix databases were searched with inclusion criteria of trials or studies involving children who are blind or vision impaired, and impact on academic or school performance – including reading and literacy. 1262 articles were identified, with 61 papers undergoing full screening. Quality appraisal was performed using Critical Appraisal Skills Program (CASP) and seven articles deemed eligible for inclusion.
ResultsIncluded articles achieved a quality score of over 70 % using the CASP checklists. Direct comparison of articles was not possible due to methodological differences in assessing reading and literacy levels. All seven studies investigated aspects of reading speed, with additional measures of reading performance, such as reading reserve, comprehension, and reading accuracy.
DiscussionUnderlying trends highlighted students with a vision impairment do not perform at same level as their normally sighted peers with respect to reading performance - in terms of speed, but not ability. Additionally, early intervention to enhance literacy skills may help improve educational outcomes. Future direction should be aimed at identifying specific obstacles to learning these students face and providing interventions to improve academic outcomes.
Childhood vision impairment is a condition that can significantly impact all areas of a child's development, with education playing a critical role in determining their overall quality of life1 and long term social and economic position.2,3 A child with a vision impairment is more likely to live in deprivation, have negatively impacted emotional and social wellbeing, and have reduced opportunities for future employment, which contributes to an increased financial burden on society through support.4-8 Children with a vision impairment are also more likely to have autism spectrum disorder as a comorbidity with their reduced vision.9
In 2019 The World Health Organization (WHO) Report on Vision highlighted the importance of good vision in the development of children and adolescents.2 From cognitive and social development, motor skills, coordination, and balance, to the ability to access education and achieve optimum academic success. This ultimately facilitates participation in the workforce which contributes to economic productivity and fosters a positive sense of identity for the individual.2,3 The WHO defines vision impairment as best corrected visual acuity worse than 6/12 (mild impairment), worse than 6/18 (moderate impairment) and worse than 6/60 as severe. Blindness is defined as having a best corrected visual acuity level of less than 3/60.2
The prevalence of childhood blindness is estimated to be 1.4 million worldwide with an additional 19 million children categorized as vision impaired - a high proportion of these (31 %) owing to an inherited condition.10,11 Prevalence is higher in lower income countries than higher income countries and can range from 0.1/1000 – 1.1/1000 children respectively.4 In developed countries, major causes of vision impairment are the result of cortical vision impairment, optic nerve anomalies, albinism and hereditary retinal dystrophies.4,10-13 Retinopathy of prematurity, cataract, glaucoma and non-accidental injury are the most common avoidable causes.10
Children with a vision impairment are commonly categorised and receive academic support based on best corrected visual acuity and/or visual fields, which broadly correspond to the WHO's definition of blindness and vision impairment. Studies have shown that these measures can be inaccurate indicators of visual performance, particularly in children, as visual acuity measures can be variable depending on the testing methods.14-17 Furthermore, distance visual acuity is not the most relevant aptitude required within the classroom environment, as classroom time necessitates a high proportion of visual tasks that are predominantly based on near vision.18 Therefore, distance visual acuity may not provide the best measure for fully describing the child's overall visual ability or performance within the classroom. Childhood vision impairment is also a complex entity as different pathologies present with different visual abilities. The term blindness is also a confounding term as many “blind” children have some functional vision.19
The educational challenges faced by children with a vision impairment vary considerably. In addition to reduced visual acuity, pathogenic factors significantly contribute to a student's visual ability, in terms of font requirements, contrast and lighting.20
To accommodate students with a vision impairment, a common classroom adaption involves enlarging the font size to enhance reading comfort. Whittaker (1993) investigated the visual requirements for reading and determined four factors that affected reading rate: acuity reserve (print size compared with minimum reading acuity), contrast reserve (print contrast relative to contrast threshold), field of view, and the presence and size of any central scotoma.21 Bailey et al. (2003) demonstrated that the size of reading print is a significant factor in reading speed, emphasising that the ability to optimise font size for children provides a better opportunity for increased reading speed. However, studies have also shown that making the font size too large can decrease reading speed. This is because when letters are imaged too far in the periphery of the retina, resolution decreases, leading to a decline in reading speed.22
As children progress through school to higher years, these visual demands increase as workloads increase. Highlighting the importance of the provision of adequate accessibility strategies to enable vision impaired students to continue learning at the same rate as their sighted peers, particularly as workloads increase in later schooling years.
Previous studies have examined the consequences of uncorrected refractive error and the negative impact they have upon on academic achievement. In a study by White et al. (2017), which involved 109 Grade 3 students in Australia, thirty percent of students that were referred for further screening also scored lower on national standardized testing.23 Narayanasamy et al. (2014, 2015) used simulated refractive errors and demonstrated that even low levels of hyperopia and astigmatism resulted in reduced reading speed, reading accuracy, comprehension and visual processing, highlighting the importance of optimal vision for academic success.24,25
Upon leaving education, and despite employment opportunities improving over time for students who are blind and vision impaired, a gap still exists between the employment rates of individuals who are blind or vision impaired compared with normally sighted individuals - which are still less than 50 %.26 Individuals who are vision impaired are also at an increased risk of suicide later in life compared to the general population, which is further increased in those reporting poorer self-rated health issues.27 Further studies have found that reduced vision results in a significant impact on self-rated health as adults.7,28 A child born with a vision impairment is also more likely to be hospitalized or die during childhood9,11,26 and score low on the Health-Related Quality of Life.3,27-32
This review evaluates the literature regarding the influence of childhood vision impairment on reading, literacy, and educational performance within the classroom setting. It investigates the literature to understand the processes by which students with a vision impairment learn to read in comparison with normally sighted students. It also explores the impact that vision impairment has on learning and discusses how this may affect educational outcomes.
MethodsThis systematic review was registered with Prospero (https://www.crd.york.ac.uk/prospero/) database number: CRD42020172342.
Search strategyA search of six databases was performed in the following databases: Ovid Medline (R) and Epub Ahead of Print, In-Process and Other Non-Indexed Citation, Daily and Version(R) 1946 to May 1st 2023, Cochrane Library, Emcare, Web of Science, Scopus, ERIC (Institute of Education Services). No date restrictions were used. References of all relevant articles were hand searched. See Table 1 for search terms used in the databases. A final search of the databases was performed on the 1st May 2023 for any recent publications.
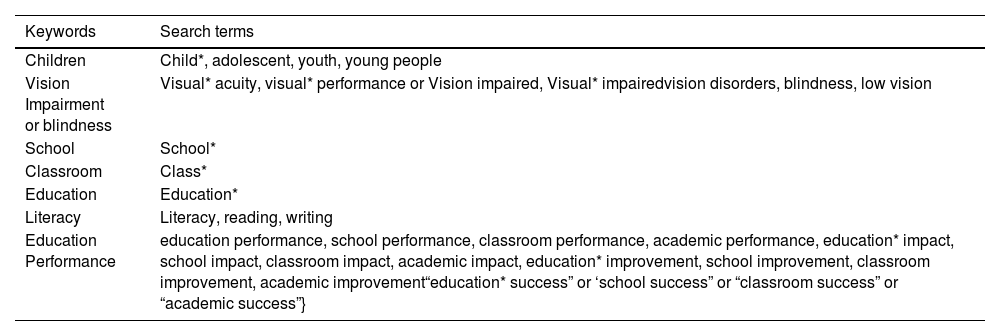
Keywords and search terms used.
Table 1. Keywords and search terms used. Searches were limited to human subjects and conducted in the English language up until May 2023.
Trials or studies included in this review involved children aged 5–18 years who had received a pathological vision diagnosis and were classified as blind or vision impaired according to the WHO criteria.2 The trials or studies focused on examining the effects of vision impairment on academic and school performance, specifically in areas such as literacy (including reading and comprehension), writing skills, access to information, and overall classroom performance.
Exclusion criteriaStudies were excluded if children had co-morbidities, such as additional sensory or cognitive disability, or if they had a diagnosed reading disability (dyslexia). Studies from developing countries were not included due to variable levels of education and healthcare available within these countries, making it challenging to draw direct comparisons.33-35
Additionally, studies involving preschool-age children were excluded, as the focus was on examining the impact of vision impairment on learning specifically within the school environment.
Study selectionDatabase searches revealed 1262 articles, with an additional article identified by personal communication. Articles were imported into EndNoteX9 and after duplicates were removed and seven additional papers identified from hand searching, 1043 titles and abstracts were screened for obvious ineligibility. Sixty-one remaining articles then underwent full-text screening against eligibility criteria by two of the authors (LL and MPS), with a third author available (PC) if agreement was not reached. Of those articles, seven papers were eligible for inclusion (See Fig. 1 for Prisma flow diagram of searches).

Although the search strategy identified articles that investigated measurable academic outcomes and the impact on mathematical grades, these studies investigated the impact of uncorrected refractive error in children and were excluded.23,36 The papers included for review were therefore limited to articles that investigated reading and literacy skills in children specifically with a diagnosed vision impairment that was non-refractive error in nature.
Quality appraisalTo assess the quality of each study and to determine eligibility for inclusion, the Critical Appraisal Skills Program (CASP) was used because it has separate checklists to evaluate the quality of varying study methods.37 Studies were included if they were deemed valid following appraisal with the relevant CASP checklist. CASP does not use a standardised numerical scoring system. Instead, it employs a series of questions designed to guide the user through the critical appraisal process. Questions are answered as a “yes”, “no” or “can't tell” response. To enable the selection of studies, a scoring system was designed as a tool to confirm agreement between authors and determine the quality of studies included.
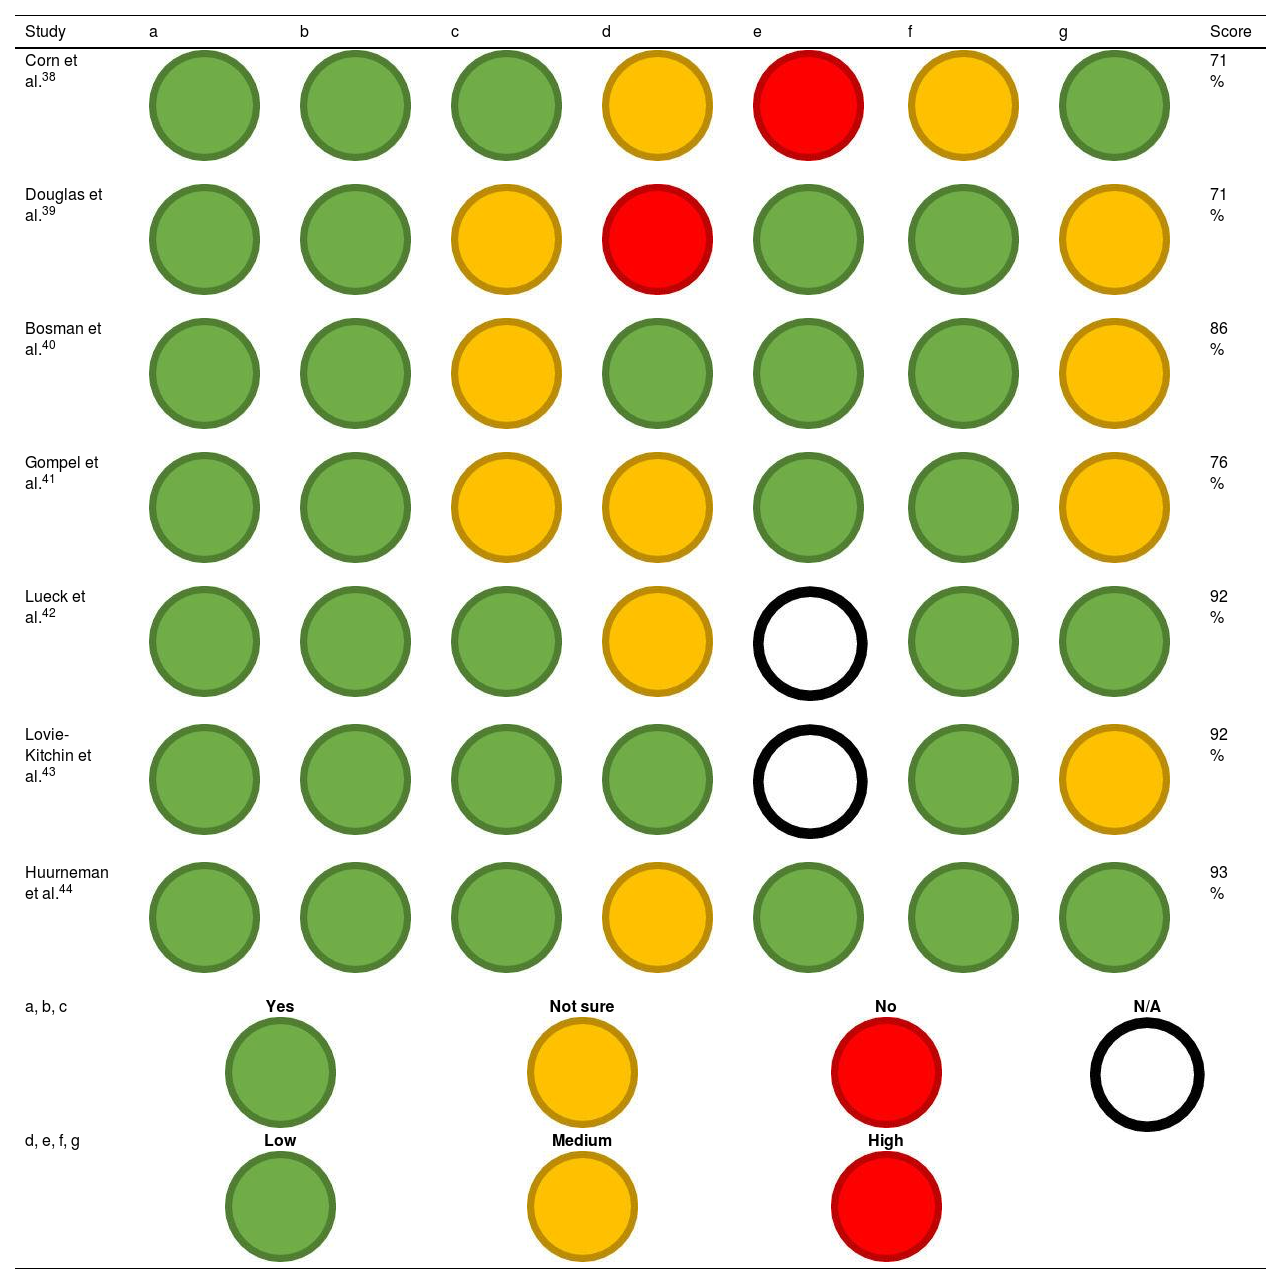
ResultsIncluded studiesUsing CASP themes, studies were assessed for clear study focus, appropriate methodology, confounding factors, and validity of results. Limitations and risk of bias were also considered and an assessment of high, medium, or low bias was subsequently determined (see Table 2). Studies were scored on quality with green scoring 2 points, yellow 1 point, and red 0 points. Scores from all three authors were compared and discussed until agreement was reached. Scores were then converted into percentage values with all articles achieving a quality score of over 70 %. Small participant numbers, recruitment methods, methods of visual acuity measurement, methods of reading analysis measurement and missing data from studies were the main causes of bias. Two studies did not specify visual acuity measures but were determined eligible for inclusion as all participants had been previously diagnosed with a vision impairment by an ophthalmologist.
CASP checklist assessment.
| Study | a | b | c | d | e | f | g | Score |
|---|---|---|---|---|---|---|---|---|
| Corn et al.38 | 71 % | |||||||
| Douglas et al.39 | 71 % | |||||||
| Bosman et al.40 | 86 % | |||||||
| Gompel et al.41 | 76 % | |||||||
| Lueck et al.42 | 92 % | |||||||
| Lovie-Kitchin et al.43 | 92 % | |||||||
| Huurneman et al.44 | 93 % | |||||||
| a, b, c | Yes | Not sure | No | N/A | ||||
| d, e, f, g | Low | Medium | High | |||||


Table 2. CASP checklist assessment including themes of (a) Clear Study Focus (b) Appropriate Methodology (c) Validity of Results (d) Recruitment Bias (e) Control Bias (f) Outcome Bias (g) Confounding Factors, (N/A) not applicable.
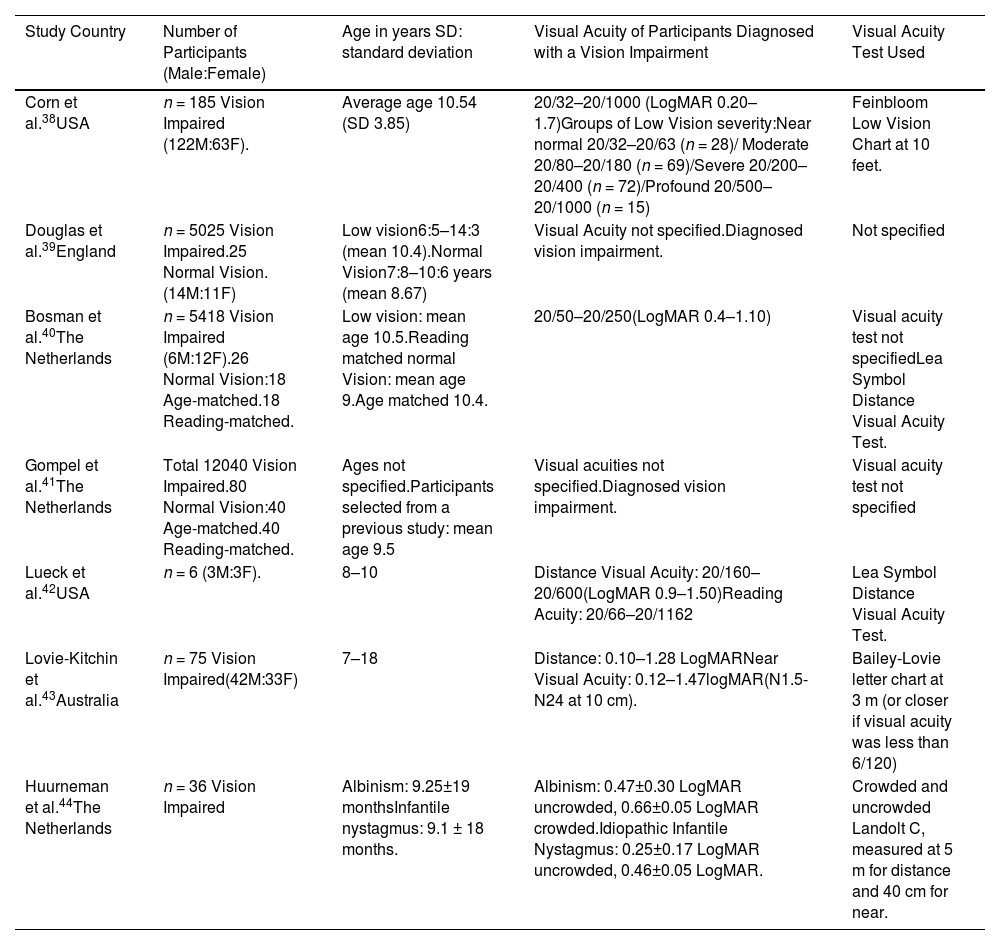
Study designs varied, one longitudinal study investigating the impact of optical devices over a four to six-month period,38 three case control studies,39,40,41 two case series42,43 and one interventional study used crowding training.44 Visual acuities ranged from 0.10 −1.70 LogMAR, with two papers not specifying visual acuities.39,41 Participant numbers varied from 6 to 158, and ages also varied from 6 to 18 years. Vision impaired children were recruited predominantly from either mainstream schools or specialist vision impaired institutes. Countries included The Netherlands (3), The USA (2), England (1) and Australia (1). A summary of demographics is detailed in Table 3.
Demographics of included participants.
| Study Country | Number of Participants (Male:Female) | Age in years SD: standard deviation | Visual Acuity of Participants Diagnosed with a Vision Impairment | Visual Acuity Test Used |
|---|---|---|---|---|
| Corn et al.38USA | n = 185 Vision Impaired (122M:63F). | Average age 10.54 (SD 3.85) | 20/32–20/1000 (LogMAR 0.20–1.7)Groups of Low Vision severity:Near normal 20/32–20/63 (n = 28)/ Moderate 20/80–20/180 (n = 69)/Severe 20/200–20/400 (n = 72)/Profound 20/500–20/1000 (n = 15) | Feinbloom Low Vision Chart at 10 feet. |
| Douglas et al.39England | n = 5025 Vision Impaired.25 Normal Vision. (14M:11F) | Low vision6:5–14:3 (mean 10.4).Normal Vision7:8–10:6 years (mean 8.67) | Visual Acuity not specified.Diagnosed vision impairment. | Not specified |
| Bosman et al.40The Netherlands | n = 5418 Vision Impaired (6M:12F).26 Normal Vision:18 Age-matched.18 Reading-matched. | Low vision: mean age 10.5.Reading matched normal Vision: mean age 9.Age matched 10.4. | 20/50–20/250(LogMAR 0.4–1.10) | Visual acuity test not specifiedLea Symbol Distance Visual Acuity Test. |
| Gompel et al.41The Netherlands | Total 12040 Vision Impaired.80 Normal Vision:40 Age-matched.40 Reading-matched. | Ages not specified.Participants selected from a previous study: mean age 9.5 | Visual acuities not specified.Diagnosed vision impairment. | Visual acuity test not specified |
| Lueck et al.42USA | n = 6 (3M:3F). | 8–10 | Distance Visual Acuity: 20/160–20/600(LogMAR 0.9–1.50)Reading Acuity: 20/66–20/1162 | Lea Symbol Distance Visual Acuity Test. |
| Lovie-Kitchin et al.43Australia | n = 75 Vision Impaired(42M:33F) | 7–18 | Distance: 0.10–1.28 LogMARNear Visual Acuity: 0.12–1.47logMAR(N1.5-N24 at 10 cm). | Bailey-Lovie letter chart at 3 m (or closer if visual acuity was less than 6/120) |
| Huurneman et al.44The Netherlands | n = 36 Vision Impaired | Albinism: 9.25±19 monthsInfantile nystagmus: 9.1 ± 18 months. | Albinism: 0.47±0.30 LogMAR uncrowded, 0.66±0.05 LogMAR crowded.Idiopathic Infantile Nystagmus: 0.25±0.17 LogMAR uncrowded, 0.46±0.05 LogMAR. | Crowded and uncrowded Landolt C, measured at 5 m for distance and 40 cm for near. |
Table 3. Demographics, including participant numbers, country, participant ages, visual acuity ranges and visual acuity tests used – where specified: M: Male; F: Female; n: Number of participants; SD: Standard Deviation.
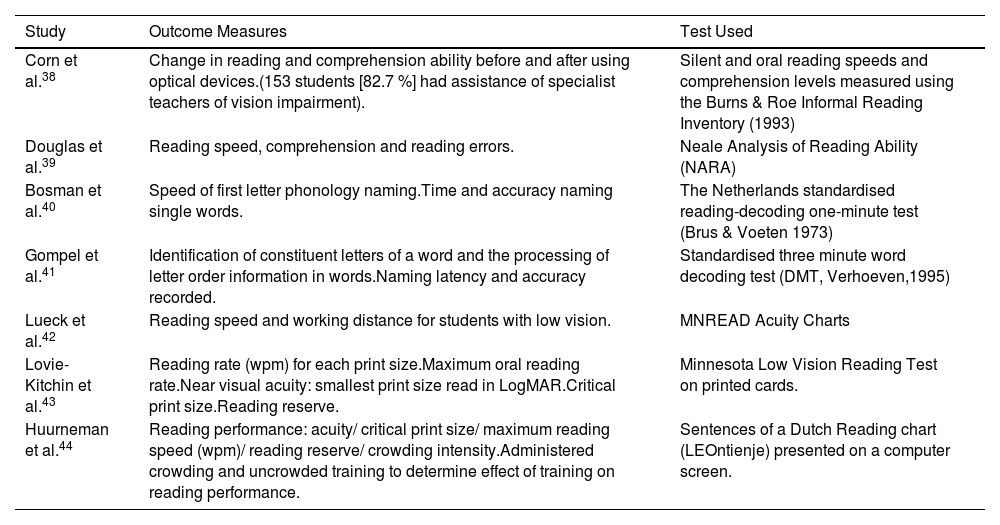
Due to the large variation in participant numbers, ages, visual acuities, causes of vision impairment, methodological differences and outcome measures, a direct quantitative comparison of the findings was not possible. All papers investigated reading performance and used varying methodologies to determine reading speed as a primary outcome measure. Alternative measurements of reading ability were comprehension,38,39 reading acuity/print size,40-42 and reading accuracy or reading errors.39,43,44 (See Table 4 for details).
Outcome measures.
| Study | Outcome Measures | Test Used |
|---|---|---|
| Corn et al.38 | Change in reading and comprehension ability before and after using optical devices.(153 students [82.7 %] had assistance of specialist teachers of vision impairment). | Silent and oral reading speeds and comprehension levels measured using the Burns & Roe Informal Reading Inventory (1993) |
| Douglas et al.39 | Reading speed, comprehension and reading errors. | Neale Analysis of Reading Ability (NARA) |
| Bosman et al.40 | Speed of first letter phonology naming.Time and accuracy naming single words. | The Netherlands standardised reading-decoding one-minute test (Brus & Voeten 1973) |
| Gompel et al.41 | Identification of constituent letters of a word and the processing of letter order information in words.Naming latency and accuracy recorded. | Standardised three minute word decoding test (DMT, Verhoeven,1995) |
| Lueck et al.42 | Reading speed and working distance for students with low vision. | MNREAD Acuity Charts |
| Lovie-Kitchin et al.43 | Reading rate (wpm) for each print size.Maximum oral reading rate.Near visual acuity: smallest print size read in LogMAR.Critical print size.Reading reserve. | Minnesota Low Vision Reading Test on printed cards. |
| Huurneman et al.44 | Reading performance: acuity/ critical print size/ maximum reading speed (wpm)/ reading reserve/ crowding intensity.Administered crowding and uncrowded training to determine effect of training on reading performance. | Sentences of a Dutch Reading chart (LEOntienje) presented on a computer screen. |
Table 4. Summary of primary outcome measures from each included study and reading tests used: Critical Print Size: Smallest font that can be read at maximum reading speed. Reading Reserve: ratio of critical print size to smallest font size read. Crowding Intensity: ratio of crowded acuity to uncrowded acuity. Reading rate in words per minute (wpm).
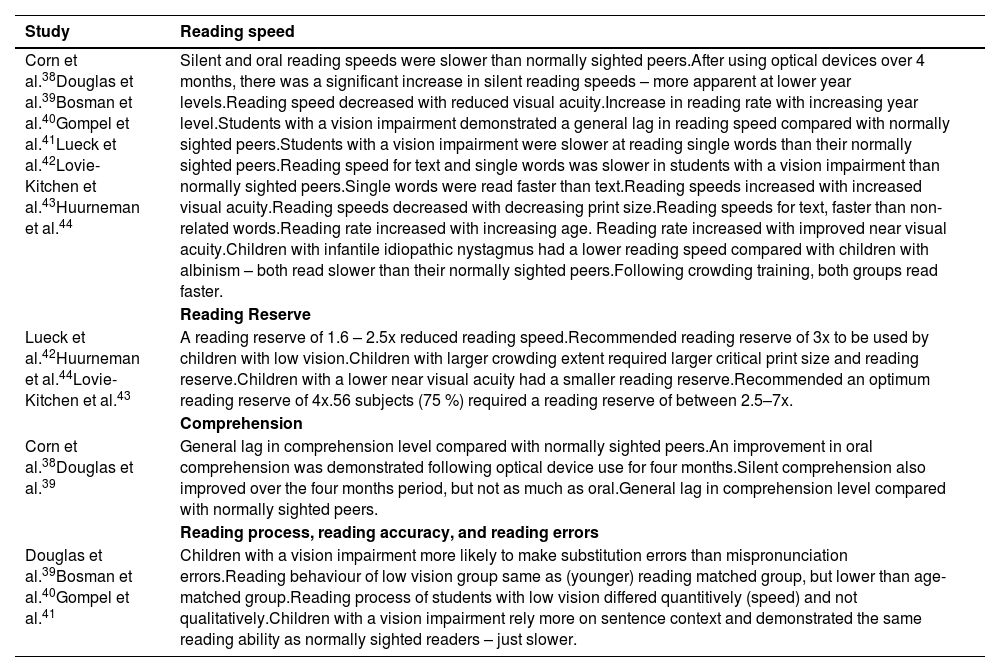
All seven included studies investigated reading speed. The majority analysed reading speed while reading continuous text,38,39,41-44 whereas one study investigated the speed of naming single words.40 There was consensus amongst all studies that reading speed was slower in children with a vision impairment compared with their age matched peers, and common findings that reading speed increased with age,38,43 and with an improvement in visual acuity38,42,43 - although visual acuity was noted as distance in two studies,38,42 and near in one.43 Two studies compared the reading speed of text to single words and discovered contradictory results, with one finding text reading faster,42 and the other single words.41 (See Table 5 for details).
Reading characteristics.
| Study | Reading speed |
|---|---|
| Corn et al.38Douglas et al.39Bosman et al.40Gompel et al.41Lueck et al.42Lovie-Kitchen et al.43Huurneman et al.44 | Silent and oral reading speeds were slower than normally sighted peers.After using optical devices over 4 months, there was a significant increase in silent reading speeds – more apparent at lower year levels.Reading speed decreased with reduced visual acuity.Increase in reading rate with increasing year level.Students with a vision impairment demonstrated a general lag in reading speed compared with normally sighted peers.Students with a vision impairment were slower at reading single words than their normally sighted peers.Reading speed for text and single words was slower in students with a vision impairment than normally sighted peers.Single words were read faster than text.Reading speeds increased with increased visual acuity.Reading speeds decreased with decreasing print size.Reading speeds for text, faster than non-related words.Reading rate increased with increasing age. Reading rate increased with improved near visual acuity.Children with infantile idiopathic nystagmus had a lower reading speed compared with children with albinism – both read slower than their normally sighted peers.Following crowding training, both groups read faster. |
| Reading Reserve | |
| Lueck et al.42Huurneman et al.44Lovie-Kitchen et al.43 | A reading reserve of 1.6 – 2.5x reduced reading speed.Recommended reading reserve of 3x to be used by children with low vision.Children with larger crowding extent required larger critical print size and reading reserve.Children with a lower near visual acuity had a smaller reading reserve.Recommended an optimum reading reserve of 4x.56 subjects (75 %) required a reading reserve of between 2.5–7x. |
| Comprehension | |
| Corn et al.38Douglas et al.39 | General lag in comprehension level compared with normally sighted peers.An improvement in oral comprehension was demonstrated following optical device use for four months.Silent comprehension also improved over the four months period, but not as much as oral.General lag in comprehension level compared with normally sighted peers. |
| Reading process, reading accuracy, and reading errors | |
| Douglas et al.39Bosman et al.40Gompel et al.41 | Children with a vision impairment more likely to make substitution errors than mispronunciation errors.Reading behaviour of low vision group same as (younger) reading matched group, but lower than age-matched group.Reading process of students with low vision differed quantitively (speed) and not qualitatively.Children with a vision impairment rely more on sentence context and demonstrated the same reading ability as normally sighted readers – just slower. |
Table 5. Summary of main findings of reading measures from each included study included: Reading Reserve: ratio of critical print size to smallest font size read. Crowding Extent: ratio of crowded acuity to uncrowded acuity.
Three studies investigated reading reserve - the relationship between minimum font size read and critical print size (the smallest font read at maximum reading speed). Reading reserves differed across all these three studies and ranged from 1.6 to 7.0 times.42,43 (See Table 5 for details).
ComprehensionTwo studies examined comprehension by children with low vision.38,39 It was found, in terms of reading ability, that students with a vision impairment demonstrated a generalized lag in comprehension ability, compared to their normally sighted peers. Corn et al38 additionally found an increase in comprehension ability following optical device use over a four-month period, which was more apparent in younger participants from grades 1–3. (See Table 5 for details).
Reading process, reading accuracy, and reading errorsThree studies investigated the reading processes adopted by children with a vision impairment.38,41,43 Douglas et al39 found that the students with a vision impairment tended to make more substitution errors than mispronunciation errors than the normally sighted group, which was theorized was a result of guessing. Whereas the younger control group of normal vision readers made more mispronunciation errors than substitution. However, these findings were contrary to the other two studies40,41 that found reading processes were not significantly different to the students of the same reading-matched group and were slower but equally accurate. Gompell et al41 also found that children with a vision impairment relied more on sentence context than on word phonology. (See Table 5 for details).
DiscussionThe aim of this systematic review was to evaluate the literature surrounding the impact of childhood vision impairment on educational performance within the classroom setting. The evidence surrounding this is scarce, with articles primarily focussing on the impact vision impairment has on reading. However, all articles included in this systematic review achieved a quality score of over 70 % using the CASP checklists. Despite an inability to perform a synthesis of the results owing to different outcome measures and methodological differences between the studies, this review has highlighted a difference in reading and literacy skills between students with a vision impairment and their sighted peers. All seven papers analysed reading ability and demonstrate children with a vision impairment read at a slower rate than their normally sighted peers. Reasons for this could be that vision impaired children are exposed to less incidental reading than their normally sighted peers. Reading advertisements and notices in shop window, on buses or trams and reading road signs are just a few of the many ways that reading is reinforced and practiced in normally sighted children. Bosman et al.40 highlighted that vision impaired children employed the same phonetical learning strategies as a normally sighted child, but they were limited by the practice that was taken for granted during incidental reading of a child with normal vision. Literacy skills have been shown to be a good indicator of future academic performance45,46 and early literacy (and competency in mathematics) begins its development in early childhood prior to formal educational learning. These early literacy skills, developed before a child begins school, have been shown to be important factors in the development of reading ability.47 It is therefore possible that the lack of early, incidental practice for children with a vision impairment results in reduced development of these early literacy skills and initiates the gap in reading speed ability between them, and children with normal sight, as they begin their education journey. This theory is reinforced in a study by MacDonald et al.48 who evaluated a group of children and adults with albinism to determine whether vision impairment impacted the development of reading skills. Although they observed that reading speed was slower, they found comprehension skills were normal. Indicating that vision impairment with normal cognitive ability, does not impact the acquisition of normal reading skills.
Commonly, support for a child with a vision impairment is based around distance visual acuity. However, it has been shown that the majority of time in a classroom is based around near vision tasks.18 Determining the optimal print size for reading is therefore essential to maintain engagement in classroom learning throughout the day. Lueck42 discovered that when print size was not optimal there was a significant drop in reading speed which was more apparent for the faster readers, in contrast to slower readers who read slowly across all font sizes until speed dropped abruptly. Huurneman et al44 investigated the difference in these characteristics between children with albinism and infantile nystagmus, finding that reading acuity was worse in children with albinism than infantile nystagmus – even after accounting for visual acuity measures. They also found children with a larger crowding extent (the difference between crowded and uncrowded acuity), required a larger critical print size as crowding effected letter and word recognition.
Corn et al.38 demonstrated a significant increase in reading speeds in years 1–3 of school following the use of an optimal optical device over a four-month period, which highlights the importance of improving accessibility to reading materials during early primary years. That coupled with their results of higher comprehension scores, where older students did not show as marked improvements, highlighted that improving accessibility to reading material at an earlier age during the ‘learning to read’ process, had a more marked effect on reading ability. This finding supports the importance of early intervention and the impact of support on early reading and comprehension. However, the study did not consider any support or specialist training the students may have received over this four-month period. The study authors acknowledged that some of the students did have specialist vision support teachers which may have impacted the findings.
Focus groups of children who are vision impaired mention a dislike of reading,31 perhaps because this visual task is challenging and requires extra effort, possibly resulting in additional visual fatigue and tiredness.49 This reluctance to read beyond requirements, in contrast to normally sighted children, presumably also limits any recreational reading at home and adds to the lack of reading practice children with a vision impairment undertake outside of the classroom. Khadka et al.31 also identified a voiced need for children with a vision impairment to be independent and felt, at times, limited in this independence by parents and support teachers. Accentuating a need for support based around independent accessibility and the need for children with a vision impairment to develop their independence skills that can be used for education and beyond. A recent systematic review of the factors relating to employment outcomes of students with a vision impairment found that education level had a positive effect on employment level and future earnings of vision impaired students, emphasizing the necessity of optimal education for future outcomes.50
This review draws attention to fifteen years of research indicating a generalized lag in the reading ability of students with a vision impairment compared with their normally sighted peers in terms of reading speed. Despite this there is no definitive criteria for support that is acknowledged and accepted worldwide. Many countries have systems for support within classrooms and some countries have specialist vision impairment teacher training centres to enhance support within the classroom. Often though, this task is left to a class teacher with minimal knowledge of vision impairment and its effect on a child's visual ability.
Vision impairment can result in significant visual fatigue during a school day within a classroom environment, which can manifest in different ways – headaches, tiredness or it can be changes in behaviour during the day.49 Teachers often struggle to determine if, or what, aspects are due to vision. Primary educators may not have extensive experience of vision impairment and can be faced with the difficult task of translating a visual acuity result or visual field analysis into a functional measure of the child's vision performance in class. Visual acuity is a measure of the eyes resolving ability and does not provide comprehensive knowledge around functional visual ability to enable adequate support within a classroom environment that is dominated by near tasks. Reading, writing, and literacy skills are essential foundations that are crucial for education, and the ability to achieve optimal educational outcomes is inherently determined by the ability to master these basic building blocks to learning. Strong literacy skills have been found to have a significant impact on future academic achievement,45,47 and literacy and mathematical ability have been shown to be related over time with a difficulty in one area often associated with difficulty in another.47
Study limitationsThis review was limited in several aspects. Studies were excluded from developing countries due to the variation in healthcare and resources in these countries, which may impact the adaptation of review findings. The search specified studies in English only which may have resulted in studies of other languages being excluded. The studies also utilized several different methods for measurement of visual acuity and analysis of reading. These differing outcome measures resulted in the inability to draw comparisons across studies. Two studies did not specify visual acuity measures but were included due to a diagnosis of vision impairment, which may have biased some of the study results. As participant recruitment was either from specialist vision impairment schools or mainstream schools, the students from specialist schools may have received more specialist vision support within the classroom which may have additionally biased results obtained.
Conclusion and future directionsThe evidence surrounding educational outcomes for vision impaired children is limited by the level of available studies. The inability to synthesize results makes it difficult to form a quantitative appraisal of the current literature and a definitive answer to this review question. Although the studies included in this review indicate that reading and literacy skills for vision impaired students lag behind their normally sighted peers in terms of reading speed, a comprehensive longitudinal study would provide more substantial evidence and inform educators surrounding areas of need.
One potential future direction could be a standardised functional assessment aimed at identifying specific visual deficits and abilities within the classroom, then using individualised intervention approaches aimed at increasing independent accessibility skills.
A second potential future direction could be then categorising childhood vision impairment based on functional ability. A system which enables the provision of in-depth information on a child's visual ability would be invaluable to educators and parents. It would provide educators with more information surrounding the difficulties a vision impaired child faces accessing educational information, enabling teachers to address these issues and help reduce the gap between them and normally sighted peers. A recent case study highlighted that an assessment of functional vision and tailored supports improved accessibility to the curriculum in the classroom for a student with cone dystrophy.20 This ideally should be enabled at an early age to develop early literacy skills, encourage independent accessibility skills and build the foundations required for continuing education or employment.38
This research received no specific grant from any funding agency in the public, commercial, or not-for-profit sectors. The authors thank Ms Josephine McGill, Research Services Librarian, Flinders University, for help with refining the search strategy.


