


To compare the central and peripheral visual performance of myopic and emmetropic eyes.
MethodsThirty emmetropic (−0.50 to +0.50D) and 60 myopic (−2.00 to −9.62D) subjects were recruited. Resolution acuity was assessed at central and 12 peripheral retinal locations (±10°, ±20°, ±30° along the horizontal meridian, and ±10°, ±20°, ±25° along the vertical meridian) using a modified version of the Contrast Acuity Assessment test at low (δl/l=14%) and high (δl/l=100%) contrast levels. The central and peripheral data were analysed using univariate and repeated-measures analysis of variance respectively. In addition, asymmetries in visual function, along both the horizontal (temporal versus nasal) and vertical (superior versus inferior) meridians, were investigated.
ResultsWhen analysed in terms of acuity fall-off with eccentricity, repeated measures ANOVA exhibited a statistically significant difference in peripheral visual performance between refractive groups for high contrast stimuli (p=0.025), with a more rapid fall-off in myopes compared to emmetropes. Nasal and superior retinal regions performed better than temporal (high contrast: p<0.001, low contrast: p<0.001) and inferior (high contrast: p<0.001, low contrast: p=0.003) regions for both refractive groups, consistent with differences between quadrants in neural cell density reported by histological studies.
ConclusionThe myopic patients evaluated in this study exhibited reduced peripheral visual performance compared to their emmetropic counterparts when assessed using the Contrast Acuity Assessment test at high contrast level.
Comparar el rendimiento visual central y periférico en ojos miopes y emétropes.
MétodosSe seleccionaron treinta pacientes emétropes (de -0,50 a +0,50 D) y 60 miopes (de -2,00 a -9,62 D). Se evaluó la agudeza de resolución central y en 12 localizaciones retinianas periféricas (±10°, ±20°, ±30° a lo largo del meridiano horizontal, y ±10°, ±20°, ±25° a lo largo del meridiano vertical), utilizando una versión modificada de la prueba de Evaluación de la Agudeza de Contraste a niveles de contraste bajo (δl/l=14%) y alto (δl/l=100%). Se analizaron los datos centrales y periféricos utilizando análisis univariante y análisis de la varianza de medidas repetidas, respectivamente. Además, se estudiaron las asimetrías de la función visual, a lo largo de los meridianos horizontal (temporal frente a nasal) y vertical (superior frente a inferior).
ResultadosAl analizar la disminución de agudeza con la excentricidad, el análisis de medidas repetidas ANOVA mostró una diferencia estadísticamente significativa del rendimiento visual periférico entre los grupos refractivos para los estímulos de alto contraste (p=0,025), con una disminución más rápida en los pacientes miopes con respecto a los emétropes. Las regiones nasal y superior de la retina mostraron un rendimiento mejor que las regiones temporal (alto contraste: p<0,001, bajo contraste: p<0,001) e inferior (alto contraste: p<0.001, bajo contraste: p=0,003) para ambos grupos refractivos, algo que es consistente con las diferencias entre cuadrantes en cuanto a densidad celular neuronal, reportadas en estudios histológicos.
ConclusiónLos pacientes miopes evaluados en este estudio mostraron una reducción del rendimiento visual periférico en comparación a sus homólogos emétropes al ser evaluados utilizando la prueba de Evaluación de la Agudeza de Contraste a nivel alto de contraste.
Myopia is a common refractive condition of increasing prevalence1,2 in which the image of a distant object is brought into focus anterior to the retina, resulting in a blurred retinal image. Myopia has been recognised as a major cause of visual impairment internationally with considerable socioeconomic implications in many countries.3 Axial elongation of the vitreous chamber is well-established as the principle structural correlate of myopia.4–6 Structural changes secondary to myopia lead to reduced retinal cell density and enlarged photoreceptor inner segments,7 thinning8,9 and stretching of the retina.10 However, previous attempts to quantify the impact of these anatomical changes on central and peripheral visual performance compared to emmetropic eyes have produced conflicting results. A number of psychophysical and electrophysiological studies have reported that reduced neural sampling density associated with stretching forces on the retina may reduce central and/or peripheral visual performance in corrected axially myopic eyes,7,9–18 however others have found no such difference.19,20
It has also been hypothesised that the optical quality of myopic eyes is poorer than that of emmetropic eyes; some studies have shown that myopes exhibit increased higher order aberrations compared to emmetropes,21,22 whereas other investigators have found no difference between refractive groups in terms of optical quality.23–25 Reduced optical quality would be manifest as a reduction in contrast sensitivity, and hence reduced visual performance in myopic individuals.26
It should be noted that the results of different studies are not easily comparable, due to the differing experimental conditions, range of myopia and retinal locations examined. In addition, for a meaningful comparison of spatial visual performance between studies, the spectacle minification of negative corrective lenses should be accounted for. The aim of this experiment was to test the hypothesis that myopes have reduced resolution acuity compared to emmetropes. Assessment of visual performance involved measuring central and peripheral resolution acuity (target size threshold) at both high (100%) and low (14%) contrast levels, using a customised computer-based psychophysical test.27 In addition, we studied asymmetrical differences in resolution acuity along the vertical (superior versus inferior) and horizontal (nasal versus temporal) meridians of the retina. To the best of our knowledge, this study was the first to evaluate high and low contrast resolution acuity across a wide range of retinal eccentricities along both the horizontal and vertical meridians in emmetropic and myopic adults.
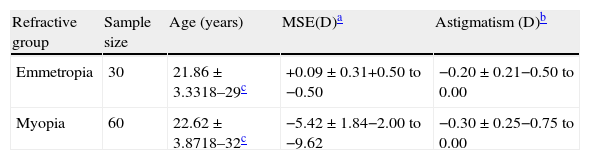
MethodsStudy populationSixty myopic (defined as a mean spherical equivalent refraction of −0.75D or worse, mean±SD, −5.42±1.84) and 30 emmetropic (defined as a mean spherical equivalent between −0.50 and +0.50D, mean±SD, +0.09±0.31) volunteers were recruited from the University of Bradford student population. Each participant was refracted at 6m to determine their subjective refraction using the standard approach of highest plus/lowest minus spherical power and cross-cylinder determination of cylinder power and axis. Best-corrected visual acuity was measured for the dominant eye of each participant using a high contrast Bailey–Lovie logMAR acuity chart, to ensure all subjects achieved 0.00 logMAR or better. Any potential participants with more than 0.75D of astigmatism were excluded from the study. A detailed ocular history was taken from each participant. None had ocular findings considered to be abnormal, and those with any kind of ocular or systemic disease and abnormal fundus changes that might influence visual function were excluded, confirmed by fundus photography and ophthalmoscopic examination prior to the experiment. The axial length and corneal radius of curvature were also measured using the IOLMaster biometer (Carl Zeiss Ltd, Herts, UK), for which the accuracy and repeatability have previously been demonstrated.28 The complete profile of participants is shown in Table 1.
Study group profiles. Data are expressed as the mean±standard deviation, with the range.
Informed consent was obtained from each participant after explanation of the nature and possible consequences of the study. The experiment followed the tenets of the Declaration of Helsinki and was approved by the Research Ethics Committee of the University of Bradford.
ApparatusAll experiments were run on the P-SCAN 100 system,29 which allows presentation of visual stimuli at a specified contrast level and target size, on a 21in. high-resolution Sony Trinitron monitor (model 500PS). The luminance of the adapting background was set at 12cd/m2. Regular calibration of the luminance characteristics of the stimulus monitor was undertaken using a luminance calibration program (Lumcal) in combination with a Minolta luminance meter (CS-100A). The monitor was allowed to warm up for a minimum of 30minutes before each experimental session to ensure a stable luminance output. The test was performed in a completely darkened room with the only light originating from the experimental display and fixation monitoring display which were not visible to the participant.
Experimental designA modified version of the Contrast Acuity Assessment test was used.27 Central and peripheral resolution acuities were measured for a Landolt C target, presented at each of 13 randomly interleaved retinal locations (±30°, ±20°, ±10°, and 0° along the horizontal meridian, and ±25°, ±20°, ±10° along the vertical meridian). A fixation point was presented at the required pre-calculated position to allow measurement at the different retinal positions, and was surrounded by four oblique guides to help maintain fixation. Participants were asked to press one of four response buttons to indicate the position of the gap in an obliquely orientated Landolt C ring target (i.e. upper left, upper right, lower left and lower right; four-alternative, forced-choice procedure, 4AFC). Identification of the target orientation required discrimination of the gap, which was 1/5th of the total ring diameter. The size of the Landolt C target (and hence the gap) was varied using an adaptive staircase method, 1 up–2 down.30 The size threshold was calculated as the average of 12 out of 16 reversals (initial four reversals were discarded). The exposure duration of the target was set at 120ms (including a rise time of 53ms) to ensure that performance would not benefit from saccadic eye movements.31
Measurements were made at two different contrast levels, high (100%) and low (14%) (specified as Weber contrast (Lb−Lt)/Lb where Lt and Lb indicate the luminance of the target and luminance of the background respectively). The display was viewed monocularly at a distance of 28cm. The only exception was high contrast foveal measurements, which were conducted at a viewing distance of 100cm, to circumvent the issue of limited screen resolution for the small, central target size. Therefore, for each participant, the experiment was conducted in five different test runs (horizontal high contrast, vertical high contrast, horizontal low contrast, vertical low contrast and central high contrast) which were usually scheduled for two separate visits. The order of testing of the five test conditions was randomised among participants. All the measurements were made on the participant's dominant eye with a natural pupil, while the non-dominant eye was patched. Special precautions were taken to ensure that fixation was maintained throughout the experimental session and the observer's eye was monitored using a video camera to determine whether any wavering of fixation occurred. Observers were encouraged to take breaks at their discretion to minimise fatigue. Total time taken to complete the psychophysical experiments was approximately two hours for each participant. All measured retinal locations of the test target and fixation point are shown in Fig. 1.
Spectacle lens fitting protocol
The dominant eye of each participant was corrected with a custom made meniscus (38mm diameter CR39) spectacle lens to fit a half-eye drop cell trial frame combined with an appropriate near addition for the stimulus distance to minimise accommodative fatigue. One problem in correcting refractive errors is that the corrective lens can change the retinal image size. According to Knapp's Law, if the correcting lens is placed at the eye's anterior focal plane of an axial ametropic individual, the axial retinal image size will be the same as that of an emmetropic eye.9,10 Therefore, in this experiment we placed all correcting lenses as close as possible to this point, 16–17mm in front of the eye's anterior principal plane (about 1.5mm inside the eye), to avoid different image sizes, at least for central vision.
It should be noted that peripheral measurements were affected to a small degree by the prismatic effect of the correcting lens, causing a deviation from the desired retinal location which varied with the power of the lens. Since each participant required a different lens power, the actual stimulus angular eccentricity as a function of refractive error was calculated, using the Prentice's rule, to determine an approximate retinal position of each image for each participant.
Data analysisIn order to allow an accurate analysis for the variable eccentricities between participants (Table 2), the rate of decrease in resolution acuity with eccentricity (acuity decline) was calculated by fitting a regression line to the threshold data and calculating the slope on either side of the fovea for each individual subject. The intercept was set to the foveal threshold in each condition to allow asymmetry along each tested meridian to be examined.
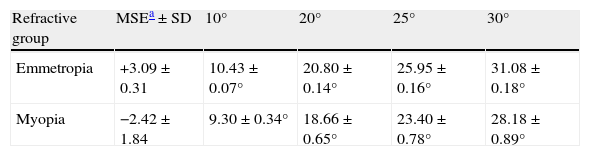
Average actual angular eccentricities (corrected for prismatic effect) for emmetropic and myopic eyes.
| Refractive group | MSEa±SD | 10° | 20° | 25° | 30° |
| Emmetropia | +3.09±0.31 | 10.43±0.07° | 20.80±0.14° | 25.95±0.16° | 31.08±0.18° |
| Myopia | −2.42±1.84 | 9.30±0.34° | 18.66±0.65° | 23.40±0.78° | 28.18±0.89° |
Statistical analysis was performed using the SPSS program version 17 (SPSS Inc. Chicago, IL, USA), considering the actual angular eccentricity and slope for each individual subject. For convenience, graphical illustrations in the result show the average slopes (Table 3) for each refractive group.
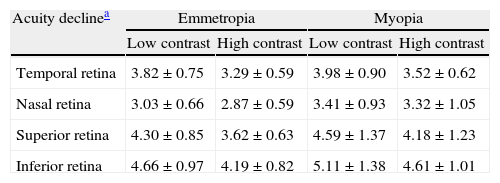
Acuity decline rates for each semi-meridian (mean±standard deviation).
| Acuity declinea | Emmetropia | Myopia | ||
| Low contrast | High contrast | Low contrast | High contrast | |
| Temporal retina | 3.82±0.75 | 3.29±0.59 | 3.98±0.90 | 3.52±0.62 |
| Nasal retina | 3.03±0.66 | 2.87±0.59 | 3.41±0.93 | 3.32±1.05 |
| Superior retina | 4.30±0.85 | 3.62±0.63 | 4.59±1.37 | 4.18±1.23 |
| Inferior retina | 4.66±0.97 | 4.19±0.82 | 5.11±1.38 | 4.61±1.01 |
For ease of comparison, the absolute values of slopes (without regard to their sign) were considered.
Repeated-measures analysis of variance (ANOVA) was performed to directly compare the acuity decline for the four meridians (nasal, temporal, superior and inferior peripheral retinae) across two refractive groups, for both the high and low contrast data. The same statistical analysis was used to investigate the asymmetrical differences in visual performance slope along both the horizontal and the vertical meridians (nasal versus temporal and superior versus inferior). Mauchly's test was used to test for sphericity, and the Greenhouse–Geisser correction was applied if significant differences were found. Foveal visual performance was also compared separately between groups by applying a univariate analysis of variance to the data. The level of significance was set at p values<0.05.
ResultsOf the 90 participants recruited, central and peripheral visual performance data were available for 86 participants. Four outliers were identified because they were unable to maintain stable fixation for the duration of the experiment as detected by the gaze tracking camera. Axial length and corneal curvature for each participant was compared with their mean spherical refractive error. Axial lengths ranged from 22.82 to 28.38mm and corneal radius of curvatures ranged from 7.18 to 8.19mm. There was a significant correlation between axial length and mean spherical refraction (r=0.89; p<0.0001) while the relationship between corneal curvature and refraction did not quite reach statistical significance (r=0.26; p=0.06). Thus, we can conclude that the refractive errors of our sample were primarily axial in nature.
Central visual performanceFigs. 2 and 3 illustrate the changes in foveal visual performance between refractive groups for both high and low contrast targets. Although there is a trend towards higher thresholds with increasing myopic refractive error, for high contrast acuity in particular, the effect of refractive group was not statistically significant at either high (F(1, 84)=1.228, p=0.271) or low (F(1, 84)=0.560, p=0.456) contrast. Regression analysis also demonstrated a non-significant trend towards higher thresholds with increasing degree of myopia.


Figs. 4–7 illustrate the mean target size thresholds for peripheral resolution acuity at low (14%) and high contrast (100%) for each refractive group. The average actual angular eccentricities of each Landolt C ring stimulus (due to the prismatic effect) for each refractive group are presented in Table 2. This variability between refractive groups in stimulus locations was statistically significant at all eccentricities (p<0.001), and hence the need to compare rate of acuity fall-off rather than actual threshold values.
 up to ±30° in the horizontal meridian for low contrast level (δl/l=14%). Error bars show one standard deviation. X-axis data are based on the average actual angular eccentricity presented in Table 2.")
Mean target size thresholds (minutes of arc) up to ±30° in the horizontal meridian for low contrast level (δl/l=14%). Error bars show one standard deviation. X-axis data are based on the average actual angular eccentricity presented in Table 2.
 up to ±25° in the vertical meridian for low contrast level (δl/l=14%). Error bars show one standard deviation. X-axis data are based on the average actual angular eccentricity presented in Table 2.")
Mean target size thresholds (minutes of arc) up to ±25° in the vertical meridian for low contrast level (δl/l=14%). Error bars show one standard deviation. X-axis data are based on the average actual angular eccentricity presented in Table 2.
 up to ±30° in the horizontal meridian for high contrast level (δl/l=100%). Error bars show one standard deviation. X-axis data are based on the average actual angular eccentricity presented in Table 2.")
Mean target size thresholds (minutes of arc) up to ±30° in the horizontal meridian for high contrast level (δl/l=100%). Error bars show one standard deviation. X-axis data are based on the average actual angular eccentricity presented in Table 2.
 up to ±25° in the vertical meridian for high contrast level (δl/l=100%). Error bars show one standard deviation. X-axis data are based on the average actual angular eccentricity presented in Table 2.")
Mean target size thresholds (minutes of arc) up to ±25° in the vertical meridian for high contrast level (δl/l=100%). Error bars show one standard deviation. X-axis data are based on the average actual angular eccentricity presented in Table 2.
A monotonic pattern of reduction in visual performance with increasing eccentricity was seen in all cases (Figs. 4–7). Repeated measures ANOVA showed a significant main effect of eccentricity along the horizontal and vertical meridians for both contrast levels, in both refractive groups (p<0.001). It is worth noting that a number of outliers were identified at the 20° nasal eccentricity among the more highly myopic participants for both high and low contrast thresholds, due to the target gap overlapping the optic disc region at some orientations. High myopia is often associated with a large and sometimes tilted optic disc, together with peripapillary atrophy.32 The involvement of the disc was confirmed in this subset of participants by examination of the fundus photographs. These outliers were excluded from the graphs, slope calculations and the subsequent data analyses for both contrast levels.
Considering all four semi-meridional slopes together, repeated measures ANOVA with one between-subject factor (two refractive groups) and one within-subject factor (four meridional slopes) showed a statistically significant difference in visual performance fall-off between refractive groups for high contrast resolution acuity thresholds (F(1, 84)=5.235, p=0.025). However, no significant difference in resolution acuity between groups was noted for low contrast (F(1, 84)=2.717, p=0.103).
Considering each meridian in turn (two semi-meridian slopes as the within-subjects factor and two refractive groups as the between-subjects factor) also revealed a significant difference between refractive groups in terms of visual performance fall-off for high contrast (horizontal: F(1, 84)=4.576, p=0.035, vertical: F(1, 84)=4.603, p=0.035) but a non-significant difference in visual performance fall-off for low contrast resolution acuity (horizontal: F(1, 84)=2.247, p=0.138, vertical: F(1, 84)=1.996, p=0.161).
Regarding the data as a whole, ANOVA revealed a significant main effect for semi-meridian, both at high (F(2.70, 226.35)=82.081, p<0.001) and low (F(2.57, 216.47)=61.095, p<0.001) contrast, with the nasal retina performing best (slower decline) and the inferior retina exhibiting the most rapid fall-off in visual performance (Table 3). The interactions between semi-meridian and refractive group failed to reach statistical significance for both high (F=0.986, p=0.394) and low (F=0.351, p=0.757) contrasts.
Asymmetry in fall-off of peripheral visual performanceSignificant asymmetry in visual performance fall-off was observed along both horizontal and vertical meridians for each refractive group, at both high and low contrast levels. Considering acuity decline values, the nasal retina performed better than the temporal retina (high contrast: F(1, 84)=15.065, p<0.001, low contrast: F(1, 84)=55.791, p<0.001) and the superior retina exhibited better performance than the inferior retina (high contrast: F(1, 84)=38.014, p<0.001, low contrast: F(1, 84)=9.481, p=0.003). This relationship was the same for both refractive groups and the interaction between slopes and refractive group failed to reach statistical significance, for both the horizontal (high contrast: F=1.538, p=0.218 and low contrast: F=0.831, p=0.365) and vertical (high contrast F=0.775, p=0.381 and low contrast: F=0.325, p=0.570) meridians.
DiscussionThis study considered the effect of refractive error on central and peripheral visual performance. One important and novel aspect of our experimental method was that it allowed us to examine peripheral resolution acuity over a wide range of retinal locations along both the horizontal and vertical meridians, providing a more comprehensive evaluation of visual function compared to previous studies. To avoid the potentially confounding effects of age on visual performance, our study participants were carefully matched for age between refractive groups, with a limited age range. A decrease in visual performance (and greater variation) with age has been reported in the past,33–35 which has been attributed to changes in retinal neurons36,37 and/or the optical quality of the eye (increased intraocular light scatter and higher order aberrations).38,39
Visual performance as a function of refractive errorThe expected decline in visual performance (increase in size thresholds) with increasing eccentricity was seen for both emmetropic and myopic groups, at both high and low contrast levels. This is a well-documented observation across a range of psychophysical tasks,40–42 and relates to the decline in the density of retinal cells43,44 and greater neural pooling in the periphery.45
Our data showed no evidence of a decline in foveal resolution acuity at either contrast level between myopes and emmetropes, in support of the previous findings by some studies.17,19,20,46 Our findings, however, illustrated a significantly steeper fall-off in peripheral resolution acuity threshold with eccentricity in myopes compared to emmetropes at high contrast, in support of previous studies of absolute resolution thresholds.10–12,17 The results of our experiments are in agreement with previous studies, that the peripheral retinal function (for high contrast stimuli) is vulnerable, whereas central visual performance seems to be somewhat preserved in myopic eyes compared to emmetropic eyes, at least for the range of myopia considered in this study. For example, Vera-Diaz and colleagues reported that orientation discrimination in myopic eyes was only mildly changed at the fovea but was noticeably reduced at 15° retinal eccentricity.17 Another more recently published study employed an electroretinogram to study retinal function in myopic eyes. Likewise, this study found that reduced retinal function in myopic eyes was more pronounced from 10° to 26° of the visual field rather than in the foveal region.47 The aforementioned results can be explained partly by the previous observations of reduced thickness of the peripheral retina, compared to the central retina, which is more pronounced in myopic eyes.48,49 Greater thinning in the peripheral than in the central retina may be a compensatory mechanism for the stretching forces over the entire retina, and would consequently preserve the more important central macular thickness.50 It is possible that the peripheral retinal neurons may be damaged as a result of retinal thinning, which in turn affects the peripheral visual performance.47 These observations in addition to the axial nature of ocular expansion, exhibited by a large proportion of myopic eyes,51 may partly explain why visual performance in the peripheral retina of myopic eyes was more affected than the central function.
Our findings of reduced high contrast acuity were also predicted by the sampling-limited theorem of resolution acuity, because of the lower density of neural cells at a given eccentricity in axial myopes compared to emmetropic individuals, secondary to retinal stretching.52,53 These changes, in addition to the possibility of the aforementioned neural cell damage or loss,9 could lead to reduced peripheral visual function in myopia.
It is worth noting that our work did not consider the most highly myopic individuals (>−10D), for whom the best corrected foveal visual performance tends to be limited by the increase in the cone spacing52,54 and inner retinal neurons.55 Furthermore, limiting our participants’ myopic refractive range eliminated any major retinal pathology related to high myopia. Our findings in the foveal region are in apparent conflict with the report of Fiorentini and Maffei,13 who demonstrated significant reductions in the contrast sensitivity for high myopes. However, they investigated the visual performance for only 10 myopes, and the mean spherical equivalent of their study population was considerably higher than our study and they did not apply Knapp's Law or make any other adjustment for spectacle magnification. It is likely that some previous studies found reduced foveal acuity in myopia due to the inclusion of very highly myopic individuals in their studies. Limiting our study population to studying a limited range of myopes eliminated this possibility.
Disparities between study outcomes will stem from differences in assessment technique, including illumination level and hence pupil diameter, the range of myopia being considered, sample size and the retinal locations examined. In addition, it is not possible to determine whether the reduced visual performance in high myopes reported by some studies, related to retinal changes or spectacle minification as few studies attempted to correct for this factor. In this study, all axial myopic subjects were corrected with a large, meniscus-form spectacle lens placed at the anterior focal plane of the eye, in an attempt to provide equal relative retinal image magnification between subjects.56 This technique can only be applied in full at the fovea but the difference in spectacle magnification at peripheral eccentricities would have been minimal.
Using a low contrast target, we failed to find a significant difference in visual function fall-off with eccentricity. This is not surprising since responses to larger low contrast targets are more variable particularly in the case of this experiment, as the mean target size needs to be averaged over a larger range of eccentricities. This is likely to be the principal reason for the increased variability of the peripheral low contrast visual performance data, and the reduced sensitivity of this test to detect differences in low contrast visual performance between refractive groups. It should be noted that even the well-focused emmetropic eye exhibits substantial spherical and cylindrical ametropia at peripheral retinal locations. The form and magnitude of peripheral aberrations varies widely within the normal population 57,58. It is impractical during such an experiment to correct the varying amounts of peripheral optical defocus at each eccentricity, particularly in view of the automatic interleaving of peripheral target locations during the testing procedure. Studies have shown both theoretically and experimentally that contrast sensitivity can change in humans with only a few dioptres of defocus for both central59,60 and peripheral61,62 visual tasks. Peripheral defocus, therefore, is likely to be another factor affecting both our low and high contrast results. Specifically, this factor can account for the increased variability of the peripheral low contrast visual performance data, and the reduced sensitivity of this test to detect differences in low contrast visual performance between refractive groups. Previous studies such as that from Anderson63 demonstrated experimentally that, as stimulus contrast level decreased to around 10%, the difference between resolution and detection acuity became smaller. He concluded that resolution acuity at low contrast levels is no longer sampling limited, and changes into being optically limited, decreasing with eccentricity at the same rate as the detection acuity.
Asymmetry in fall-off of visual performanceOur findings suggest that visual performance fall-off with eccentricity was less pronounced in the horizontal than in the vertical meridians, which may be explained by retinal topography; there is a higher density of retinal cells around the horizontal meridian.43,44 Asymmetry in visual function was demonstrated for both refractive groups, with a steeper fall-off in performance for the temporal than for the nasal, also steeper for the inferior than the superior retinae. Psychophysically, and consistent with our findings, asymmetrical differences in visual performance have been found for many visual tasks, including visual and resolution acuity,64,65 vernier acuity,66 contrast sensitivity67,68 and orientation discrimination.69 The major source of the asymmetry is thought to be anatomical; photoreceptors and ganglion cells demonstrate higher density in the nasal and superior retinae compared to the temporal and inferior retinae.43,44 In addition, according to our findings presented in Table 3, the inferior retina demonstrated the steepest fall-off in visual performance of all the retinal regions examined. The decline in visual performance of the inferior retina compared to other quadrants has previously been reported by threshold sensitivity measurements with perimetry.70,71
ConclusionIn conclusion, assessment at high contrast reveals a more rapid fall-off in visual performance with eccentricity in myopes compared to emmetropes. The difference in low contrast performance did not reach statistical significance, possibly relating to the greater variability of the data between and within individuals. In addition, analysis of the slope in functional decline with eccentricity revealed asymmetry between hemifields along both the horizontal and vertical meridians for emmetropes and myopes. The high contrast data suggest that the retinal neurons in myopic eyes are more widely spaced than those in emmetropic eyes.
Conflict of interestsThe authors have no conflict of interests to declare.


