

To examine a single-optic accommodating intraocular lens (IOL) visual performance by correlating IOL implanted eyes’ defocus curve with the intraocular aberrometric profile and the impact on the quality of life (QOL).
MethodsProspective consecutive case series study including a total of 25 eyes of 14 patients with ages ranging between 52 and 79 years old. All cases underwent cataract surgery with implantation of the single-optic accommodating IOL Crystalens HD (Bausch & Lomb). Distance and near visual acuity outcomes, intraocular aberrations, the defocus curve and QOL (NEI VFQ-25) were evaluated 3 months after surgery.
ResultsA significant improvement in distance visual acuity was found postoperatively (p=0.02). Mean postoperative LogMAR uncorrected near visual acuity was 0.44±0.23 (20/30). 60% of eyes had a postoperative addition between 0 and 1.5diopters (D). The defocus curve showed an area of maximum visual acuity for the levels of defocus corresponding to distance and intermediate vision (−1 to +0.5D). Postoperative intermediate visual acuity correlated significantly some QOL indices (r≥0.51, p≤0.03; difficulty in going down steps or seeing how people react to things that patient says) as well as with J0 component of manifest cylinder. Postoperative distance-corrected near visual acuity correlated significantly with age (r=0.65, p<0.01).
ConclusionsThis accommodating IOL seems to be able to restore the distance visual function as well as to provide an improvement in intermediate and near vision with a significant impact on patient's QOL, although limited by age and astigmatism. Future studies with larger sample sizes should confirm all these trends.
Examinar el rendimiento visual de una lente intraocular (LIO) acomodativa de óptica simple, utilizando la correlación entre la curva de desenfoque del ojo con implantación de LIO, el perfil aberrométrico intraocular y el impacto sobre la calidad de vida.
MétodosEstudio de una serie de casos consecutivos prospectivos que incluye a un total de 25 ojos de 14 pacientes con edades que oscilan entre 52 y 79 años. Todos los casos habían sido sometidos a cirugía de cataratas, con implantación de una lente acomodativa Crystalens HD (Bausch & Lomb). A los 3 meses de la cirugía se evaluaron los resultados correspondientes a la agudeza visual lejana y cercana, las aberraciones intraoculares, la curva de desenfoque y la calidad de vida (NEI VFQ-25).
ResultadosSe comprobó una mejora considerable de la agudeza visual lejana a nivel postoperatorio (p=0,02). La agudeza visual media LogMAR postoperatoria cercana no corregida era de 0,44±0,23 (20/30). El 60% de los ojos mostraba una adición postoperatorio de entre 0 y 1,5D. La curva de desenfoque mostraba un área de máxima agudeza visual para los niveles de desenfoque correspondientes a la visión lejana e intermedia (de −1 a +0,5D). La agudeza visual intermedia postoperatoria guardaba una correlación significativa con ciertos índices de calidad de vida (r≥0,51, p≤0,03; dificultad para bajar escaleras, o ver la reacción de las personas ante las cosas que el paciente dice) así como el componente J0 del cilindro manifestado. La agudeza visual cercana postoperatoria de la distancia corregida guardaba una correlación considerable con la edad (r=0,65, p<0,01).
ConclusionesEsta LIO acomodativa parece poder restaurar la función visual lejana, así como aportar una mejora de la visión intermedia y cercana, con un impacto considerable sobre la calidad de vida del paciente, aunque limitado a causa de la edad y el astigmatismo. Los futuros estudios con unos tamaños de muestra más amplios deberían confirmar estas tendencias.
Accommodating IOLs were developed with the aim of providing some functional near vision to patients after cataract surgery, avoiding the optical side effects of multifocal IOLs.1 The first developed and marketed accommodating IOLs were the single-optic positional IOLs whose mechanism of action is a theoretical forward axial movement of the optic with the ciliary muscle contraction that provides the required power for near vision. Different single-optic models have been developed and marketed, such as the Crystalens AT-45 (Eyeonics),2,3 the 1CU (HumanOptics)4–7 or the Tetraflex (Lenstec).2,8 It has been demonstrated that these preliminary models of accommodating IOLs provided very limited near visual outcomes.2–8 This was the main reason for the development of new models of accommodating IOLs, such as the dual-optic9 and other non-positional accommodating models.10
Implementations of the single-optic IOLs have been also introduced, such as the new model of the Crystalens IOL, the Crystalens HD High Definition (Bausch & Lomb). Specifically, a central biaspheric modification aimed at optimizing the depth of focus has been introduced in the design of this accommodating IOL. Better near visual outcomes in comparison with the preliminary single-optic models and an excellent intermediate visual acuity have been reported with this new IOL.11 Furthermore, it has been shown that the magnitude of intraocular aberrations of eyes implanted with this accommodating IOL was limited in spite of the optical modifications introduced in the design, especially for the primary spherical aberration.11 These outcomes were consistent with those obtained in optical bench experiences evaluating the optical performance of the Crystalens HD IOL.12 However, there are no studies evaluating the relationship of the postoperative intraocular aberrometric profile with the visual outcome and the impact on the patient's QOL and which are the limiting factors for the final outcome obtained with this accommodating IOL.
The aim of the current study was to examine this single-optic accommodating IOL (Crystalens HD) visual performance by correlating IOL implanted eyes’ defocus curve with the intraocular aberrometric profile and the impact on the QOL evaluated by means of a validated questionnaire.
Materials and methodsPatientsThis prospective consecutive case series study included a total of 25 eyes of 14 patients with ages ranging between 52 and 79 years old. All these eyes underwent cataract surgery with implantation of the accommodating IOL Crystalens HD (Bausch & Lomb). The inclusion criteria of this study were patients with visually significant cataract or presbyopic/pre-presbyopic patients suitable for refractive lens exchange and demanding complete spectacle-independence. The exclusion criteria were patients with active ocular diseases, illiteracy and topographic astigmatisms higher than 1.5D. All volunteers were adequately informed and signed a consent form. The study adhered to the tenets of the Declaration of Helsinki and was approved by the Local Ethical Committee.
Intraocular lensThe Crystalens HD (Bausch & Lomb) is a biconvex single optic accommodating IOL which is made of a biocompatible third-generation silicone (Biosil) with a refractive index of 1.42811. According to the manufacturer, it has theoretically a double mechanism for providing an enhanced near and intermediate visual functions: the axial movement of the optic with ciliary muscle changes and the variation of the radius of curvature of the anterior surface (arching optic). In addition, as previously commented, the IOL has a central biaspheric modification which is optimized to increase depth of focus. Two sizes are available depending on the required power: 12.0mm for 10–16.5D (HD520) and 11.5mm for 17–33D (HD500). The Crystalens HD is available in a range from 10.00 to 35.00D, with 0.25D increments between 18.00 and 22.00D. In the current study, the SRK/T formula was used in all cases for the IOL power calculation, with an A-constant value of 119. The IOL power providing plano postoperative refraction or near it was selected for implantation according to the IOL calculations.
SurgeryAll surgeries were performed by one of the two experienced surgeons (MLR and FJBM) using a standard technique of phacoemulsification. In all cases, topical anesthesia was administered and pupillary dilation was induced with a combination of tropicamide and phenylephrine 10% every 15min half an hour previous to the procedure. Iodine solution 5% was instilled on the eye 10min before the operation. A 2.75-mm clear incision was made with a diamond knife on the steepest meridian to minimize post-surgical astigmatism. A paracentesis was made 60–90° clockwise from the main incision and the anterior chamber was filled with viscoelastic material. After the crystalline lens removal, the IOLs were implanted through the incision into the capsular bag using a specific injector developed by the manufacturer for such purpose. Finally, the surgeon proceeded to retrieve the viscoelastic material using the irrigation-aspiration system. A combination of topical steroid and antibiotic (Tobradex, Alcon, Fort Worth, TX, USA) as well as a non-steroidal anti-inflammatory drops (Dicloabak, Laboratorios Thea, Barcelona, Spain) were prescribed to be applied four times daily for a week after the surgery and three times daily the second postoperative week. In addition, the non-steroidal anti-inflammatory drops were also prescribed to be applied three times daily during 2 weeks more after surgery.
Preoperative and postoperative examinationsPreoperatively, all patients had a full ophthalmologic examination including the evaluation of the refractive status, the distance and near visual acuities, slit lamp examination, optical biometry (IOL-Master, Zeiss) tonometry and funduscopy. Distance (4m) and near (40cm) visual acuities were evaluated with the ETDRS charts. Postoperatively, patients were evaluated at 1 day, 1 week, 1 month, and 3 months after surgery. In all visits, visual acuity, refraction and the integrity of the anterior segment were evaluated. Funduscopy was also performed in the postoperative revision at 3 months.
An additional postoperative visit was performed after this follow-up (mean time: 6.84±3.85 months, range 3–12 months after surgery) in order to measure the defocus curve and to evaluate the intraocular optical aberrations and the QOL by means of a validated questionnaire. The defocus curves were obtained to characterize the visual performance of each eye implanted with the evaluated IOL at different distances. The ETDRS charts were used for such purpose at a distance of 4m. These curves were obtained monocularly with the patient wearing the correction providing the best distance visual acuity. Plus lenses were added in 0.50D steps and the visual acuity was recorded for each type of blur. Afterwards, the same procedure was repeated but with negative lenses. All the recorded information was then represented in a 2-D graphic display using Cartesian coordinates (x-axis, spherical blur; y-axis, near visual acuity). Regarding, the intraocular aberrometric profile, it was determined by means of the iTrace system (Tracey Technologies Corp., Houston, TX, USA) under pharmacologically induced pupillary dilation (phenylephrine 10%). This system combines an aberrometer based on the principle of ray tracing for obtaining the wavefront aberrations of the eye13 and a Placido-based topographic system that provides the corneal aberration data. The software of the instrument (iTrace version 3.1) provided automatically the result of the subtraction of the corneal aberrations from the ocular wavefront aberrations which was the intraocular aberrometric profile. The following root mean square (RMS) values were calculated for a 5-mm pupil: primary coma RMS (computed for the Zernike terms Z3±1), coma-like RMS (computed for third, fifth, and seventh order Zernike terms), and spherical-like RMS (computed for fourth and sixth order Zernike terms). The corresponding Zernike coefficients for primary vertical coma (Z3−1), horizontal coma (Z3+1) and spherical aberration (Z40) were also reported with their sign. It should be noted that ocular aberrometric measurements were performed simulating distance visual conditions (far object viewing).
The QOL after surgery was evaluated by means of the NEI VFQ-25 questionnaire14,15 that consists of 25 items and a supplement of 14 additional items taken from the original 52-item NEI VFQ. Among the 39 items of the NEI VFQ-25 plus supplement, six ask patients to grade their general health and vision, twenty rate difficulties with activities, and thirteen ask about the level of agreement with statements describing the severity of problems associated with vision loss. The questions on difficulty with activities were rated on a 1-to-6 scale, with response choices including no difficulty, a little difficulty, moderate difficulty, extreme difficulty, stopped doing this because of your eyesight, and stopped doing this for other reasons/not interested. A rating response of 6 was scored as missing data. The questions on level of agreement with statements describing role limitations due to vision loss were rated on a 5-point scale ranging from agree all of the time to agree none of the time for five of the items and ranging from definitely true to definitely false for the remaining eight items. Two items in the supplement rated overall health and vision on a 0 (worst) to 10 (best) scale. It should be remarked that patients were asked with this test about the capability of doing things without any type of correction.
Refraction notationThe spherocylindrical refractions obtained before and after surgery were converted to vectorial notation using the power vector method described by Thibos and Horner.16 Using this procedure, any spherocylindrical refractive error can be expressed by 3 dioptric powers: M, J0 and J45, M being a spherical lens equal to the spherical equivalent of the given refractive error, and J0 and J45 two Jackson crossed cylinders equivalent to the conventional cylinder. These numbers are the coordinates of a point in a three-dimensional dioptric space (M, J0, J45). The length of this vector is a measure of the overall blurring strength B of a spherocylindrical refractive error.
According to the power vector method, manifest refractions in conventional script notation (S [sphere], C [cylinder]×φ [axis]) were converted to power vector coordinates and overall blurring strength (B) by the following formulas: M=S+C/2; J0=(−C/2)cos(2φ); J45=(−C/2)sin(2φ); and B=(M2+J02+J452)1/2.
Statistical analysisThe statistical analysis was performed using the SPSS statistics software package version 15.0 for Windows (SPSS, Chicago, IL, USA). As both eyes from each patient were considered for the statistical analysis, a mixed model analysis of variance (ANOVA)17 was used to test the statistical significance of the change between the preoperative and postoperative visits. In addition, partial correlations of different visual acuities from the defocus curve with the intraocular aberrometric and QOL data were investigated. The p-value obtained for each statistical test was corrected by means of the Bonferroni's adjustment.
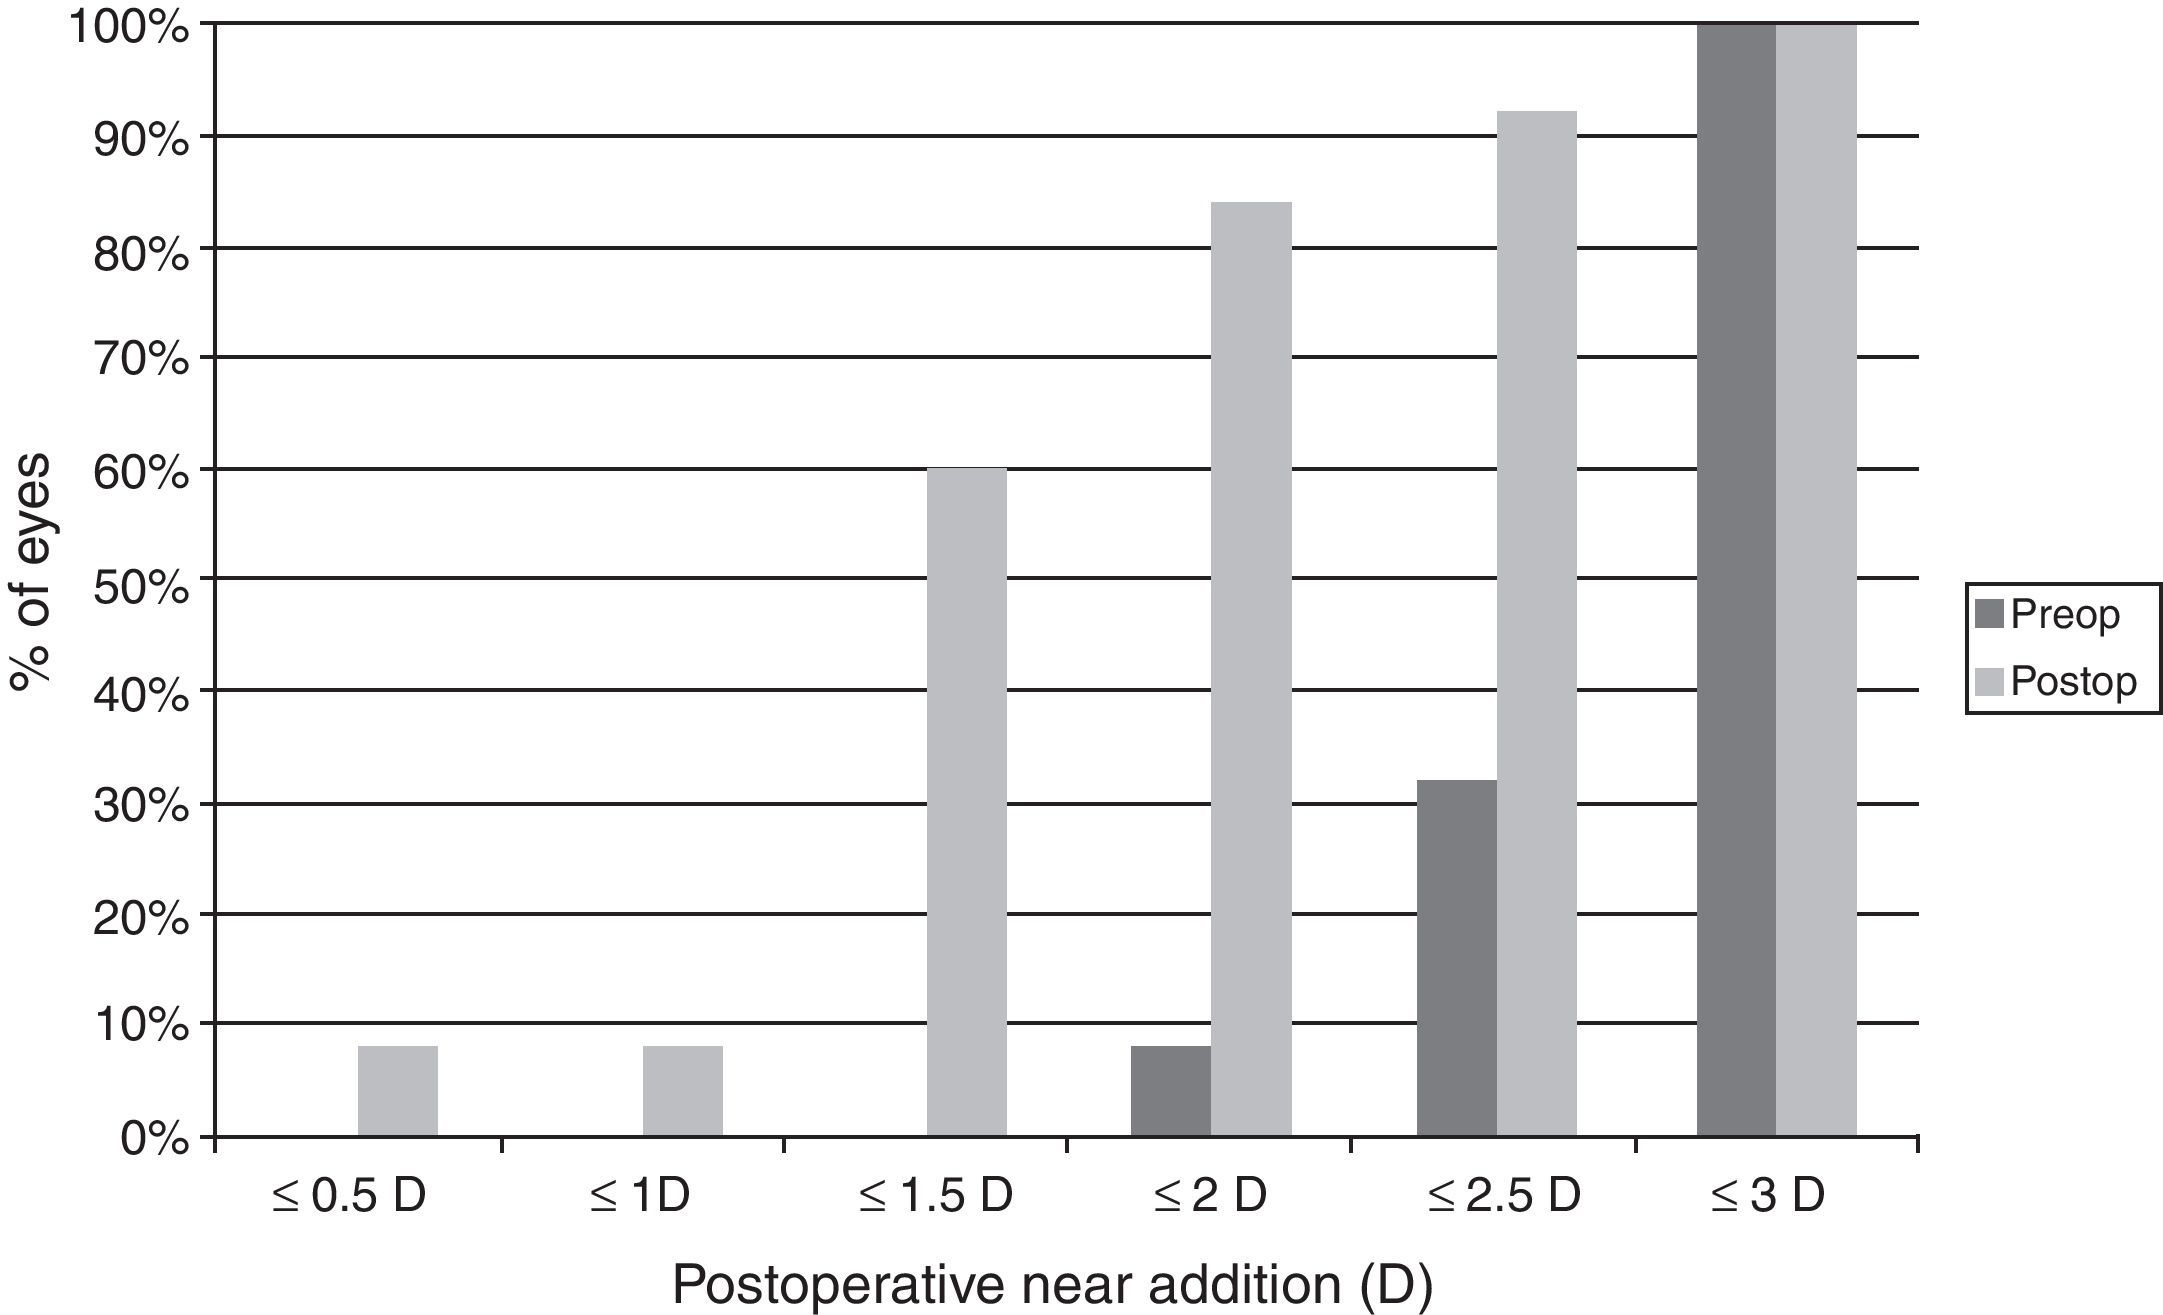
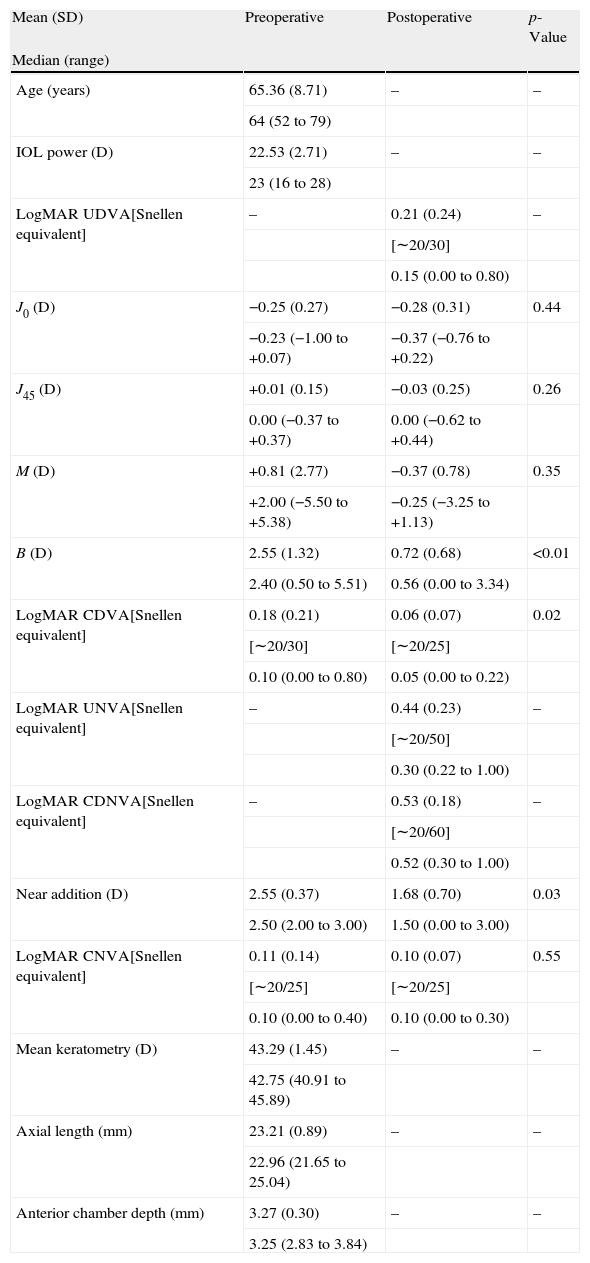
ResultsVisual and refractive outcomesAs shown in Table 1, a statistically significant improvement was found in corrected distance visual acuity (CDVA) (p=0.02), with a satisfactory uncorrected distance visual acuity (UDVA) outcome. A significant reduction of B was found after surgery (p<0.01). However, no significant changes were detected in M and the astigmatic power vector components of refraction (p≥0.26). Regarding near vision, mean postoperative UNVA and DCNVA (Distance-corrected near visual acuity) was around J4–J5 in Jaeger notation, ranging from J2 to J10 (Table 1). No significant change in CNVA was found postoperatively (p=0.55). Patients with DCNVA worse than 0.5LogMAR were significantly older (DCNVA 0.5 or better 61.1±7.2 vs. DCNVA worse than 0.5 73.8±6.3 years; p<0.01) and presented higher amounts of refractive astigmatism (DCNVA 0.5 or better J0: −0.18±0.20 vs. DCNVA worse than 0.5J0: −0.42±0.33D; p=0.04). Furthermore, a significant reduction in the addition required for near vision was found (p=0.03). There were only 4 cases (16%) requiring a near addition of more than 2D and 60% of eyes requiring an addition between 0 and 1.5D (Fig. 1). Patients with postoperative near addition of more than 1.50D presented larger amounts of preoperative refractive astigmatism (near addition of 1.50D or lower J0: −0.14±0.17 vs. near addition of more than 1.50D J0: −0.42±0.31D; p=0.01), with a trend to be older (near addition of 1.50D or lower 62.8±7.3 vs. near addition of more than 1.50D J0: 69.8±10.1 years; p=0.06).
Comparative table showing the preoperative and postoperative conditions of eyes undergoing cataract surgery with the implantation of the Crystalens HD IOL in the current study. The corresponding p-values for the comparison between the preoperative and postoperative data are shown for each parameter evaluated.
| Mean (SD) | Preoperative | Postoperative | p-Value |
| Median (range) | |||
| Age (years) | 65.36 (8.71) | – | – |
| 64 (52 to 79) | |||
| IOL power (D) | 22.53 (2.71) | – | – |
| 23 (16 to 28) | |||
| LogMAR UDVA[Snellen equivalent] | – | 0.21 (0.24) | – |
| [∼20/30] | |||
| 0.15 (0.00 to 0.80) | |||
| J0 (D) | −0.25 (0.27) | −0.28 (0.31) | 0.44 |
| −0.23 (−1.00 to +0.07) | −0.37 (−0.76 to +0.22) | ||
| J45 (D) | +0.01 (0.15) | −0.03 (0.25) | 0.26 |
| 0.00 (−0.37 to +0.37) | 0.00 (−0.62 to +0.44) | ||
| M (D) | +0.81 (2.77) | −0.37 (0.78) | 0.35 |
| +2.00 (−5.50 to +5.38) | −0.25 (−3.25 to +1.13) | ||
| B (D) | 2.55 (1.32) | 0.72 (0.68) | <0.01 |
| 2.40 (0.50 to 5.51) | 0.56 (0.00 to 3.34) | ||
| LogMAR CDVA[Snellen equivalent] | 0.18 (0.21) | 0.06 (0.07) | 0.02 |
| [∼20/30] | [∼20/25] | ||
| 0.10 (0.00 to 0.80) | 0.05 (0.00 to 0.22) | ||
| LogMAR UNVA[Snellen equivalent] | – | 0.44 (0.23) | – |
| [∼20/50] | |||
| 0.30 (0.22 to 1.00) | |||
| LogMAR CDNVA[Snellen equivalent] | – | 0.53 (0.18) | – |
| [∼20/60] | |||
| 0.52 (0.30 to 1.00) | |||
| Near addition (D) | 2.55 (0.37) | 1.68 (0.70) | 0.03 |
| 2.50 (2.00 to 3.00) | 1.50 (0.00 to 3.00) | ||
| LogMAR CNVA[Snellen equivalent] | 0.11 (0.14) | 0.10 (0.07) | 0.55 |
| [∼20/25] | [∼20/25] | ||
| 0.10 (0.00 to 0.40) | 0.10 (0.00 to 0.30) | ||
| Mean keratometry (D) | 43.29 (1.45) | – | – |
| 42.75 (40.91 to 45.89) | |||
| Axial length (mm) | 23.21 (0.89) | – | – |
| 22.96 (21.65 to 25.04) | |||
| Anterior chamber depth (mm) | 3.27 (0.30) | – | – |
| 3.25 (2.83 to 3.84) |
Abbreviations: SD, standard deviation; D, diopters; IOL, intraocular lens; UDVA, uncorrected distance visual acuity; J0 and J45, power vector components of manifest cylinder; M, spherical equivalent; B, overall blurring strength of the manifest spherocylindrical error; CDVA, corrected distance visual acuity; UNVA, uncorrected near visual acuity; CDNVA, corrected-distance near visual acuity; CNVA, corrected near visual acuity.

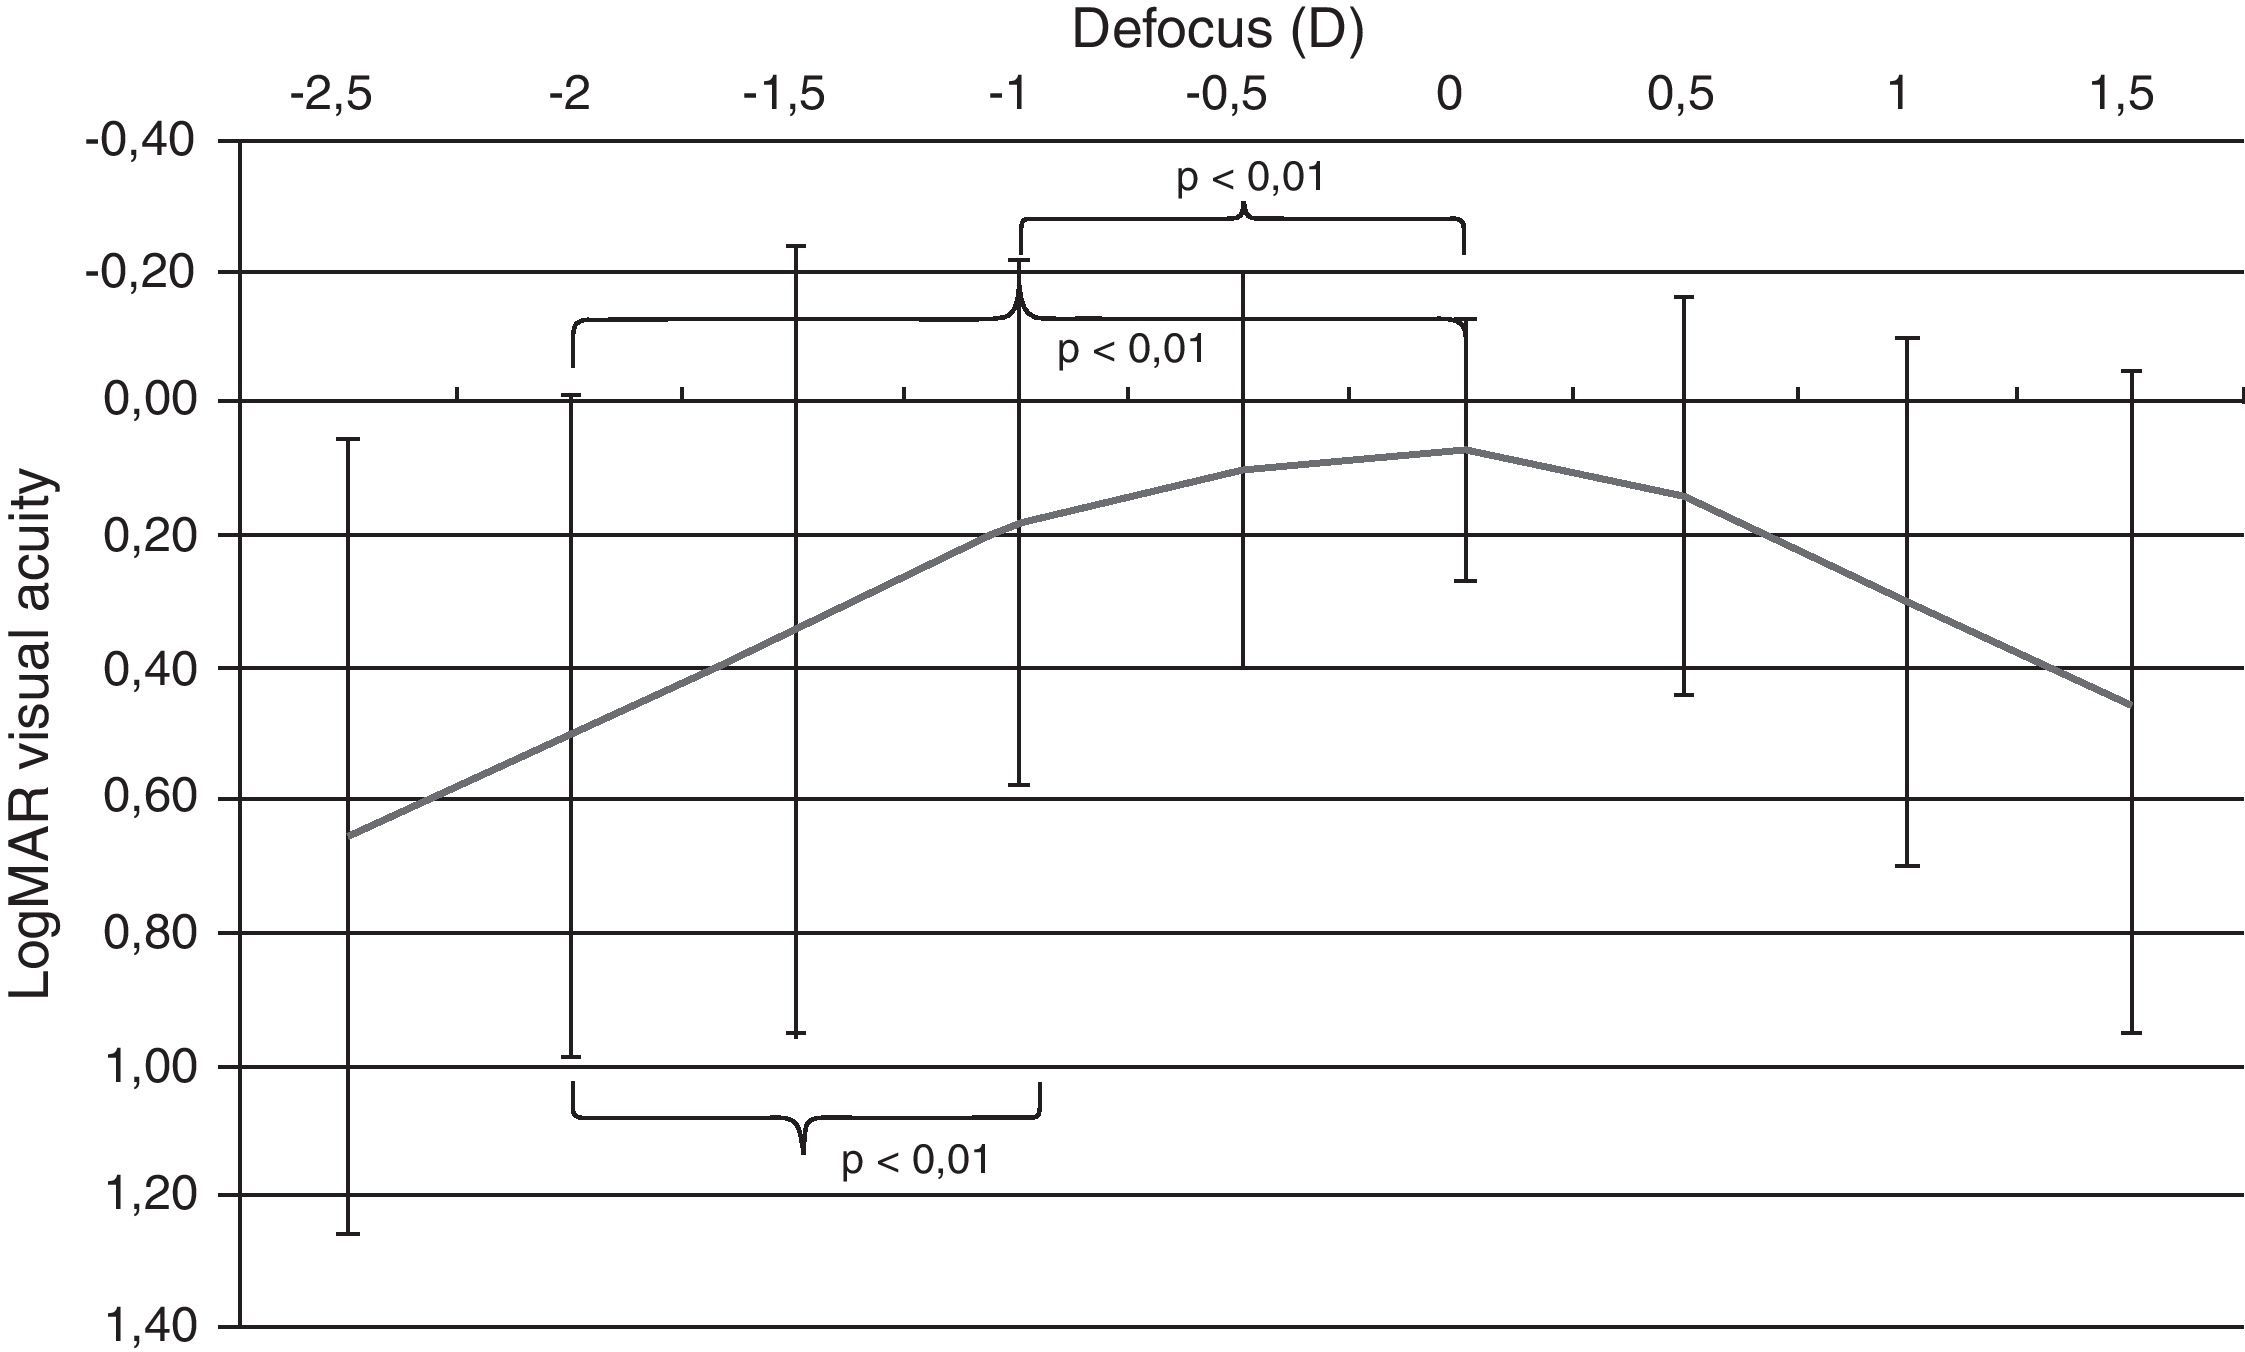
An area of maximum visual acuity (better than 0.2) could be easily distinguished in the mean defocus curve (Fig. 2) corresponding to distance and intermediate visual condition (range −1 to +0.5D of defocus). The statistical analysis of the defocus curve results revealed that significantly better visual acuity was present for distance conditions (no defocus) compared to intermediate (−1D, p<0.01) and near vision (−2D, p<0.01) conditions. Furthermore, significant differences were found among the visual acuities for intermediate and near vision conditions (p<0.01), with the better outcome for the defocus level corresponding to intermediate vision (Fig. 3).
–intermediate (−1D), distance (0D)–near (−2D), and intermediate (−1D)–near (−2D).")
Median defocus curve in the group of eyes analyzed in the current study. The error bars represents the range associated to each median value. The p-values of the following comparisons between visual acuities corresponding to different defocus levels simulating different visual conditions are shown: distance (0D)–intermediate (−1D), distance (0D)–near (−2D), and intermediate (−1D)–near (−2D).
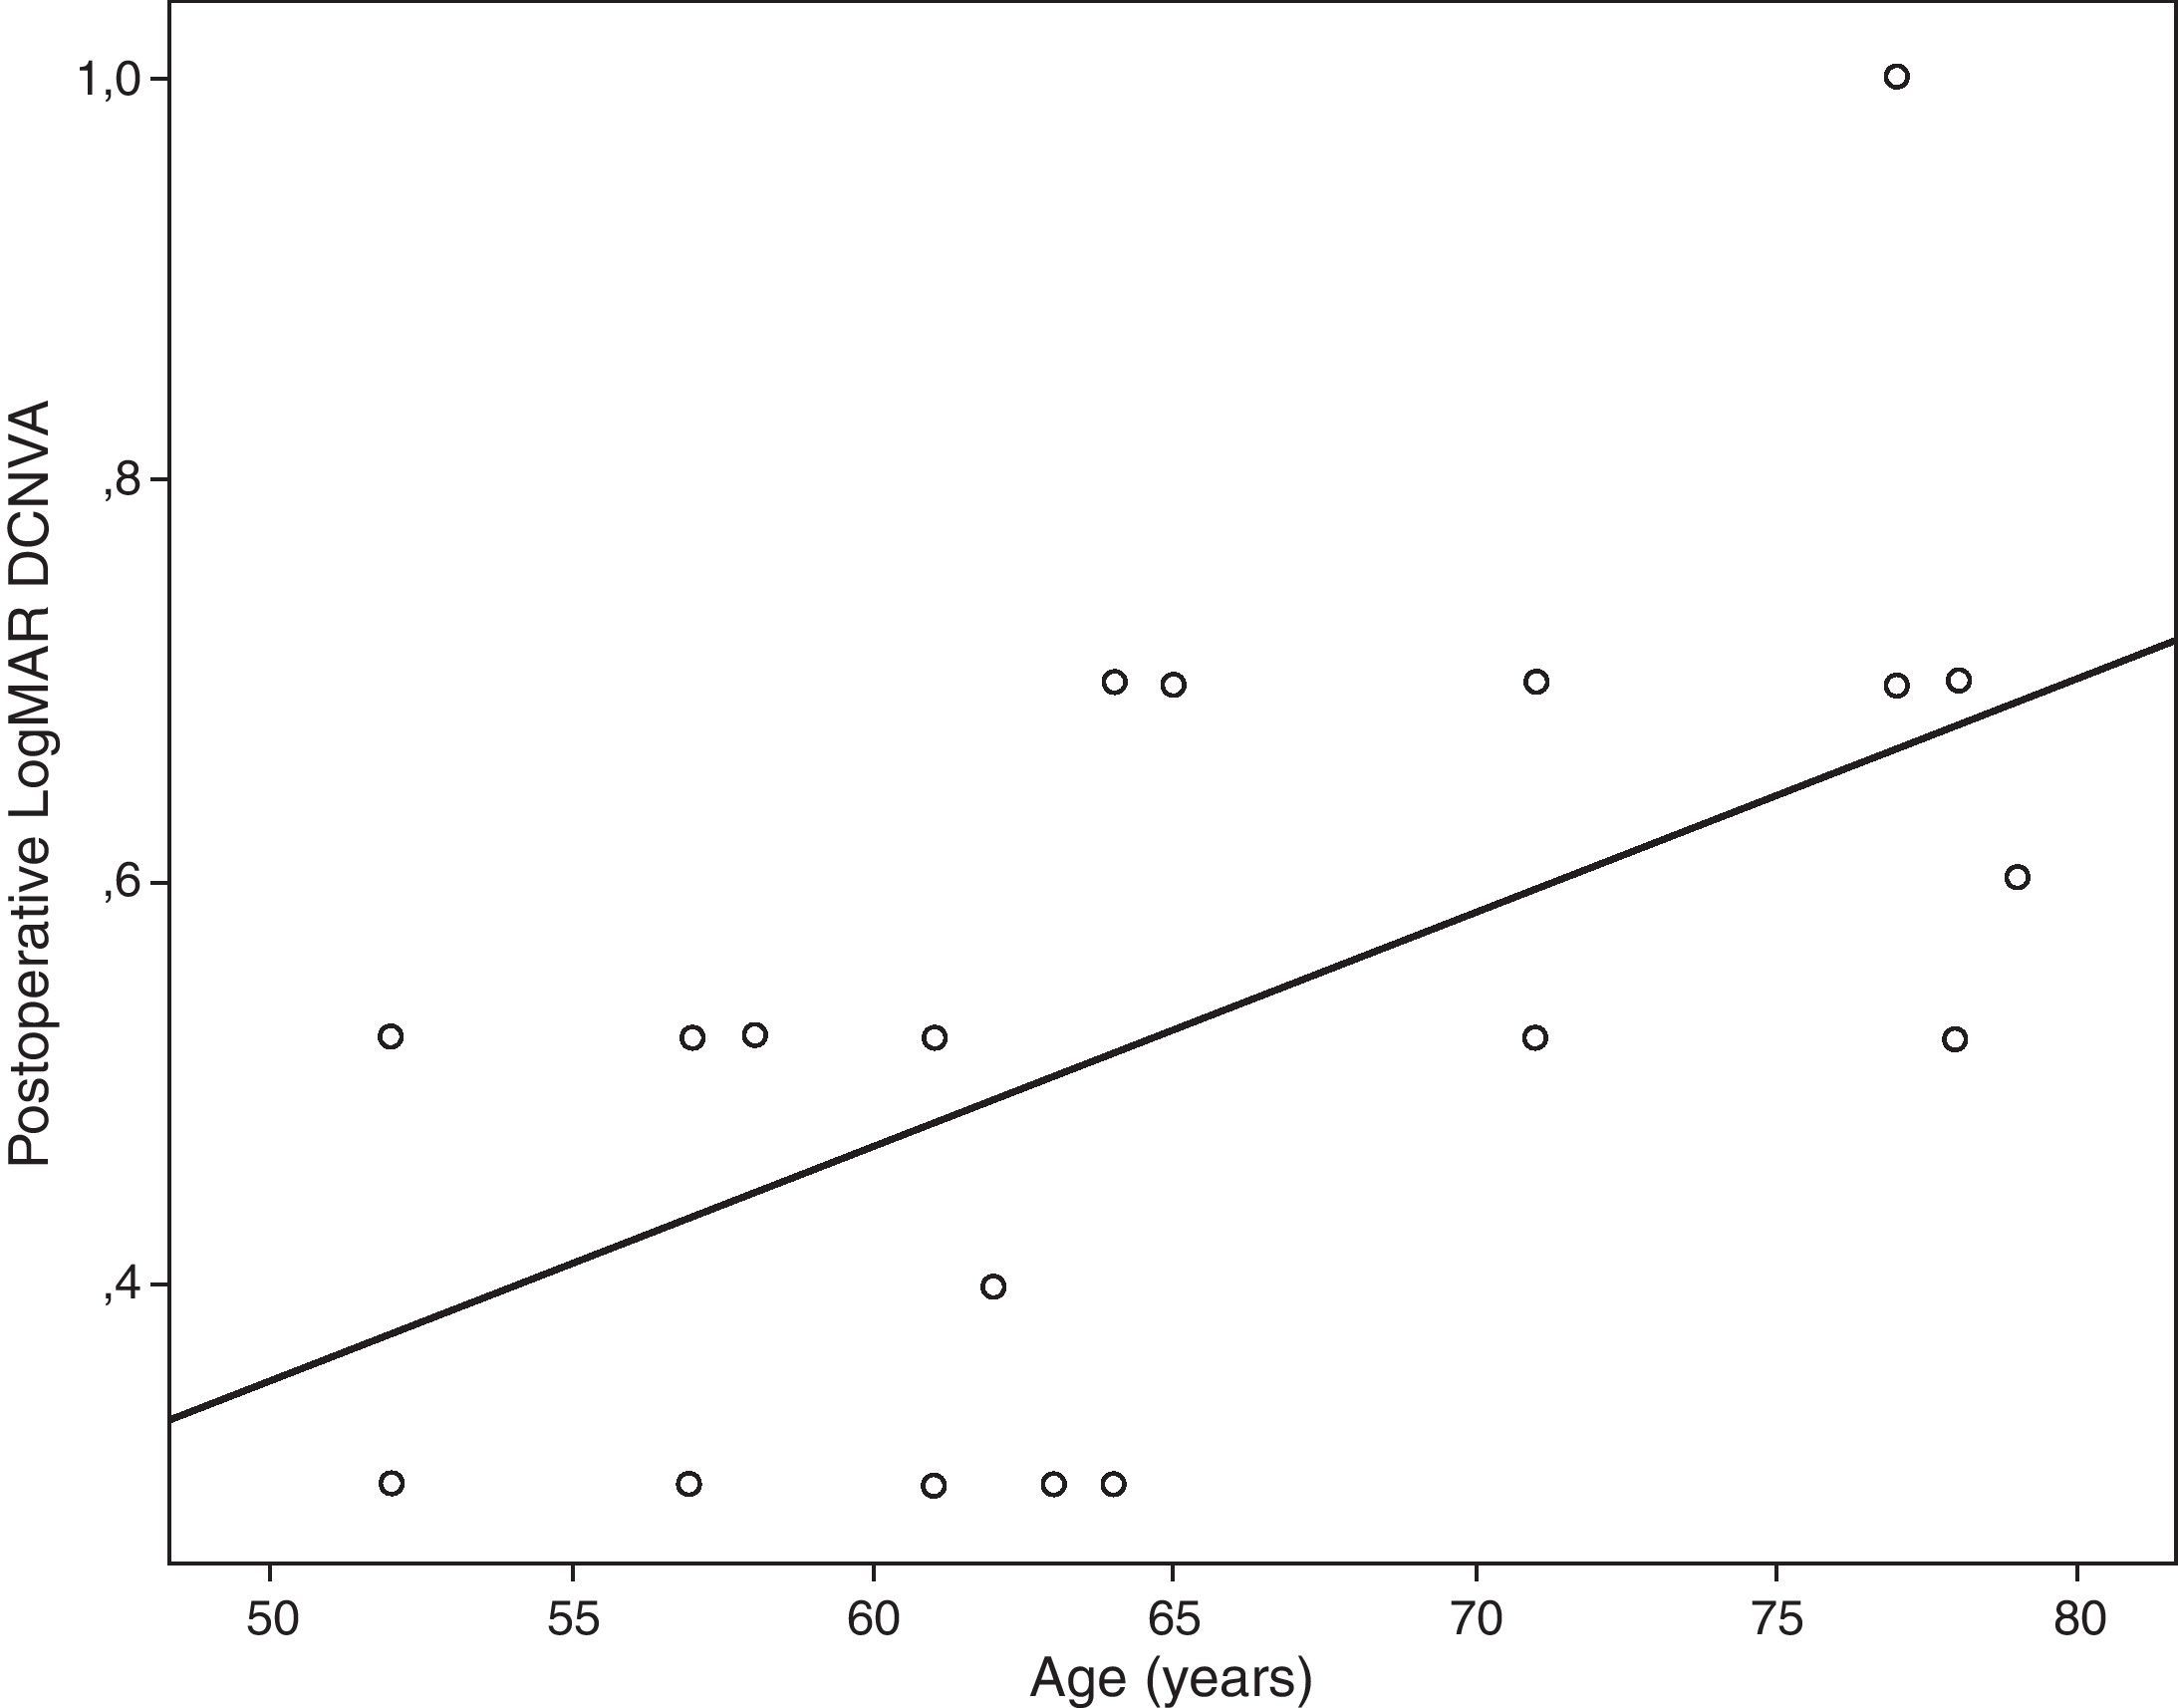
. The adjusting line to the data obtained by means of the least-squares fit is shown (R2: 0.35): DCNVApost=−0.229+0.012×Age.")
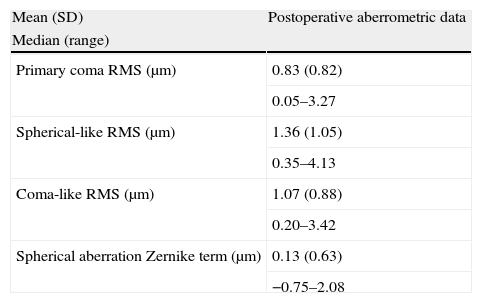
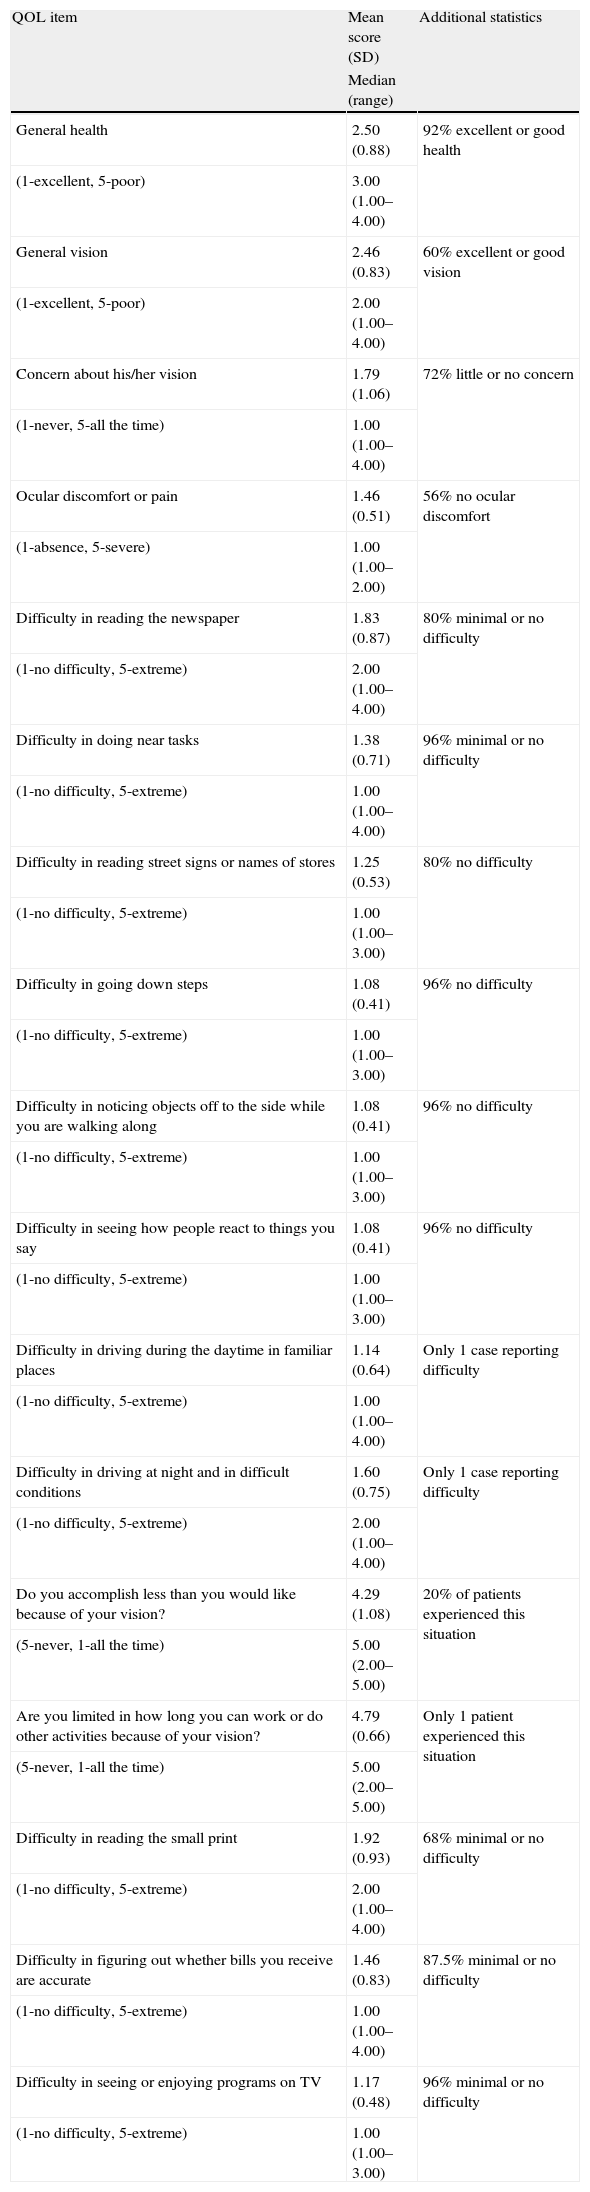
Tables 2 and 3 summarize the postoperative levels of intraocular higher order aberrations and the QOL data, respectively. As shown in Table 3, most of patients had minimal or no difficulty in performing several tasks at intermediate and far distances. Mean overall health rate was 7.04 (SD: 2.65; range: 1.00–10.00) and mean eyesight rate was 7.17 (SD: 1.69; range: 4.00–10.00) (scale: 1–10, being 1 the worst and 10 the best).
Summary of the postoperative intraocular higher order aberrometric data of eyes undergoing cataract surgery with the implantation of the Crystalens HD IOL in the current study.
| Mean (SD) | Postoperative aberrometric data |
| Median (range) | |
| Primary coma RMS (μm) | 0.83 (0.82) |
| 0.05–3.27 | |
| Spherical-like RMS (μm) | 1.36 (1.05) |
| 0.35–4.13 | |
| Coma-like RMS (μm) | 1.07 (0.88) |
| 0.20–3.42 | |
| Spherical aberration Zernike term (μm) | 0.13 (0.63) |
| −0.75–2.08 |
Abbreviations: SD, standard deviation; D, diopters; RMS, root mean square.
Summary of the postoperative outcomes obtained with the QOL questionnaire in patients undergoing cataract surgery with the implantation of the Crystalens HD IOL in the current study. Only the statistics for answers to the QOL items showing variability is shown.
| QOL item | Mean score (SD) | Additional statistics |
| Median (range) | ||
| General health | 2.50 (0.88) | 92% excellent or good health |
| (1-excellent, 5-poor) | 3.00 (1.00–4.00) | |
| General vision | 2.46 (0.83) | 60% excellent or good vision |
| (1-excellent, 5-poor) | 2.00 (1.00–4.00) | |
| Concern about his/her vision | 1.79 (1.06) | 72% little or no concern |
| (1-never, 5-all the time) | 1.00 (1.00–4.00) | |
| Ocular discomfort or pain | 1.46 (0.51) | 56% no ocular discomfort |
| (1-absence, 5-severe) | 1.00 (1.00–2.00) | |
| Difficulty in reading the newspaper | 1.83 (0.87) | 80% minimal or no difficulty |
| (1-no difficulty, 5-extreme) | 2.00 (1.00–4.00) | |
| Difficulty in doing near tasks | 1.38 (0.71) | 96% minimal or no difficulty |
| (1-no difficulty, 5-extreme) | 1.00 (1.00–4.00) | |
| Difficulty in reading street signs or names of stores | 1.25 (0.53) | 80% no difficulty |
| (1-no difficulty, 5-extreme) | 1.00 (1.00–3.00) | |
| Difficulty in going down steps | 1.08 (0.41) | 96% no difficulty |
| (1-no difficulty, 5-extreme) | 1.00 (1.00–3.00) | |
| Difficulty in noticing objects off to the side while you are walking along | 1.08 (0.41) | 96% no difficulty |
| (1-no difficulty, 5-extreme) | 1.00 (1.00–3.00) | |
| Difficulty in seeing how people react to things you say | 1.08 (0.41) | 96% no difficulty |
| (1-no difficulty, 5-extreme) | 1.00 (1.00–3.00) | |
| Difficulty in driving during the daytime in familiar places | 1.14 (0.64) | Only 1 case reporting difficulty |
| (1-no difficulty, 5-extreme) | 1.00 (1.00–4.00) | |
| Difficulty in driving at night and in difficult conditions | 1.60 (0.75) | Only 1 case reporting difficulty |
| (1-no difficulty, 5-extreme) | 2.00 (1.00–4.00) | |
| Do you accomplish less than you would like because of your vision? | 4.29 (1.08) | 20% of patients experienced this situation |
| (5-never, 1-all the time) | 5.00 (2.00–5.00) | |
| Are you limited in how long you can work or do other activities because of your vision? | 4.79 (0.66) | Only 1 patient experienced this situation |
| (5-never, 1-all the time) | 5.00 (2.00–5.00) | |
| Difficulty in reading the small print | 1.92 (0.93) | 68% minimal or no difficulty |
| (1-no difficulty, 5-extreme) | 2.00 (1.00–4.00) | |
| Difficulty in figuring out whether bills you receive are accurate | 1.46 (0.83) | 87.5% minimal or no difficulty |
| (1-no difficulty, 5-extreme) | 1.00 (1.00–4.00) | |
| Difficulty in seeing or enjoying programs on TV | 1.17 (0.48) | 96% minimal or no difficulty |
| (1-no difficulty, 5-extreme) | 1.00 (1.00–3.00) |
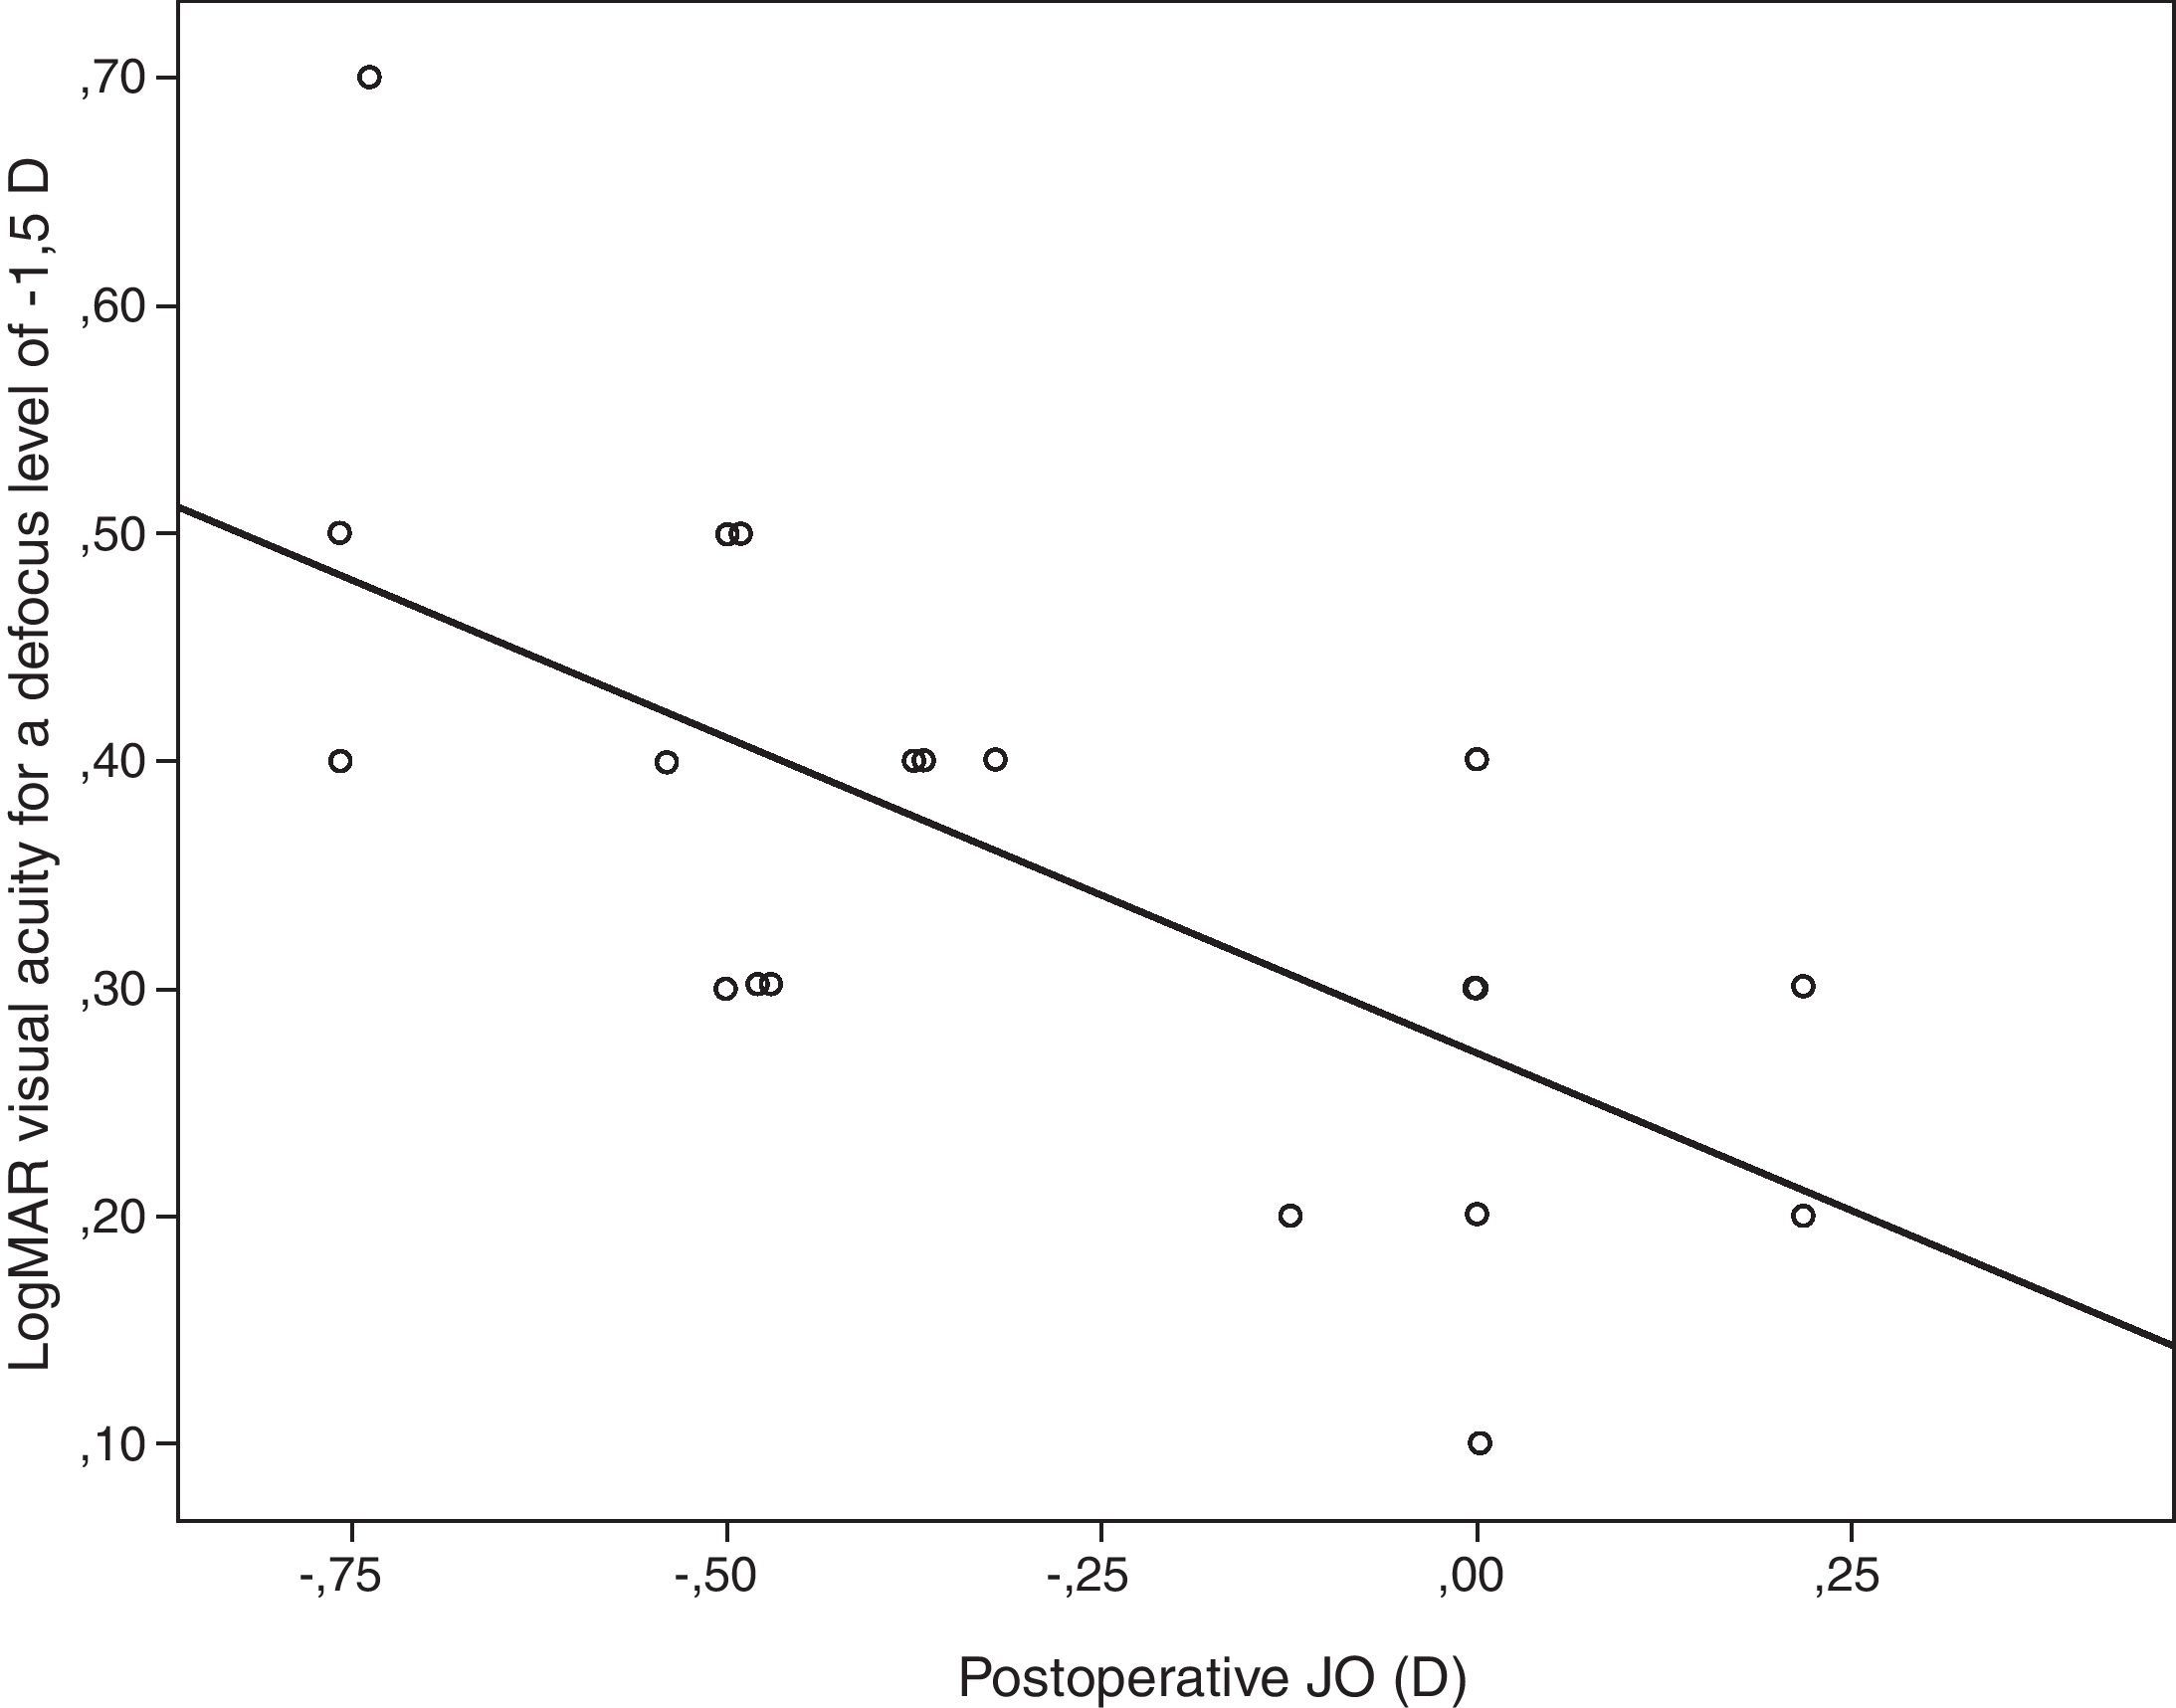
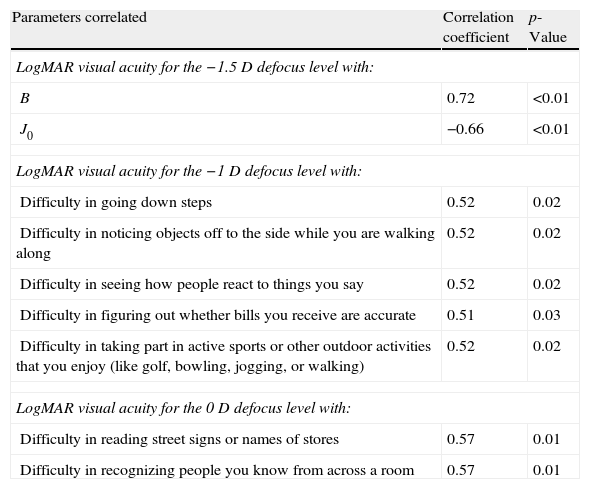
Table 4 summarizes the significant correlations of the visual outcome characterized by means of the defocus curve and the intraocular aberrometric profile with the visual, refractive, and QOL data in the analyzed sample. Intermediate visual acuity was found to correlate significantly with B, some QOL indices and J0 (Fig. 4). Other significant correlations found were: postop J0-near addition (r=−0.61, p<0.01), age-DCNVA (r=0.65, p<0.01) (Fig. 4), and preop J0-visual acuity −1D defocus (r=−0.48, p=0.02).
Summary of the significant correlations of the postoperative visual outcome characterized by means of the defocus curve and the intraocular aberrometric profile with the postoperative visual, refractive, and QOL data in the analyzed sample.
| Parameters correlated | Correlation coefficient | p-Value |
| LogMAR visual acuity for the −1.5D defocus level with: | ||
| B | 0.72 | <0.01 |
| J0 | −0.66 | <0.01 |
| LogMAR visual acuity for the −1D defocus level with: | ||
| Difficulty in going down steps | 0.52 | 0.02 |
| Difficulty in noticing objects off to the side while you are walking along | 0.52 | 0.02 |
| Difficulty in seeing how people react to things you say | 0.52 | 0.02 |
| Difficulty in figuring out whether bills you receive are accurate | 0.51 | 0.03 |
| Difficulty in taking part in active sports or other outdoor activities that you enjoy (like golf, bowling, jogging, or walking) | 0.52 | 0.02 |
| LogMAR visual acuity for the 0D defocus level with: | ||
| Difficulty in reading street signs or names of stores | 0.57 | 0.01 |
| Difficulty in recognizing people you know from across a room | 0.57 | 0.01 |
Abbreviations: J0 and J45, power vector components of manifest cylinder; M, spherical equivalent; B, overall blurring strength of the manifest spherocylindrical error; RMS, root mean square.
. The adjusting line to the data obtained by means of the least-squares fit is shown (R2: 0.46): VA−1.5=0.271−0.277×J0.")
Scattergram showing the relationship between the postoperative magnitude of the astigmatic power vector component J0 and the postoperative LogMAR visual acuity for a defocus level of −1.5D (VA−1.5). The adjusting line to the data obtained by means of the least-squares fit is shown (R2: 0.46): VA−1.5=0.271−0.277×J0.
A significant improvement in CDVA was achieved after IOL implantation in the evaluated sample. This outcome was consistent with cataract surgery expectations and confirms the safety of the evaluated IOL. The visual improvement observed in the current series was consistent with that reported by other studies using other positional accommodating IOLs3,18,19 or even the same.11 Mean postoperative LogMAR UDVA in our series was 0.21 (20/30), ranging from 0 (20/20) to 0.80 (20/120), which revealed the presence of cases with limited UDVA after surgery. As in a previous series using the same model of IOL,11 this fact seemed to be mainly in relation with the trend observed in the evaluated sample to postoperative residual myopia (mean postoperative spherical equivalent of −0.37D). As emmetropia was always planned, a factor that could have accounted for this fact may be the use of a non-optimized A-constant value for the IOL power calculations. Future studies are necessary regarding this issue, elucidating which is the most optimum A-constant value for the accommodating IOL evaluated in the current study and if positional instability of this IOL within the capsular bag could affect this constant.
Regarding the near visual outcome, a mean significant reduction of 0.87D in the addition required for near vision was found (60% of eyes requiring a postoperative near addition between 0 and 1.5D), with maintenance of CNVA and mean postoperative UNVA of J4 in Jaegger notation. This was consistent with the outcomes reported in a previous series using the same model of accommodating IOL.11 Likewise, the mean UNVA obtained with the accommodating IOL evaluated in the current study (around J4, 0.4LogMAR) was slightly better than that reported for a previous model of this IOL (Crystalens AT-45, around J5, 0.5LogMAR).3 Mean UNVA in the current series was 1 line better than mean DCNVA (around J5, 0.5LogMAR) possibly due to the near visual benefit induced by the postoperative myopic residual error. One additional relevant finding is the significant variability of the near visual outcomes in the evaluated sample, with cases that obtained a very poor near visual outcome and others with excellent UNVA and DCNVA. This suggests that the mechanism of action of the evaluated accommodating IOL for providing a functional near and intermediate visual functions does not work in all cases. This remarks the need for a predictive model defining the best candidates for this type of implant. Specifically, we obtained in our sample a worse near visual outcome (DCNVA worse than 0.5LogMAR) in older patients presenting larger amounts of preoperative astigmatism. Age and preoperative magnitude of corneal and refractive astigmatism may be considered as potential predicting factors for the near visual outcomes obtained with this accommodating IOL. These findings were confirmed in the correlation analysis performed in the current study.
The visual behavior with this specific model of IOL using different levels of defocus (equivalent to different viewing distances, not only near) was also evaluated by obtaining the defocus curve, which has been shown to be a useful procedure for such purpose.20 As shown in Fig. 2, the defocus curve shows that an area of maximum visual acuity (better than 0.2LogMAR, 20/30) corresponded to defocus levels simulating distance and intermediate visual conditions. Therefore, this modality of accommodating IOL is able to provide a functional vision for these conditions, with the requirement of a less powerful addition for achieving a functional vision at near and a significant variability in the visual outcomes between individuals. These results are consistent with those reported in a previous study evaluating the same model of accommodating IOL.11 The mechanism of action of this accommodating IOL for providing a functional intermediate vision and a less addition-dependent near vision is still uncertain. Ultrasonography studies with a previous model of the evaluated IOL showed minimal axial displacements of the optic not explaining in all cases the postoperative amplitude of accommodation achieved.21–23 Future studies are required to validate the postulated mechanisms of action of this implemented model of accommodating IOL as well as to analyze the real visual impact of the central biaspheric modification introduced in the model of IOL evaluated in the current study.
The intraocular aberrometric analysis showed the presence of minimal amounts of intraocular primary spherical aberration with the evaluated IOL, with a mean value similar to that reported after implantation of aberration-free monofocal IOLs24 and larger than that reported for classical monofocal IOLs.25 Surprisingly, the mean values of RMS for intraocular primary coma, spherical-like and coma-like aberrations were moderate, with a large variability associated. This aberrometric variability may be associated to a non-predictable positioning of the IOL within the capsular bag, with potential decentrations of the optic. It should be considered that tilted or decentred spherical IOLs can induce significant amounts of higher order aberrations, especially coma aberration.26–29 Some authors have reported cases of misalignment, tilting or bad positioning with previous models of the evaluated accommodating IOL.30–32 Future studies are necessary to evaluate the position adopted by this IOL into the capsular bag and how it can change with time.
Regarding the QOL outcomes, they were evaluated by using the Spanish version of a validated questionnaire (NEI-VFQ, National Eye Institute-Visual Eye Institute Function Questionnaire).33 This questionnaire has been previously used for evaluating QOL changes after cataract surgery with implantation of different modalities of IOL.34–36 In general, patients reported minimal or no difficulty in performing several tasks at intermediate and distance in the current series, with difficulty rates similar to those obtained for some multifocal IOLs.34 However, as expected according to the defocus curve outcomes, moderate difficulty was found for reading activities, with mean scores higher than those reported for apodized and diffractive multifocal IOLs.34
Age was found to be correlated with postoperative DCNVA. Specifically, the older the patient, the worse was the postoperative DCNVA. Therefore, age seems to be a crucial factor in the results obtained with this modality of accommodating IOL. This same finding has been reported by other authors for other models of accommodating IOL.37 Although ciliary muscle has been shown to undergo age-dependent changes in morphology, these changes appear not to affect the ability of the muscle to contract during accommodation.38,39 Possibly a combination of age and surgery-dependent changes in capsule, zonule and even ciliary muscle may account for this phenomenon. This is something that should be addressed in future studies. The level of preoperative astigmatism was also found to be a limiting factor for the postoperative visual outcome in the current series, as suggested in previous studies based on optical simulations.40,41 It should be noted that the evaluated accommodating IOL is unable to compensate for the pre-existing astigmatism. In addition, the surgically induced astigmatism with the corneal incision required for performing the surgery may also play a role of limiting factor for the near and intermediate visual outcomes because this type of IOL has not been developed for micro-incision cataract surgery. In any case, incision was performed on the steepest corneal meridian in order to minimize as much as possible the corneal astigmatism and at least to avoid the induction of an increase in the magnitude of manifest astigmatism. Furthermore, QOL data were found to correlate with several clinical parameters. As expected, a significant direct correlation of the near visual acuity with the level of difficulty referred by the patient for doing several tasks at intermediate distances, such as seeing how people react to things you say and taking part in active sports or other outdoor activities, was detected. This shows the potential positive impact of this IOL implantation on some daily activities in relation with intermediate distances.
One drawback of the current study was the absence of preoperative measurements of intraocular aberrations, defocus curve and QOL. This would have allowed us to evaluate if a significant change was obtained in these parameters after surgery. The sample size was another limitation of the study but it should be considered that the aim of the current study was to detect trends and correlations to be confirmed with future larger samples. The analysis of the exact position of the IOL in the capsular bag as well as the degree of IOL tilt or decentration would have been also desirable in order to confirm the suspects of the current analysis, the crucial role of these issues on the final visual outcomes. This can also be considered as a limitation of the current study.
In summary, the Crystalens HD IOL seems to be able to restore successfully the distance visual function after cataract surgery and to provide a relatively functional intermediate and near vision with a significant impact on the patient's QOL. This IOL seems to be able to provide an acceptable level of visual acuity for a range of 1–1.5D of defocus. The mechanism for achieving this range of focus, the depth of focus provided by the IOL optics or the forward shifting of the IOL optic with ciliary muscle contraction still remains unclear. This is something that should be investigated and clarified in future studies. An optimization of the outcomes with this modality of IOL seems to be possible by means of an appropriate patient selection. The best candidates for this type of IOL seem to be young people with low cylindrical refractive error, although it should be investigated further if the range of focus achieved with this accommodating IOL is maintained when the patient ages. All these trends observed in this study should be confirmed in future studies with larger sample sizes.
Conflict of interestsThe authors have no conflicts of interest to declare.


