

To quantify the difference between recognition (letter) and resolution (Landolt) visual acuity (VA) in a group of normally sighted subjects. Is it reasonable to assume that the two acuity measures are clinically equivalent?
MethodsA pair of 6m acuity test charts was produced: one comprised letters and the other Landolt broken rings. Construction of both charts conformed to the logMAR design format. Monocular VA was determined for the dominant eye of 300 screened and normally sighted optometric patients aged 16 to 40, each wearing an optical refractive (spectacle) correction.
ResultsLetter acuity was superior to Landolt acuity (P≤0.0001). The mean paired acuity difference was -0.041 logMAR (standard deviation 0.034): the 95% limits of agreement were ±0.067 logMAR units or ±3.3 chart optotype. Repeatability was high and similar for each chart type (±2.1 and ±2.4 optotype for letter and Landolt, respectively). Gender, test sequence, and laterality of the dominant eye (left or right) were each non-statistically significant variables.
ConclusionsFor normally sighted subjects wearing an optimal refractive correction, a bias was recorded in favour of recognition over resolution acuity: the clinical difference amounted to approximately 40% of one logMAR chart line, with similar high repeatability for either chart optotype. We conclude that the assumption of clinical equivalence between letter and Landolt acuity is reasonable under optimum test conditions.
Cuantificar la diferencia entre la agudeza visual (AV) basada en tareas de reconocimiento (letras) y la basada en tareas de resolución (Landolt) en un grupo de sujetos con visión normal. ¿Es aceptable suponer que ambas medidas de agudeza visual son clínicamente equivalentes?
MétodosSe desarrollaron dos escalas de optotipos para la agudeza visual, para ser observadas a 6m de distancia: una constaba de letras y la otra, de anillos de Landolt. La construcción de ambas escalas se realizó conforme al formato de diseño logMAR. Se midió la AV monocular del ojo dominante de 300 sujetos (seleccionados entre los pacientes de una consulta de optometría), con visión normal y edades comprendidas entre los 16 y los 40 años. Las medidas se realizaron con la corrección refractiva (lentes de prueba) apropiada para cada sujeto.
ResultadosLa agudeza medida utilizando letras resultó ser mayor que la agudeza basada en anillos de Landolt (P≤0,0001). El promedio de la diferencia entre los valores de agudeza visual obtenidos para un mismo observador fue de 0,041 logMAR (desviación típica: 0,034): los límites de concordancia al 95% fueron ±0,067 unidades logMAR o ±3,3 optotipos de la escala. Se observó una alta repetibilidad de los resultados, similar para ambos tipos de escala (±2,1 y ±2,4 optotipos para las medidas con letras y con anillos de Landolt, respectivamente). El sexo, el orden en el que se realizaron las medidas y el ojo dominante (izquierdo o derecho) son variables que no resultaron ser estadísticamente significativas.
ConclusionesEn sujetos con visión normal que llevan una corrección refractiva óptima, se detectó un cierto sesgo a favor de la agudeza basada en tareas de reconocimiento frente a la agudeza basada en tareas de resolución: la diferencia clínica alcanzó aproximadamente un 40% de una línea logMAR de la escala, lográndose con las dos escalas de optotipos una repetibilidad elevada (similar en ambos casos). Concluimos que la suposición de equivalencia clínica entre la agudeza medida con letras y la medida con anillos de Landolt es aceptable siempre y cuando existan condiciones de medida óptimas.
The measurement of a patient's visual acuity (VA) is a key feature of the optometric examination: a reduced acuity value relative to an accepted clinical “standard” may have pathological or diagnostic implications. The acuity parameter is also often the primary outcome variable in clinical trials or vision research studies. In addition, it is frequently taken as an indicator of visual ability in association with occupational tasks including the statutory licensing of automobile drivers and airline pilots.
The familiar format of the clinical VA test has remained virtually unchanged since its introduction nearly 150 years ago (Snellen, 1862: as cited in Bennett).1 Typically, a chart comprising upper-case letters arranged in rows of decreasing size from top to bottom is read by the patient to the best of their ability from a fixed viewing distance. However, it has come to be realised that the combination of an irregular progression of letter sizes down the chart, the differing number of letters comprising each chart line, and the mixed relative legibility of the letters chosen, taken together compromise the accuracy of conventional VA determination: the typical test circumstances also prohibit statistical analysis of VA data.2
Thirty years ago a revised design of letter chart was suggested3 in an attempt to standardise the VA test: a geometric inter-line size progression was introduced (0.10 log unit); five letters were presented on each line; the letter set was restricted to ten letters chosen for their similar legibility;1,4 the smallest line was deliberately beyond the anticipated visual resolution limit to avoid truncation of the VA scale; and a strict protocol was devised to define the test end point. The design innovations of the Bailey-Lovie logarithm of the Minimum Angle of Resolution (logMAR) chart enhanced test accuracy and repeatability,5 and additionally facilitated parametric statistical analysis of VA data. Together with these improvements in technique, the test procedure long familiar to patient and practitioner could be retained; i.e., a criterionfree multiple forced-choice psychophysical paradigm.
For the literate patient, the letter-based acuity test procedure is quick and easy to perform. However, for illiterate or mute subjects and for research applications (including frequently-repeated vision assessments) an alternative symbol to alphabet letters becomes necessary. A popular choice under these circumstances is the four- (or less frequently eight-) orientation Landolt broken ring, a test stimulus which has also been adopted as a standard acuity optotype1 and with a clinical history nearly as long as the Snellen VA test format.6 Using this test optotype the patient is instructed to identify the location of the break in the ring symbol (i.e., at the top, bottom, left or right). The chart layout can be exactly the same as for conventional letter testing and, once the task is understood, VA determination can usually be readily accomplished. An additional benefit in the vision research environment is that, especially in combination with the logMAR chart design format, inter-subject and repeat testing reliability can be enhanced due to the absence of relative legibility issues encountered with the use of letters.
An important distinction must however be made between these two superficially similar acuity testing formats. The detection of the break in a Landolt ring test stimulus is a “resolution” task: the basic ring stimulus is visible, it is the location of the detail (the break) that must be reported. On the other hand, when dealing with a chart comprising lines of letters (even though the patient might be unaware of the extent of the available selection) the task is one of discriminating which letter is under scrutiny; i.e., a “recognition” task. The visual tasks are different and this might influence the VA result obtained; compensatory cognitive processes may be available to a subject reading individual chart letters that are not relevant or useful when that same subject is attempting to locate the position of the gap in a broken-ring stimulus. For this reason, the suggestion7 that an empirical size-scaling of test letters might produce equivalent legibility to Landolt ring optotype is unlikely to be universally successful or applicable.
Investigation of this topic is not new. For example, in recent times test-chart luminance,8 stimulus conditions in association with statistical modelling of VA measures,9 and lenticular10 and macular11 pathologies have all been shown to influence the relative (resolution versus recognition) acuity results. However, the availability of a contemporary acuity test and protocol (i.e., the logMAR chart format) facilitates a direct investigation of this issue in a clinical population. We were interested to assess the magnitude and direction of any inter-format acuity difference that might be uncovered using normally sighted non-pathological subjects; also to assess whether any difference is likely to be of clinical (or statistical) relevance.
MethodsSubjectsThe study, which conformed to the tenets of the Declaration of Helsinki, established the monocular letter and Landolt logMAR VA for the dominant eye of healthy human subjects. All data were collected following informed verbal agreement and were entirely non-attributable in analysis, thereby preserving patient confidentiality.
The subjects were patients who had attended optometric practice for a routine sight test. Suitable persons were identified as they presented for examination over a twelve-week period. All were aged between 16 and 40 years, were not habitual contact lens wearers, and did not require a presbyopic (near) refractive correction. The immediately-preceding sight test had confirmed that they were normally sighted. Each subject achieved better than 6/6 Snellen acuity with either eye, and was not amblyopic; had a distance refractive error within the range ≤±6.00 diopters (D) of sphere and ≤-2.00 D of cylinder; recorded no adverse ocular history (pathology, trauma or surgery); had clear media and no evidence of macular dysfunction; and finally, concurrent with self-declared good general health, subjects were not taking any prescribed medications with documented ocular or visual side effects.
A group of 300 subjects that met these criteria was assembled, 56% of whom were female (a gender imbalance typical of this young adult age group in optometric practice).12 Each selected subject was allocated a time across a two-week period to attend the practice for a brief data collection appointment (see Procedures below).
LogMAR chartsTwo test charts, one comprising letters and the other Landolt broken rings, were produced conforming to the log-MAR design principles3 for use at 6m, as viewed in a plane mirror at 3m. The charts were designed and generated using an Apple iMac computer: each was printed in negative polarity (i.e., black symbols) on A4-size (297×210mm) mattfinish thin stiff translucent sheets. Nominal chart contrast was 0.9 (Michelson). The charts slotted against a diffusing back-illuminated acrylic panel mounted in the usual consulting room test cabinet: the photopic luminance of the white chart background was 158cd/m2, in close approximation to the test specifications set out in British Standard BS 4274: 1968.4
The letters and the circular broken ring stimuli were all constructed within a 5units × 5units matrix to maintain uniformity of presentation: optotype limb thickness or the width of the break were equivalent to 1unit. Ten letters (i.e., D E F H N P R U V Z) were used more or less equally (3 or 4 times each) across the chart, avoiding horizontal or vertical adjacent repetition and ensuring that no words or acronyms were spelled out. The break in the Landolt rings could occur in one of the four cardinal positions: every chart line comprised one each of the four possible ring orientations plus one random repeat, arranged such that successive broken rings avoided displaying the same gap orientation.
Five symbols were displayed per chart line, each spaced one symbol-width apart, with successive lines differing by 0.10 log unit in size and with an inter-line spacing equivalent to the size of the symbol on the line above. Seven rows of symbols were shown on each chart, spanning the logMAR range 0.30 (equivalent to 20/40) to -0.30 (20/10): i.e., down to a level beyond the anticipated resolution limit, an important operational consideration.13
ProceduresAt each subject's formal data collection appointment within the two-week period the sphero-cylindrical distance refractive correction, as determined at their recent sight test, was mounted in a trial frame. This was to ensure that optimal VA would be attained: such an approach almost invariably produces an acuity improvement over the habitual level.14,15 Photopic conditions prevailed in the test room, and natural pupil size was retained.
The first item to be established was each subject's dominant (sighting) eye. This was determined, in distance (6m) fixation, on the basis of three consistent successive trials of the Dolman hole-in-the-card test.16 It is important to establish ocular dominance appropriately: it is unsafe to assume that a subject's better-sighted eye is indicative of their sighting dominant eye.17
The subject's non-dominant eye was occluded with an opaque shield mounted in the appropriate rear cell of the trial frame. The monocular VA of the dominant eye was then determined using the letter and the Landolt logMAR charts in a randomised test sequence. Acuity testing always commenced on the top (0.30) line of each chart; i.e., at a level well above the predicted acuity threshold. Starting with the left-hand symbol (as viewed in the consulting room mirror) the subject was instructed to read along the lines of letters or broken rings calling out the identity of each succeeding letter or the gap location in each successive broken ring. Guessing was encouraged (but not mandated) in the event of uncertainty,18 most especially when the lower lines of (smaller) symbols were reached. Testing terminated when 4 or more mistakes were made on a given chart line:19 each letter or broken ring symbol that had been correctly identified contributed to the final acuity value.20
To assess the repeatability of acuity values obtained with either of these charts, 50 subjects (52% female) who had participated in the main experiment were retested at approximately the same time one week after their initial visit. The test protocol was as described previously, using the same letter and Landolt logMAR charts in a randomly-determined sequence.
Statistical analysisAll data management and statistical analysis was undertaken using STATISTICA/Mac software (v4.1: StatSoft, Inc., Tulsa, OK, USA). The dependent variable in the majority of this work was logMAR acuity. Statistical inspection (Kolmogorov-Smirnov testing) of these acuity data as entered in a spreadsheet and partitioned between chart type, subject gender, test sequence (letter or Landolt chart tested first), and whether the right or the left eye was dominant, indicated in each case a Gaussian distribution: in the main, parametric procedures (including t-testing and analysis of variance, ANOVA) were relied upon for statistical analysis of this material.
ResultsMean age of the subject group (n=300) was 23.3 years (standard deviation [SD] 7.5), range 16.0 to 39.8 years. Mean age of the repeat-test sub-group (n=50) was 22.3 years (SD 6.7), range 16.1 to 36.5 years.
Calculated21 mean sphero-cylindrical monocular spectacle prescription of the entire subject group was -0.25 -0.04×70°; for the repeat-test group it was -0.35 -0.10×76.9°.
It was possible to record a sighting preference without equivocation for each subject. Overall 66% of persons indicated a right-preferred (dominant) eye, and 68% in the repeat-test group: both of these proportions are in close agreement with a published general population estimate of approximately 70%.22
Initial analysis of the letter and Landolt logMAR acuity data indicated that subject's gender, the laterality of the dominant eye (i.e., either left or right), and the order of testing (ie, whether the letter or the Landolt chart was used first) were all non-statistically significant (and non-interactive) features (P>0.5). Consequently, the grouped VA data of all 300 subjects was used in all subsequent analyses, unless indicated otherwise in the text.
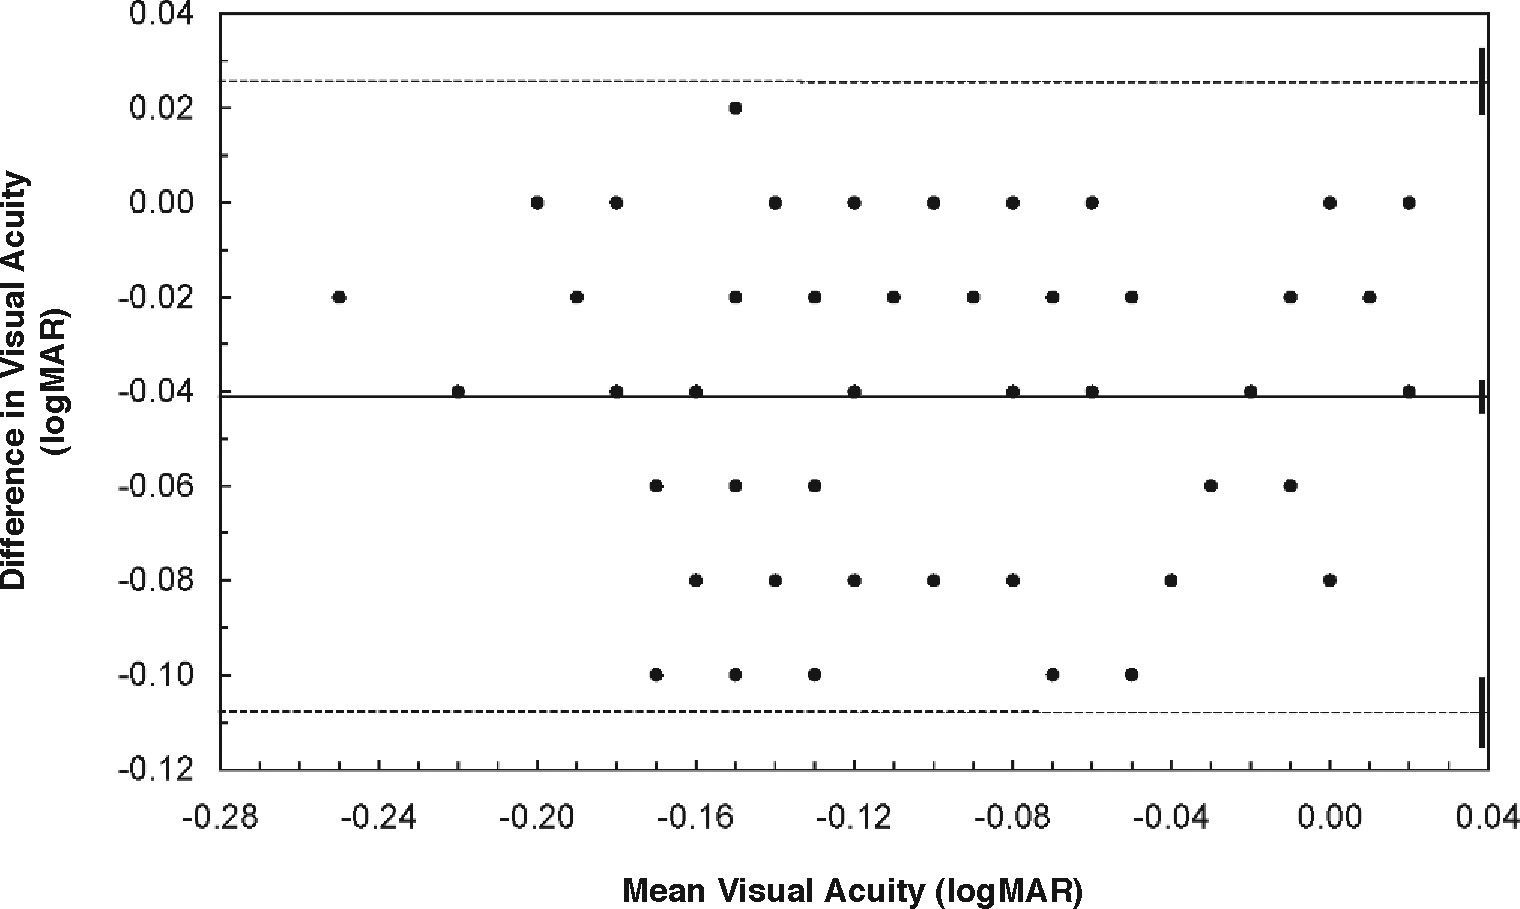
Mean monocular (dominant eye) letter acuity was -0.119 logMAR (SD 0.070), equivalent to Snellen 6/4.6. Mean monocular Landolt acuity was slightly worse, being -0.078 log - MAR (SD 0.074) or Snellen 6/5.0. As might be anticipated, inter-chart correlation of VA measurement was high (Pearson r=0.89, P<0.001). Further investigation of this relationship23 determined that the mean paired (letter minus Landolt) acuity difference was -0.041 logMAR units (SD 0.034): this difference was statistically significant (P≤0.0001). The calculated 95% limits of agreement (LoA) for this acuity difference (=SDX 1.96)23 were ±0.067 logMAR units: because a single optotype (letter or Landolt ring) on either chart was equivalent to 0.02 logMAR units, this means that when comparing acuity scores on the two charts a difference (better/worse) of 3 optotype can be taken as equivalent. These limits are illustrated in figure 1, where paired acuity difference (letter minus Landolt logMAR) is plotted against mean acuity. Although many data points are coincident, it is evident that the distribution is even across the plot area. This apparent uniformity of distribution was confirmed for these data by the value of the correlation coefficient (r=0.14, P=0.1): no statistically significant association existed between acuity level and paired acuity (letter versus Landolt) difference. What is demonstrated, however, is that slightly higher acuity values will tend to be recorded with the letter compared to the Landolt broken ring version of the logMAR test chart.
![LogMAR visual acuity limits of agreement plot, letter chart versus Landolt ring chart. The dependent variable is paired acuity difference [letter minus Landolt] and the independent variable is mean acuity: the ordinate is scale-marked in divisions of 0.02 logMAR units (ie, equivalent to one chart optotype). The inter-chart mean difference (0.041 logMAR units in the direction of the letter chart) is indicated by the continuous horizontal line across the centre of the plot; the pair of dashed horizontal lines mark the upper and lower 95% limits of agreement (LoA), the width being ±0.067 logMAR units or ±3.3 chart symbols. The three short vertical solid bars at the extreme right-hand side of the plot delineate the calculated 95% confidence intervals associated with the mean and the upper/lower limits, and are indicative of the precision linked to the estimates derived from the clinical subject group. N=300 (note that many data points are coincident).](https://static.elsevier.es/multimedia/18884296/0000000100000002/v1_201303141032/S1888429608700669/v1_201303141032/en/main.assets/gr1.jpeg?xkr=ue/ImdikoIMrsJoerZ+w93meMsSv3kCFu9ka1kgzl/xrK32s3f4YRcWD6Dd7AXarLafqfz0GCp6yfmc6kOkhhG9GoyjOOwT/AOlq8vKKVHbq6+S4b7WRAhNwg3BypXGyBCqf15PcBWga9r7NocKq9f2vYsOYefMio5+892g/ZybrVHd+Sqj+WpUkWTQjBFiy0b+VQykNH0t3u1oDqqcaDShDaeJLACqoc97pC41SoQsfbDUmkEmTTxyPymeJVPJsTjTACdy2ONPrhioFsagp4g== "LogMAR visual acuity limits of agreement plot, letter chart versus Landolt ring chart. The dependent variable is paired acuity difference [letter minus Landolt] and the independent variable is mean acuity: the ordinate is scale-marked in divisions of 0.02 logMAR units (ie, equivalent to one chart optotype). The inter-chart mean difference (0.041 logMAR units in the direction of the letter chart) is indicated by the continuous horizontal line across the centre of the plot; the pair of dashed horizontal lines mark the upper and lower 95% limits of agreement (LoA), the width being ±0.067 logMAR units or ±3.3 chart symbols. The three short vertical solid bars at the extreme right-hand side of the plot delineate the calculated 95% confidence intervals associated with the mean and the upper/lower limits, and are indicative of the precision linked to the estimates derived from the clinical subject group. N=300 (note that many data points are coincident).")
LogMAR visual acuity limits of agreement plot, letter chart versus Landolt ring chart. The dependent variable is paired acuity difference [letter minus Landolt] and the independent variable is mean acuity: the ordinate is scale-marked in divisions of 0.02 logMAR units (ie, equivalent to one chart optotype). The inter-chart mean difference (0.041 logMAR units in the direction of the letter chart) is indicated by the continuous horizontal line across the centre of the plot; the pair of dashed horizontal lines mark the upper and lower 95% limits of agreement (LoA), the width being ±0.067 logMAR units or ±3.3 chart symbols. The three short vertical solid bars at the extreme right-hand side of the plot delineate the calculated 95% confidence intervals associated with the mean and the upper/lower limits, and are indicative of the precision linked to the estimates derived from the clinical subject group. N=300 (note that many data points are coincident).
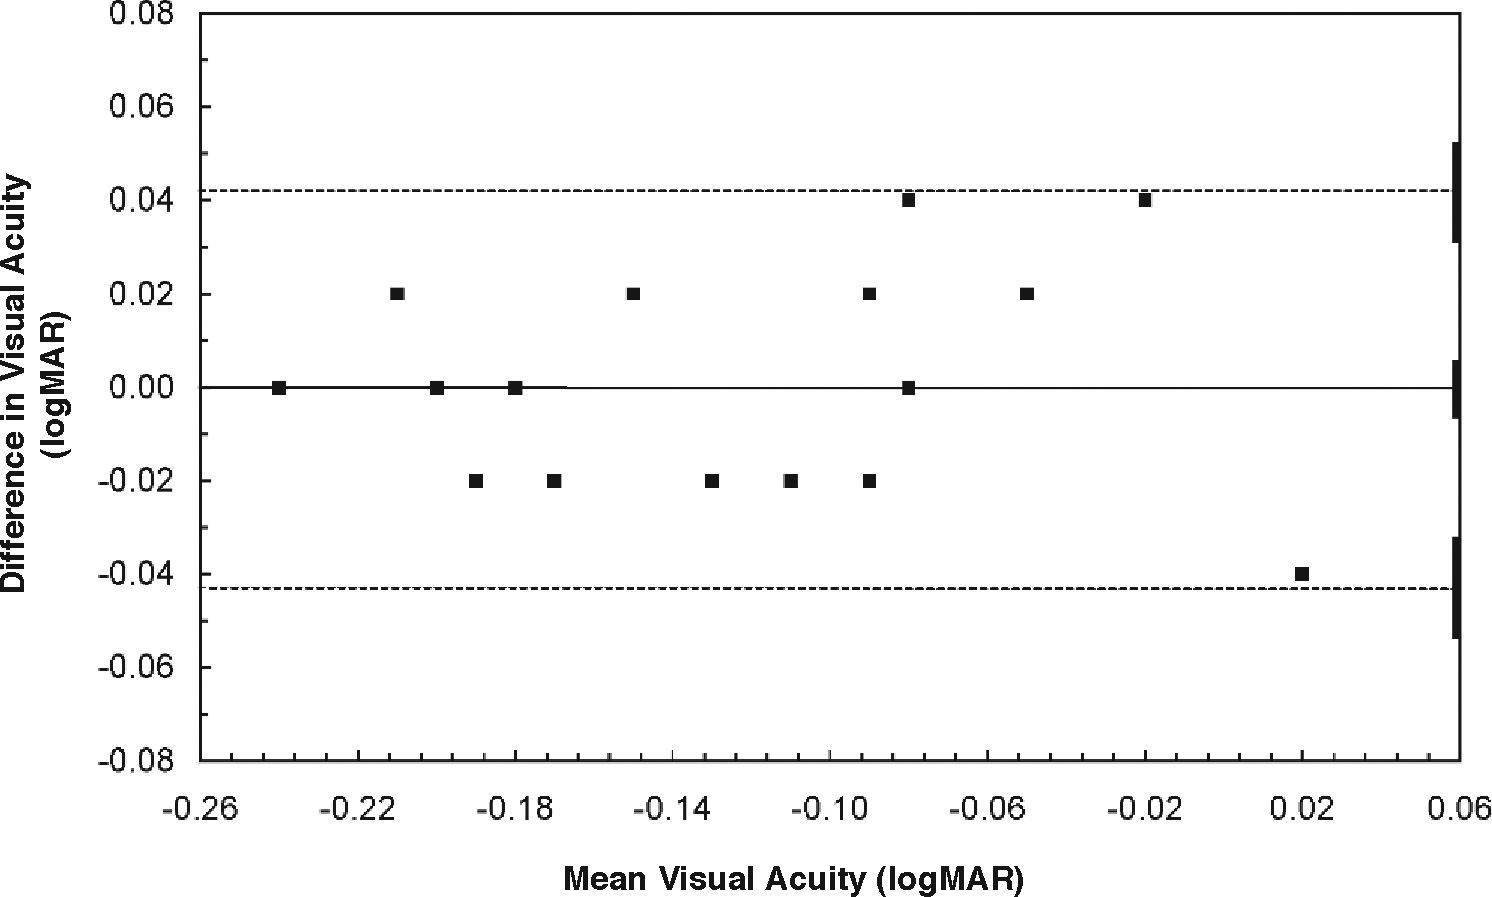
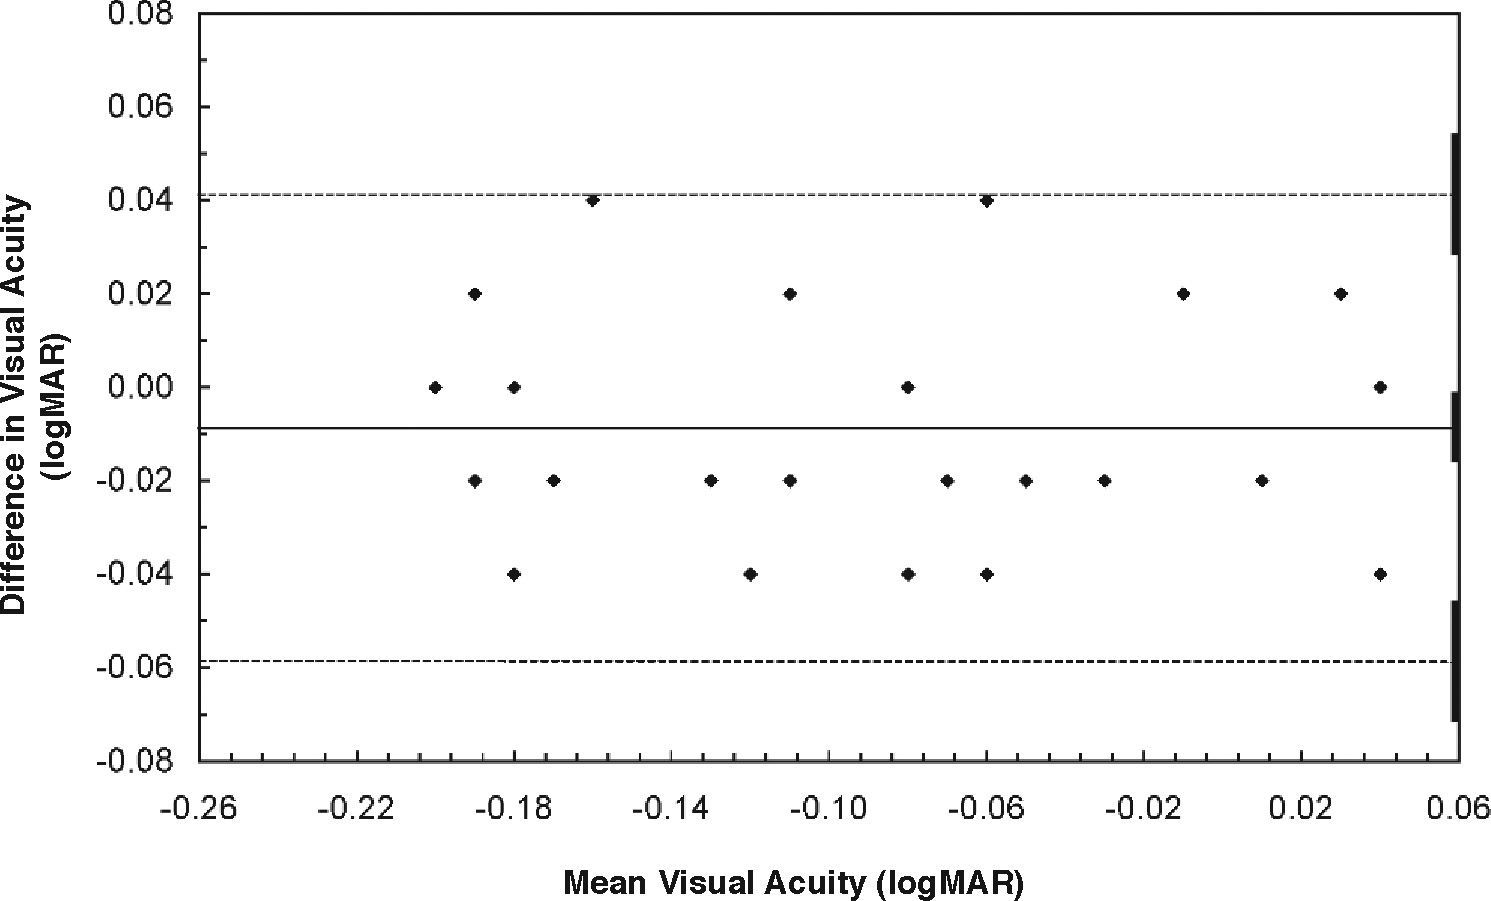
It was important to establish test repeatability values for each logMAR chart type: substantial variation of VA measurements on one or both of the test charts would not only introduce comparative chart measurement difficulties but also have implications for clinical usefulness. In other words, only if the acuity recorded on either chart at a second occasion differed from the original VA by more than the repeatability value could it be regarded as a real acuity change. Using the data of the test-retest patient group, the calculated mean paired (original minus repeat) difference for the letter chart was 0.000 logMAR units (SD 0.021, P=1.00); similarly, for the Landolt chart the calculated mean paired difference was -0.008 logMAR units (SD 0.025, P=0.05). The calculated 95% LoA are thus 0.042 logMAR units (or ±2.1 letters) for the letter chart and 0.049 logMAR units (or ±2.4 rings) for the Landolt chart. Test variability was slightly greater for the Landolt as compared to the letter chart, but only by a fraction (0.3) of a single optotype: however, importantly, both charts show test repeatability values that are within the ±0.067 logMAR units (±3.3 chart symbols) inter-chart 95% LoA mentioned above.
These repeatability data are summarised in figure 2 (letters) and figure 3 (Landolt rings). As found for the main group, the distribution was uniform in each case (letters: r=0.04, P=0.7; Landolt: r=0.02, P=0.8).
![LogMAR visual acuity limits of agreement plots for repeat testing: figure details as per figure 1. Repeat testing with letter chart: mean difference [original minus repeat] is 0.000 logMAR units, with LoA of ±0.042 logMAR units or ±2.1 chart letters.](https://static.elsevier.es/multimedia/18884296/0000000100000002/v1_201303141032/S1888429608700669/v1_201303141032/en/main.assets/gr2.jpeg?xkr=ue/ImdikoIMrsJoerZ+w93meMsSv3kCFu9ka1kgzl/xrK32s3f4YRcWD6Dd7AXarLafqfz0GCp6yfmc6kOkhhG9GoyjOOwT/AOlq8vKKVHbq6+S4b7WRAhNwg3BypXGyBCqf15PcBWga9r7NocKq9f2vYsOYefMio5+892g/ZybrVHd+Sqj+WpUkWTQjBFiy0b+VQykNH0t3u1oDqqcaDShDaeJLACqoc97pC41SoQsfbDUmkEmTTxyPymeJVPJsTjTACdy2ONPrhioFsagp4g== "LogMAR visual acuity limits of agreement plots for repeat testing: figure details as per figure 1. Repeat testing with letter chart: mean difference [original minus repeat] is 0.000 logMAR units, with LoA of ±0.042 logMAR units or ±2.1 chart letters.")
LogMAR visual acuity limits of agreement plots for repeat testing: figure details as per figure 1. Repeat testing with letter chart: mean difference [original minus repeat] is 0.000 logMAR units, with LoA of ±0.042 logMAR units or ±2.1 chart letters.
.")
Analysis of these new monocular recognition (letter) and resolution (Landolt) logMAR acuity data indicates: (i) a high correlation (0.89) was present between the acuity measurements obtained with the two charts; (ii) a higher mean VA (-0.041 logMAR units) was recorded with letters compared to Landolt optotype, with calculated 95% LoA equivalent to ±3.3 chart optotype; (iii) test repeatability for either chart type was smaller than the between chart 95% LoA, being equivalent to ±2.1 letters and ±2.4 Landolt rings, respectively.
Viewed from the clinician's perspective, although the inter-chart acuity difference was statistically significant, can this distinction be regarded as clinically relevant?
Fifty-five years ago Sloan24 considered that binocular acuity recorded with her chosen letter set was clinically equivalent to that recorded with Landolt symbols. A more recent investigation9 using the logMAR chart design format has reported that binocular acuity determined with Sloan letters was 0.038 logMAR units (1.9 letters) better than that recorded with Landolt rings; in the same investigation9 binocular VA obtained with British Standard letters was 0.005 logMAR units (0.25 letters) better than that with Landolt symbols.
While acknowledging that the monocular acuity testing in the work reported herein might produce an inter-study difference in the absolute values obtained, nevertheless it is hard to disagree with the conclusion of Raasch et al.9; namely, that acuity measured with letters (British Standard or Sloan sets) will tend to be slightly better and slightly more repeatable than that obtained with Landolt symbols.
Photopic chart (background) luminance in the present investigation and in the earlier study9 was similar and approximately equal to 160 cd/m2, this being the level advised by British Standard BS4274:19684 for sight testing. At this luminance value Sheedy et al.8 have also found letter acuity to be superior to Landolt ring acuity (whereas below approximately 120 cd/m2 the situation was reversed).
All of these results were obtained upon normally sighted subjects tested under ideal conditions. Do the same conclusions apply if subjects have compromised or pathologicallyimpaired vision? The “resolution versus recognition” issue has been investigated in young amblyopic individuals and normally sighted persons with simulated cataract, ametropia and inappropriate refractive correction;25 as well as in older persons with actual cataracts,10 and patients with macular holes before and after surgery.11 The consensus of these studies is that compared to letter acuity, the Landolt VA deficit increases and the associated variability of the results widens under adverse viewing conditions. This conclusion might be regarded as somewhat paradoxical, given that the identification of a letter is regarded as a more demanding or complex visual task than that of locating the break in a ring.24 It has also been observed that Landolt acuity is less compromised by changes in physical conditions such as test chart luminance compared to letter VA.8 However, it has long been appreciated that the legibility of individual letters varies considerably.1,24 And therein might lie the answer to the paradox:11 under non-optimum viewing conditions, particular constructional components of an otherwise indistinct letter might be distinguished, enabling cognitive recognition of that letter, a benefit denied the observer of a uniform stimulus configuration such as the Landolt ring. Extending this reasoning further, perhaps it is the case that Landolt acuity reflects an individual's retinal-based resolution ability; additional cognitive input refines the process and enhances the visual percept. Such considerations highlight the acknowledgement by many clinicians that letter and Landolt ring charts may have particular and appropriate applications depending upon the visual debility or the characteristics of the patient group under investigation.
Consequently, an extra informative dimension is provided by the comparative VA outcomes of subjects with compromised visual abilities. However, with normally sighted subjects tested under optimum conditions, we conclude that on the basis of the new data presented here an assumption of clinical equivalence between letter and Landolt VA is justified.


