

The objectives of this study were to determine whether the correction of higher-order aberrations (HOA) would be detectable by “normal” subjects and whether a full correction is necessary or better than a partial correction of the main HOA (i.e., spherical aberration (SA), coma and trefoil).
MethodsThree subjects made side-by-side comparisons between an uncorrected aberrations image (i.e., including typical HOA) and partially corrected variant images in order to determine which image was subjectively preferred.
ResultsThe subjective preference was found to be well correlated (r2=0.84) with the volume under the modulation transfer function (VMTF). A significant difference of subjective preference was found with change of SA correction (P=0.014) and with change of coma correction (P=0.009) but not with the correction of trefoil (P=0.133). Changing the VMTF by less than 6.3% did not induce a perceptible difference (i.e., subjective preference higher than 25%) whereas changing the VMTF by more than 10% often induced a perceptible difference. Moreover, based on the through-focus subjective preference curve, we obtained a just-noticeable level of defocus of 1/8 D.
ConclusionsThe subjective quality of vision of a subject with typical aberrations could be improved by either a partial (50%) or a full correction of both SA and coma, this gain being comparable to 1/8 D of defocus blur. However, the effect of the correction of the trefoil appears negligible. The VMTF is a good image quality metric to predict subjective preference. A perceptible difference in image quality can be obtained by changing the VMTF by 6.3 to 10%.
Los objetivos de este estudio eran determinar si sujetos “normales” serían capaces de detectar la corrección de las aberraciones de alto orden (AAO) y, asimismo, determinar si una corrección completa de dichas AAO (es decir, aberración esférica (AE), coma y astigmatismo triangular o trefoil) es necesaria y es más beneficiosa que una corrección parcial de las mismas.
MétodosTres sujetos realizaron la comparación de diversos pares de imágenes, colocadas una al lado de la otra: una simulando siempre un patrón de aberraciones sin corregir (es decir, incluyendo las típicas AAO) y otra, cambiante, correspondiente a una situación de aberraciones parcialmente corregidas. El sujeto tenía que indicar, para cada par de imágenes, aquella que prefería subjetivamente.
ResultadosSe encontró que existe una buena correlación (r2=0,84) entre la “preferencia subjetiva” y el volumen bajo la función de transferencia de modulación (en inglés, VMTF). Se halló que la preferencia subjetiva cambia de forma significativa al variar el grado de corrección de la AE (P=0,014), y también al variar el grado de corrección del coma (P=0,009). Sin embargo, el grado de corrección del astigmatismo triangular o trefoil no hizo variar significativamente (P=0,009) el valor de la preferencia sujetiva. Un cambio en el VMTF inferior al 6,3% no hizo que hubiera una diferencia perceptible entre ambas imágenes (es decir, un valor de preferencia subjetiva superior al 25%), mientras que un cambio en el VMTF superior al 10% sí que hizo a menudo que el sujeto percibiera una diferencia entre las correspondientes imágenes. Utilizando la curva de preferencia subjetiva en función del desenfoque, obtuvimos un nivel de desenfoque mínimo perceptible de 1/8 D.
ConclusionesLa calidad de visión subjetiva de un sujeto afectado por un patrón de aberraciones típico se podría mejorar realizando una corrección parcial (del 50%) o total tanto de la AE como del coma. La mejora en términos de calidad de visión sería comparable a la obtenida corrigiendo 1/8 D de desenfoque. Sin embargo, parece que la corrección del astigmatismo triangular o trefoil produce un efecto imperceptible e insignificante. El VMTF es un descriptor numérico de la calidad de imagen que resulta óptimo para predecir la preferencia subjetiva. Se puede lograr una diferencia perceptible en la calidad de imagen variando el VMTF entre un 6,3 y un 10%.
It is well known that the human eye is far from a perfect optical system and suffers from higher-order aberrations (HOA) besides defocus and astigmatism. Customized corrections, meaning complete or partial correction of the HOA, can now be achieved either by corneal refractive surgery, contact lenses or intraocular lenses. The questions coming up to mind are: what do we need to correct the HOA? Do the subjects see the difference? In other words, does the practitioner need to fully correct the HOA or is it better to leave a certain level of monochromatic aberrations? And if yes, which one(s)? What level?
In terms of visual performance, the benefit of a full correction of HOA has been well established.1-6 It varies between 1.2 and 1.6 concerning visual acuity and between 1.8 and 2.5 for contrast sensitivity. The gain is a function of retinal illuminance,7 pupil size and the amount of initial HOA, the larger the amount inducing the larger benefit.
However, in terms of subjective preference, Artal et al.8 observed that the visual system was adapted to the retinal image of its own eye; the best overall subjective image quality was obtained with a slightly blurred retinal image, indicating that the neural system is able to compensate for the effects of this blur. Moreover, Legras et al.9 using simulated images, studied the levels of single aberrations that a typical subject is just able to detect, and noticed that in presence of typical aberrations observers preferred a partial correction of spherical aberration (SA), leaving an average root-mean-square (RMS) value of SA of 0.1μm, rather than a full correction. Levy et al.10 measured the monochromatic aberrations of subjects with “supernormal” vision (i.e. visual acuity of 20/15 or better) and determined that the (RMS) value of SA was 0.1μm for pupils larger than 6mm. In the Piers's study,11 2 out of 5 subjects obtained a better 15 c/deg contrast sensitivity with negative SA, meaning that a full correction seemed not to be always the best solution.
The objectives of this study were to determine whether the correction of the main HOA (i.e., SA, coma and trefoil) would be detectable by “normal” subjects and whether a full correction is necessary or is better than a partial correction of the main HOA.
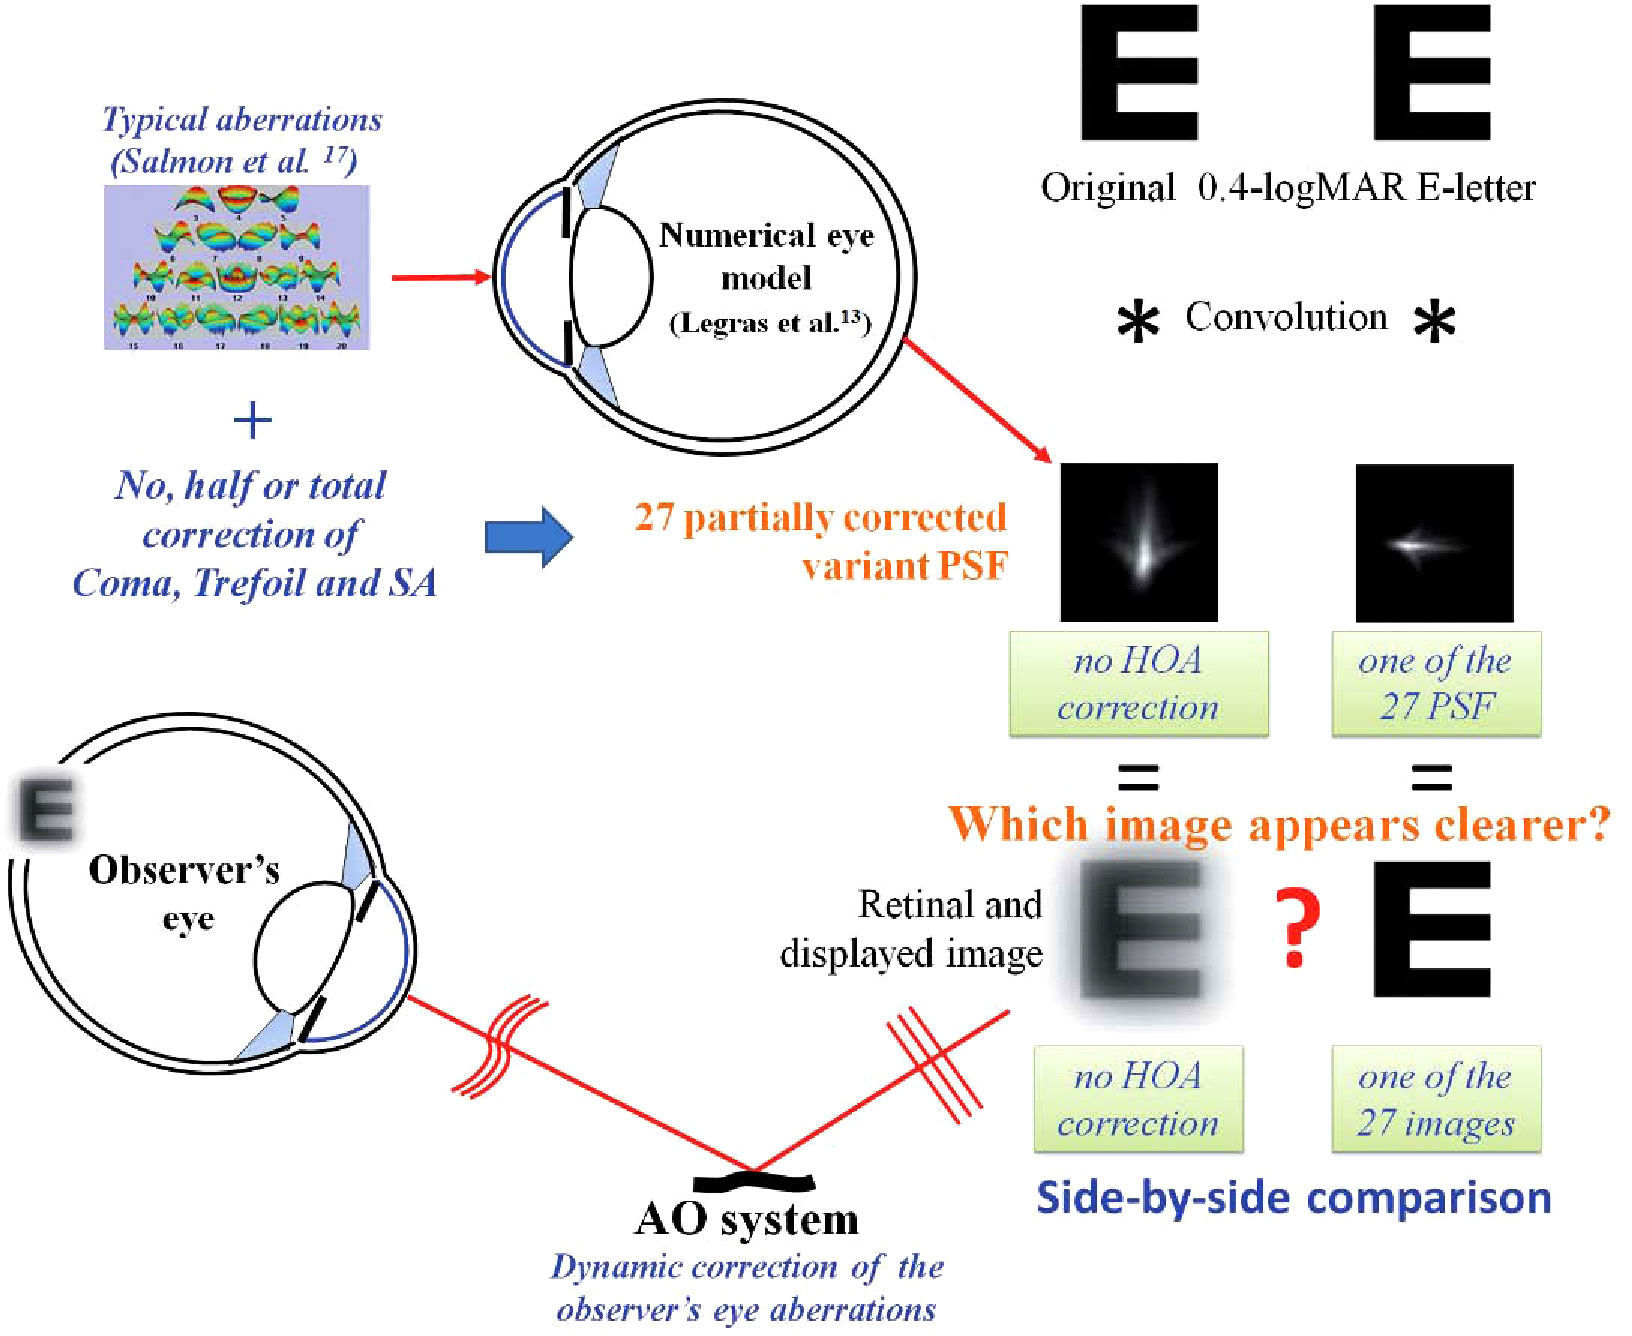
MethodsObservers made side-by-side comparisons between an image simulating uncorrected aberrations (i.e., including typical HOA) and partially corrected variant images, and were asked to determine which image they subjectively preferred. Figure 1 illustrates the general method.
. The partially corrected variant images were calculated in the same manner as the uncorrected image, except that one, two or three of the three main aberrations (i.e. SA, coma an trefoil) were fully, half or uncorrected. Consequently 27 partially corrected variant images were computed. Subjective preferences were measured using side-by-side presentations of the uncorrected image and a partially corrected variant image, the relative positions of the two images being varied randomly. The observer's task was to indicate which of the two side-by-side images appeared clearer.")
Illustration of the general method. The uncorrected retinal image was obtained by convolving an E-letter image of 0.4 logMAR of visual acuity with a filter corresponding to a typical reference eye (Salmon et al.17). The partially corrected variant images were calculated in the same manner as the uncorrected image, except that one, two or three of the three main aberrations (i.e. SA, coma an trefoil) were fully, half or uncorrected. Consequently 27 partially corrected variant images were computed. Subjective preferences were measured using side-by-side presentations of the uncorrected image and a partially corrected variant image, the relative positions of the two images being varied randomly. The observer's task was to indicate which of the two side-by-side images appeared clearer.
Three observers, aged between 22 and 37 years, in good ocular health, were enrolled in this study. The accommodation of the subjects was not paralyzed during the experiment. Informed consent was obtained from each subject according to the tenets of the Declaration of Helsinki.
ApparatusWe used the Imagine Eyes CRX1© device (Imagine Eyes, Orsay, France) to measure and dynamically correct the observer's eye aberrations. The subject viewed the simulated retinal images (see the section on image calculation) generated on the micro display (subtending a visual angle of 114×86 arcmin) through the adaptive optics system and through a 5.5mm artificial pupil. The wavefront correcting device is a deformable mirror having 52 independent magnetic actuators. The control of the deformable mirror surface is accomplished by a commercially available program (HASO© CSO, Imagine Eyes, Orsay, France), which reshapes the deformable mirror from its normally flat surface to a shape that corrects the aberrations up to the 5th order (18 Zernike coefficients).12 During the dynamic correction procedure, the typical residual ocular aberrations level of the observer was an RMS value of 0.1μm for a 5.5mm pupil diameter. The frequency of the dynamic correction was around 1Hz. The display was linearized using a Topcon BM3 luminance meter with a mean luminance of 42cd/m2, which corresponds to a retinal illuminance of 1000 Td for a 5.5mm pupil diameter. The emission spectrum of the display was measured and was taken into account in the retinal image calculations. The pupil centre was aligned with the optical axis of the set-up, and its position was maintained using the control handwheel of the CRX1 device, providing us a quick, smooth and fine adjustment. The pupil position and size was monitored using a CCD camera. The subject's pupil was not artificially dilated since the experiments were performed in dim surrounding illumination providing us with a subject's pupil diameter higher than 5.5mm and avoiding reflections. The subject indicated, by pressing the buttons of a keypad, which of the two targets appeared clearer.
Image calculationThe uncorrected retinal image was obtained by convolving a E-letter image of 0.4 logMAR of visual acuity (6/15 Snellen equivalent), with a filter representing a typical reference eye; that is, having a monochromatic and chromatic aberration pattern corresponding to the average normal adult population. The complete description of the method and its validation have been previously published.13 The filters were calculated in a matrix of 512×512 pixels having each an angular size of (θp) of 4.57×10⁻⁵ rad/pixel (0.157 arcmin/pixel). Since we want to simulate the image of a Snellen letter corresponding to 0.4 logMAR of visual acuity (angular size of detail of 2.5 arcmin or 7.31×10⁻⁴ rad), the size, in pixels, of the detail of the object is the ratio between the angular size of the detail (visual acuity) and the angular distance between two pixels of the filter. The final size of the letter is 5 and 4 times the detail size in height and width, respectively. The size of the detail of the letter in pixels will be,
and the letter size will be 80×64 pixels. Around this matrix (80×64pixels), white pixels are added to yield a matrix of 512×512 pixels corresponding to the same size as the filter (i.e., a total subtense of 1.34×1.34 degrees).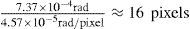
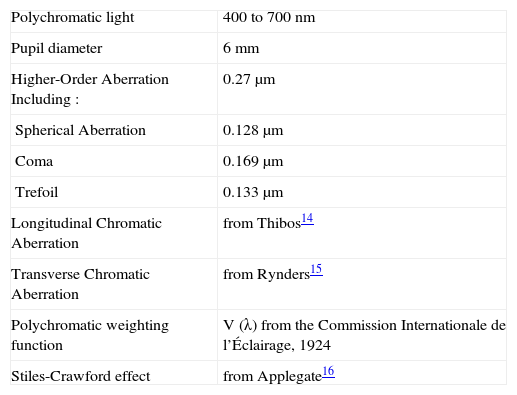
Table 1 shows details of the filters. Since longitudinal chromatic aberration varies little between subjects, typical values were taken from the literature.14 Typical amounts of transverse chromatic aberration were also assumed15 and allowance was made for the Stiles-Crawford effect.16
Detail of the filter
| Polychromatic light | 400 to 700nm |
| Pupil diameter | 6mm |
| Higher-Order Aberration Including : | 0.27μm |
| Spherical Aberration | 0.128μm |
| Coma | 0.169μm |
| Trefoil | 0.133μm |
| Longitudinal Chromatic Aberration | from Thibos14 |
| Transverse Chromatic Aberration | from Rynders15 |
| Polychromatic weighting function | V (λ) from the Commission Internationale de l’Éclairage, 1924 |
| Stiles-Crawford effect | from Applegate16 |
We used the collected data of Salmon and van de Pol17 to determine the typical monochromatic aberration levels up to the 6th order of our reference eye, as listed in table 1. Since these pooled data were averages of Zernike coefficients, the “typical” sign of each aberration was lost. However, we anticipated that the sign of aberrations should not impact the measurements since Legras's results9 showed, in similar conditions of experiment, that positive and negative SA, defocus and astigmatism have comparable effect on subjective vision.
The partially corrected variant images were calculated in the same manner as the uncorrected image, except that in this case one, two or three of the three main aberrations (i.e., SA, coma and trefoil) were either fully corrected, half corrected or were left uncorrected. Consequently, 27 partially corrected variant images were computed.
For each aberration condition, the defocus term was adjusted so as to maximize the volume under the modulation transfer function (MTF) calculated between 5 and 15 cycles per degree (c/deg). The boundary frequencies were chosen according to the results of Legras el al.,9 which showed that this image quality metric calculated over this spatial frequency band could well predict the preferred defocus term. Earlier, Granger and Cupery18 made a quite similar observation. In fact, they obtained a very nice correlation (r=0.988) between their Subjective Quality Factor (i.e., volume under the MTF between 3 and 12 c/deg) and subjective image quality.
Psychophysical methodA method of constant stimuli was used. The subjective preferences were measured using side-by-side presentations of the uncorrected image and of a partially corrected variant image, the relative positions of the two images changing randomly. The observer's task was to indicate which of the two side-by-side images appeared clearer. A forced-choice method was used; in other words, the response “equal” was not accepted. Each partially corrected variant image was compared fifty times with the uncorrected image. The metric “subjective preference” was defined as the percentage of times that the uncorrected image, rather than one of the 27 partially corrected images, was chosen as preferred. A discrimination probability lower than 50% indicates that the partially corrected variant image appeared clearer than the uncorrected image.
Just-noticeable defocusUsing the same experimental conditions than in the just-noticeable-aberrations-correction experiment, the just-noticeable effect of defocus was measured. We calculated a series of retinal images, each corresponding to a different proximity of the same uncorrected eye (that is, an eye with typical higher-order aberration levels). Each defocused image was compared fifty times to the focused image.
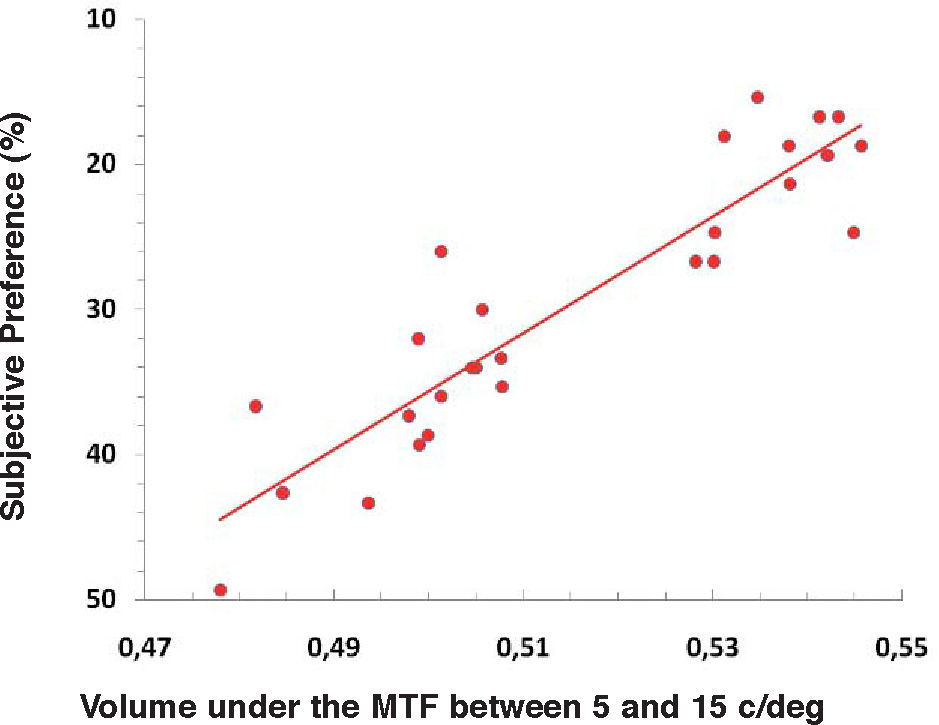
ResultsWe calculated the volume under the MTF (VMTF) between 5 and 15 c/deg for each aberration condition (i.e., partially corrected wavefront). In figure 2, the subjective preference (i.e. percentage of times that the uncorrected image was chosen to be the clearest rather than one of the 27 partially corrected images) was plotted as a function of the VMTF. Subjective preference and VMTF were well correlated (r2=0.84).
 and the VMTF image quality metric (r2=0.84).")
An analysis of variance (ANOVA, each subject was considered as a replication of the experiment which has a three-factor design) was carried out to compare the change in subjective preference with each scenario of aberration correction. A significant difference of subjective preference was found with the change of SA correction (P=0.014) and with the change of coma correction (P=0.009) but not with the correction of trefoil (P=0.133).
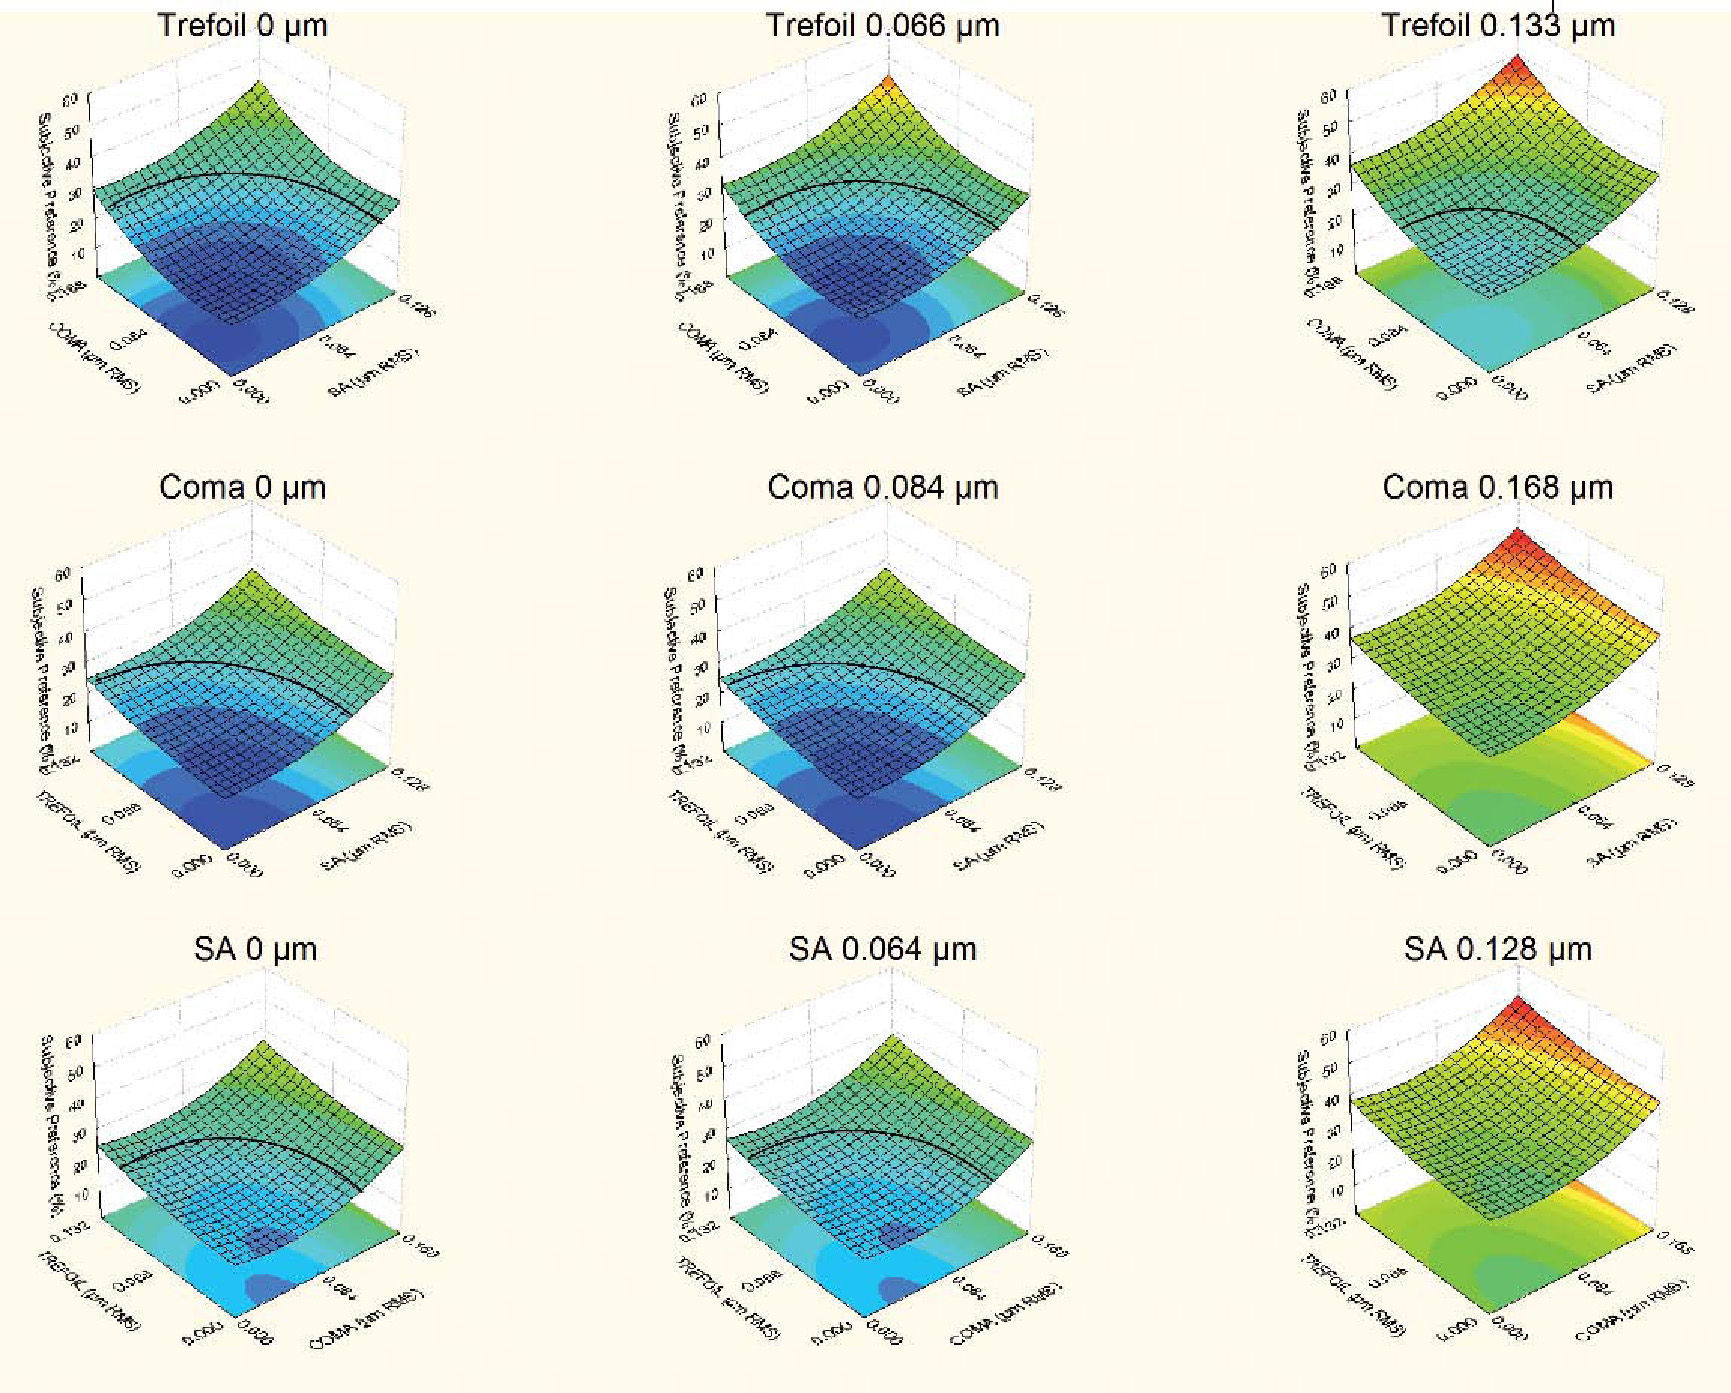
Figure 3 shows subjective response surfaces as a function of two of the three main aberrations when the third aberration was fixed at a given level. As an example, the surface at the top left-hand corner represents the subjective preference as a function of SA and coma with a full correction of the trefoil (i.e., trefoil= 0μm RMS). A discrimination probability of 50% (i.e., the level of chance) indicates that there is no difference between the two images, a subjective preference of 0% indicates that the partially corrected image is always preferred to the uncorrected image. We established the threshold of detectability to be half-way between these two values (i.e., 25%). The blue surface (i.e., subjective preference lower than 25%) corresponds to an area of detectable improvement, meaning that the partially corrected images corresponding to this region were subjectively preferred to the uncorrected image. When coma and SA were not corrected, (centre right-hand and bottom right-hand surfaces in figure 3), none of the partially corrected variant images was subjectively preferred.
 correspond to area of detectable improvement meaning that the partially corrected images of these regions were subjectively preferred than the uncorrected image. The black line is the 25% subjective preference limit.")
Subjective response surfaces as a function of various levels of aberration corrections. The three surfaces of the upper line correspond to the subjective response as a function of remaining levels of coma and SA for three levels of remaining trefoil. The middle line represents the subjective responses as a function of remaining levels of trefoil and SA for three levels of remaining coma. The three surfaces of the lower line correspond to the subjective response as a function of remaining levels of coma and trefoil for three levels of remaining SA. Blue surfaces (i.e. subjective preference lower than 25%) correspond to area of detectable improvement meaning that the partially corrected images of these regions were subjectively preferred than the uncorrected image. The black line is the 25% subjective preference limit.
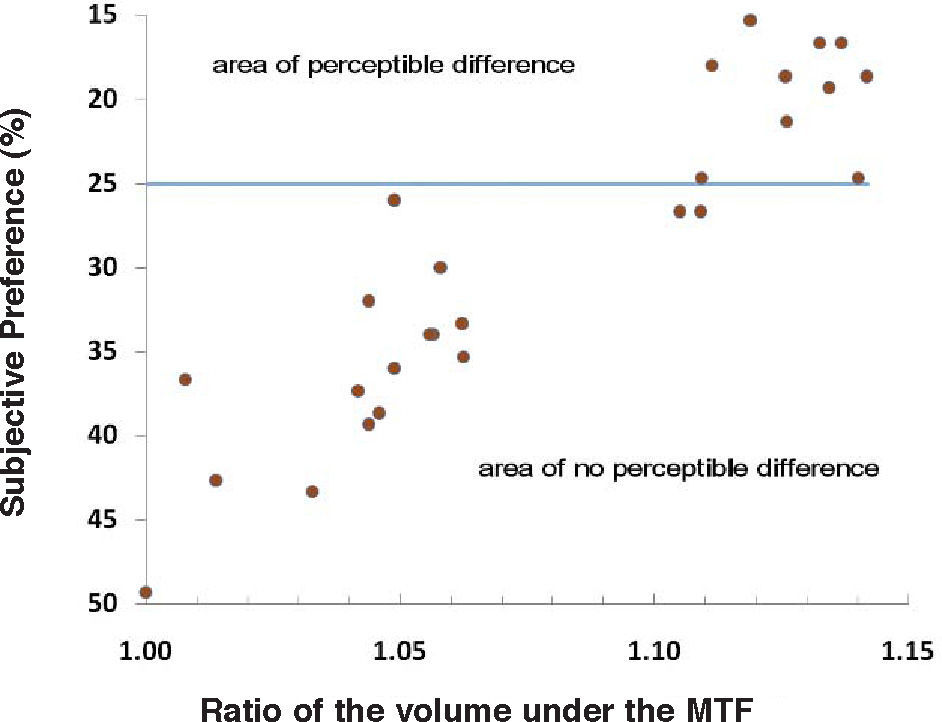
We calculated the ratio between the VMTF of each aberration correction condition and the VMTF of the uncorrected aberration condition. Figure 4 represents subjective preference as a function of VMTF ratio. Changing the VMTF by less than 6.3% did not induce a perceptible difference (i.e., a subjective preference above 25%) whereas changing the VMTF by more than 10% often (i.e., always except for 2 cases) induced a perceptible difference.
 induced a perceptible difference.")
Subjective preference as a function of VMTF ratio. The blue line corresponds to the 25% subjective preference limit. Changing the VMTF by less than 6.3% did not induce a perceptible difference whereas changing the VMTF by more than 10% often (i.e. except in 2 cases) induced a perceptible difference.
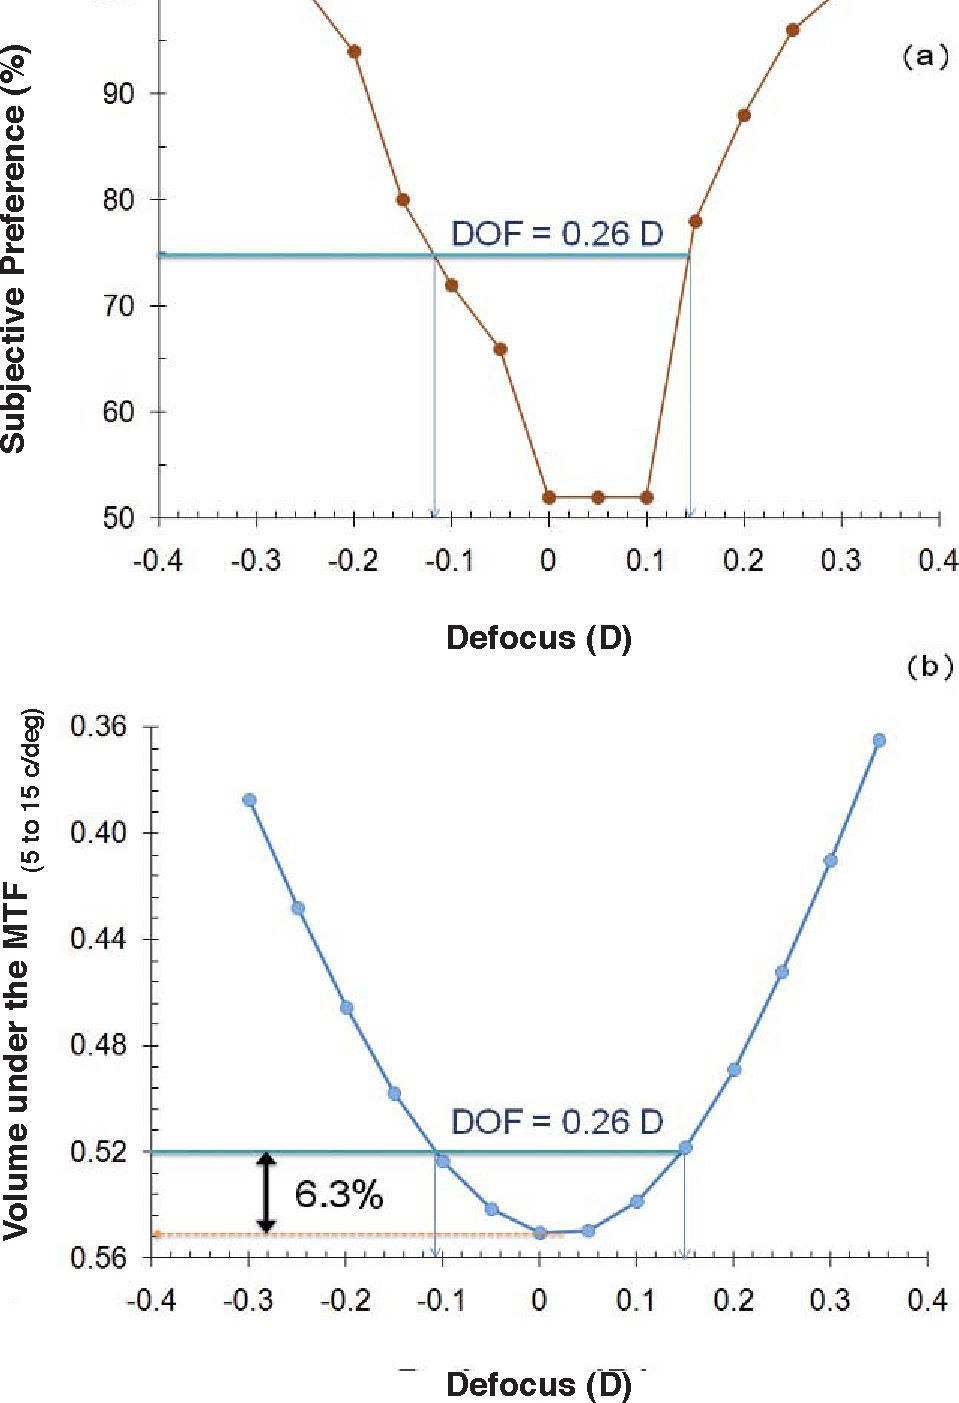
Figure 5a illustrates the through-focus subjective preference curve. A discrimination probability of 50% (i.e., the level of chance) indicates that there is no difference between the two images, a subjective preference of 100% indicates that the focused image is always preferred to the defocused image. We established the threshold of detectability to be half-way between these two values (i.e., 75%). Consequently, a subjective preference equal or higher than 75% indicates that the added defocus was detected. Depth-of-focus (DOF) was defined as the range of proximities where the subjective preference was lower than 75%; that is, that no difference in the retinal image was observed in this range. DOF was around a quarter of a diopter (0.26 D). The just-noticeable level of defocus was around 1/8 D. Figure 5b shows the through-focus VMTF curve. We read on the curve the value of VMTF for which we measured 0.26 D of DOF. Consequently, this value corresponds to the level of VMTF that was just detectable. The ratio between the peak of VMTF, corresponding to the 0 D defocus case, and the just detectable VMTF was 1.063 (6.3%).
 Through-focus subjective preference curve. The subjective preference is plotted as a function of the spherical defocus. The depth-of-focus was evaluated as the range over which a subjective preference of 75% or lower is obtained. (b) Through-focus VMTF curve. The VMTF is plotted as a function of the spherical defocus. The blue line represents the level of VMTF for which we measured the 0.26 D of DOF evaluated on the upper figure. The red line corresponds to the maximize VMTF. The ratio between both gives the just detectable VMTF (black arrow).")
(a) Through-focus subjective preference curve. The subjective preference is plotted as a function of the spherical defocus. The depth-of-focus was evaluated as the range over which a subjective preference of 75% or lower is obtained. (b) Through-focus VMTF curve. The VMTF is plotted as a function of the spherical defocus. The blue line represents the level of VMTF for which we measured the 0.26 D of DOF evaluated on the upper figure. The red line corresponds to the maximize VMTF. The ratio between both gives the just detectable VMTF (black arrow).
As previously observed,9,18,19 subjective preference was found to be well correlated to VMTF. The volume calculations were often9,18 performed taking as lower and upper limits of the MTF curve values around 5 and 15 c/deg, respectively. This result confirmed that each partially corrected variant image has been tested with the better defocus term, implying that defocus did not take part in the image degradation. SA and coma had a significant impact on subjective preference whereas trefoil had no significant effect, even if correcting trefoil improved the subjective image quality (i.e., lower subjective preference of the uncorrected image). As previously observed with visual acuity,20-22 wavefront error concentrated near the center of the pyramid (e.g., SA and coma) were more detrimental to subjective quality of vision than those modes near the edge of the pyramid (e.g., trefoil). More recently, Fernández-Sánchez et al.23 observed a similar loss of visual acuity and contrast sensitivity with around 1μm of coma and trefoil. This result suggests that modes at the edge of the pyramid (e.g., trefoil) could have a similar impact to those modes near the center of the pyramid (e.g., coma), which seems to be in contradiction with previous results.20-22 The important level of aberrations introduced may partly explain this discrepancy. The way used to introduce the coma or trefoil should also explain the difference. In previous studies, the aberrations were introduced either by calculation20,21 or using a deformable mirror,22 whereas Fernández-Sánchez induced the 3-rd order aberrations with purpose-designed soft contact lenses. Centration, movement, rotation and flexure of the contact lenses may have changed the shape of the wavefront that would be introduced. Correcting the trefoil induced a change in the VMTF, calculated within the 5–to-15 c/deg range, by only 2.5% whereas correcting SA or coma changed the VMTF by more than 7%. Therefore, it is not surprising to observe a larger improvement in subjective vision quality when correcting SA or coma. However, we have to take into account that the value corrected for trefoil (0.133μm) was smaller than coma (0.168μm), but similar to SA (0.128μm). Even without any correction of the trefoil, a full or a half correction of SA and coma induced a noticeable improvement of the subjective image quality (i.e., a subjective preference equal to or lower than 25%). The biggest improvement in the subjective response occurred between the uncorrected condition and the half–correction scenario. The full correction did not necessarily increase significantly the subjective response, as illustrated in figure 3. In other words, the best subjective quality of vision did not necessarily occur with the best eye optics. This result is in accordance with Levy's study,10 who observed that subjects with “supernormal” vision (i.e., visual acuity of 20/15 or better) had simply normal eye optics, and also with previous studies,8,9,11 where best subjective preferences did not occur always with the best eye optics.
In order to compare the effect of HOA correction and defocus, we computed the just-noticeable level of defocus. A 1/8 D of defocus was found to be just detectable, meaning that the potential effect of correcting the three main aberrations of a typical eye is comparable to the effect of 1/8 D of defocus.
In conclusion, even if the correction of the HOA is detectable, typical observers with large pupil size (i.e., 6mm) will only gain a benefit comparable to the effect of 1/8 D, which appears negligible in comparison with the others sources24 of image degradation such as chromatic aberration and errors of focus (i.e., lead or lag of accommodation) and sources of variation of the monochromatic aberrations such as fluctuations of accommodation, variation of the thickness of the corneal tear film after a blink. Consequently, customized correction appears not to be appropriate for a typical population.
Changing the VMTF by less than 6.3% did not induce a perceptible difference, whereas changing the VMTF by more than 10% induced a perceptible difference. This result was previously observed by Scott,25 who noticed that a perceptible difference in image quality can be obtained by changing the MTF by 5 to 10%. This metric should help the manufacturers when inspecting their contact lenses since it could allow them to predict if the optical error found in the contact lens would be detectable by the subjects. This metric could also serve as a baseline to decide whether or not an aberration should be corrected when performing a laser surgery or designing an intraocular lens.
We tested this metric (VMTF) in order to predict the DOF of the naked eye. Based on the just-noticeable criterion, we obtained a DOF of 0.26 D. Under similar experimental conditions, Legras et al.9 measured an average DOF of 0.28 D. Campbell,26 using essentially a comparative method like ours, evaluated the monocular DOF of one subject by considering the range of focussing error for which no blur is perceptible. He found a DOF of 0.36 D, which is similar to our result. We read from the through-focus VMTF curves the VMTF value corresponding to a defocus of 0.26 D. The ratio between this value and the in-focus VMTF was 1.063, meaning that changing the MTF by 6.3% induced a noticeable change in the perception of the defocus blur. This level is within the range of noticeable change (i.e., 6.3% to 10%) observed under the various aberration-correction conditions. In conclusion, the VMTF metric is able to predict the DOF of the naked eye and should be able to predict the DOF of an eye wearing a multifocal optical design, for instance. In this way, optical designers could predict the enhanced DOF resulting from a new multifocal design without the need to manufacture the lens and test it by means of clinical studies, thus saving time and money.


