


To test the accuracy of Schiotz tonometry (ST) in patients that underwent photorefractive keratectomy (PRK).
Methods175 eyes previously treated with PRK for myopia, myopic astigmatism or mixed astigmatism, with a mean preoperative spherical equivalent (SE) of −4.27±2.83 diopters (range: -13 to −0.25 diopters), had their intraocular pressure (IOP) measured, at least 3 months after PRK, with Goldmann applanation tonometry (GAT) and ST with both 5.5-g and 10-g load and also utilizing the Friedenwald nomogram. These measurements were retrospectively compared to the IOP readings obtained with GAT before surgery.
ResultsBefore PRK the mean IOP, as measured with GAT, was 14.7±2.63mmHg. After PRK, the mean IOP readings were 10.9±2.85mmHg (P<0.001) with GAT, 13.58±3.42mmHg (P<0.001) with 5.5-g load ST; 12.32±3.67mmHg (P<0.001) with 10-g load ST, and 16.19±5.63mmHg (P<0.001) with the Friedenwald nomogram. The different methods showed a poor agreement, the worst one being between GAT before surgery and the Friedenwald nomogram (r2=0.05). Moreover, ST with both 5.5g and 10g load showed an underestimation (more pronounced for the 10-g than for the 5.5-g load) that increased with the amount of treatment.
ConclusionsAlthough ST with a 5.5g load seems to be more accurate to measure the true IOP in patients that have undergone PRK compared to the Goldmann technique, it cannot be considered to be accurate in a sufficient number of cases. IOP measurement after refractive surgery is still a problem, and further studies are needed to overcome it.
Evaluar el grado de precisión de la tonometría de Schiotz (TS) en pacientes que se han sometido a una operación de queratectomía fotorrefractiva (en inglés, PRK).
MétodosSe midió la presión intraocular (PIO) de 175 ojos que habían sido previamente tratados con PRK de miopía con o sin astigmatismo, con una refracción preoperativa (equivalente esférico, o SE) de −4.27±2.83 (rango: -13 a -0,25 dioptrías). Las medidas, realizadas al menos transcurridos 3 meses desde la operación de PRK, utilizaron las técnicas de tonometría por aplanación de Goldmann (TAG) y la TS, esta última con cargas de 5,5g, de 10g y utilizando un nomograma de Friedenwald. Estas medidas se compararon retrospectivamente a los valores de PIO obtenidos con TAG antes del procedimiento quirúrgico.
ResultadosAntes de la PRK, la PIO media obtenida con TAG fue de 14,7±2,63mmHg. Después de la PRK, la PIO resultante fue de 10,9±2,85mmHg (P<0,001) con TAG; de 13,58±3,42mmHg (P<0,001) con TS y una carga de 5,5g; de 12,32±3,67mmHg (P<0,001) con TS y una carga de 10g; y de 16,19±5,63mmHg (P<0,001) con TS y utilizando un nomograma de Friedenwald. Los resultados revelan una mala concordancia, siendo las medidas con TAG antes de la operación y las que utilizaron un nomograma de Friedenwald (r2=0,05) las que produjeron la peor concordancia. Además, la TS tanto con carga de 5,5g como con carga de 10g produjeron estimaciones de la PIO por debajo del valor real (con carga de 10g incluso peores que con carga de 5,5g), siendo dicho error mayor para aquellos ojos operados de un error refractivo mayor.
ConclusionesA pesar de que la TS con carga de 5,5g parece que resulta un método más preciso que la técnica de Goldmann para medir la PIO real en pacientes que se han sometido a PRK, no se puede concluir que sea un método preciso en un número suficientemente elevado de ojos. La medida de la PIO tras la cirugía refractiva sigue constituyendo un problema por lo que, para lograr resolverlo, será necesario realizar nuevos estudios.
The measurement of intraocular pressure (IOP) after refractive surgery is one of the most challenging problems. Following a refractive surgery procedure, such as myopic photorefractive keratectomy (PRK), and laser in situ keratomileusis (LASIK), both applanation (GAT) and non-contact (NCT) tonometry have been reported to underestimate the IOP, so different methods such as pneumotonometry or dynamic contour tonometry have been proposed to overcome this problem.1-5
In two case reports,6,7 indentation tonometry with a Schiotz tonometer (ST) has been able to detect increases in IOP after LASIK undetected by GAT. However, excluding these case reports, we were unable to find in the literature (we did a computer search using the PubMed database of the National Library of Medicine) any extensive study proving the real efficacy of this method after refractive surgery.
For this reason we decided to test the accuracy of ST in patients that had undergone PRK.
MethodsOne hundred and seventy-five eyes of 105 patients (42 males and 63 females) that had been previously treated with PRK for myopia, myopic astigmatism or mixed astigmatism in our Department were included in this clinical study. The research followed the tenets of the Declaration of Helsinki; informed consent was obtained from the subjects after explanation of the nature and possible consequences of the study; the research was approved by the institutional human experimentation committee.
The age of the patients at the time of refractive surgery ranged from 20 to 59 (mean±SD = 32±8.7 years). All treatments were performed under topical anesthesia with oxybuprocaine eye drops. The lids were kept open with a speculum, the epithelium debrided with a mechanical brush and all treatments performed with a 193nm excimer laser (Nidek EC 5000, Nidek Co. Ltd, Japan) operating in scanning mode. After treatment a smoothing of the surface was performed using a 0.04% hyaluronic acid solution. A bandage contact lens was applied under sterile conditions on the treated eye immediately following surgery, and was left until complete re-epithelialization. During this period the operated eyes received the following medications: Diclofenac sodium 0.1% eye drops twice a day for the first 2 days, nethylmicin preservative-free eye drops until re-epithelialization and preservative-free artificial tears for 1 month. After re-epithelialization, clobetasone eye drops were prescribed to all patients for 1 month in a tapered dose, as follows: one drop four times a day for the first week, one drop three times a day for the second week, one drop twice a day for the third week, and one drop once a day for the last week.
The IOP was evaluated both with GAT and ST. In particular, GAT was performed first and ST followed 10minutes later both with a 5.5-g and a 10-g load. The measurements were performed by two different observers, the second one not being aware of the results obtained by the first one.
Both 5.5 and 10g load were used to calculate the IOP with the Friedenwalt nomogram. These postoperative values were compared with the GAT readings obtained before surgery as these values can be considered IOP real values.
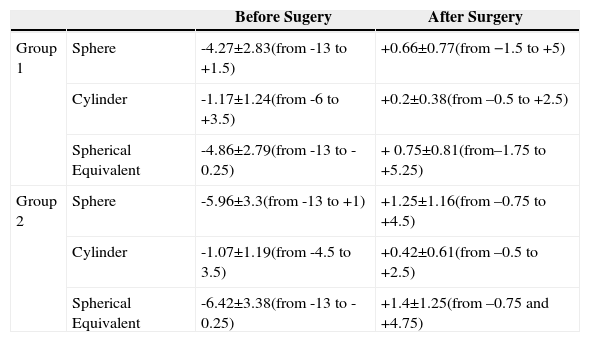
To further validate our study, for those 49 patients that had had surgery only in one eye, we subtracted the change in GAT reading obtained in the fellow non-operated eye, from the change in the treated eye; these values were compared to ST readings. The refraction of the eyes in both groups before and after surgery is summarized in table 1. The refraction of the 49 unoperated fellow eyes ranged from -9 D to + 1 D (mean ±SD = -4.59±2.32 D) of sphere, the cylindrical power from −3 D to 0 D (mean ±SD = -0.83±1.1 D) and the spherical equivalent refraction from -10 D to -1 D (mean ± SD = -3.78±2.81 D).
Refraction (diopters) of the eyes included in groups 1 and 2, both before and after surgery
| Before Sugery | After Surgery | ||
| Group 1 | Sphere | -4.27±2.83(from -13 to +1.5) | +0.66±0.77(from −1.5 to +5) |
| Cylinder | -1.17±1.24(from -6 to +3.5) | +0.2±0.38(from –0.5 to +2.5) | |
| Spherical Equivalent | -4.86±2.79(from -13 to -0.25) | + 0.75±0.81(from–1.75 to +5.25) | |
| Group 2 | Sphere | -5.96±3.3(from -13 to +1) | +1.25±1.16(from –0.75 to +4.5) |
| Cylinder | -1.07±1.19(from -4.5 to 3.5) | +0.42±0.61(from –0.5 to +2.5) | |
| Spherical Equivalent | -6.42±3.38(from -13 to -0.25) | +1.4±1.25(from –0.75 and +4.75) |
Analyses were carried out using Microsoft Excel 7 (Microsoft Corp., Seattle, USA) and GraphPad InStat version 3.0 (GraphPad Software, San Diego, USA). The statistical evaluation was performed with a paired two-tailed Student's T test and with Bland Altmann correlation. For this latter evaluation we decided to ascribe some significance only to changes outside the ±2mmHg interval, as it had been shown that if single tonometry readings are used by the same observer, they must differ by at least 4.5mmHg before it can be said that the IOP is different; for variations of smaller magnitude there is only a 10% chance that this difference is due to a change alone.8 Moreover, Whitacre and Stein9 recommended not to ascribe any clinical significance to changes in the IOP measured across two different measurement sessions that were smaller than 2-3mmHg.
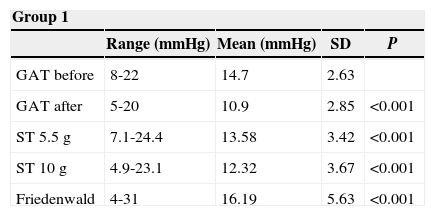
ResultsThe IOP as measured with GAT before PRK and with GAT and ST after PRK, for group-1 patients, is summarized in table 2. The correlation between the IOP measured before and after surgery with GAT and the ST measurements (5.5 g, 10g, and nomogram to take into account the variations in scleral rigidity across patients) is shown in Figures 1 to 8.
Ranges, means, standard deviations (SD) and P values between GAT before surgery and GAT, ST 5.5 g, ST 10 g and Fiendewald nomogram after PRK in group 1
| Group 1 | ||||
| Range (mmHg) | Mean (mmHg) | SD | P | |
| GAT before | 8-22 | 14.7 | 2.63 | |
| GAT after | 5-20 | 10.9 | 2.85 | <0.001 |
| ST 5.5 g | 7.1-24.4 | 13.58 | 3.42 | <0.001 |
| ST 10 g | 4.9-23.1 | 12.32 | 3.67 | <0.001 |
| Friedenwald | 4-31 | 16.19 | 5.63 | <0.001 |
.")
.")
.")
.")
Bland-Altman plot between GAT before surgery and ST 5.5 g after surgery for group-1 patients. Solid line represents the average difference between methods; dotted lines represent 95% the Confidence Interval limits. Broken line represents the correlation line (r2=0.0745, P=0.0003).
.")
.")
Bland-Altman plot comparing GAT before surgery and ST 10 g after surgery for group-1 patients. Solid line represents the average difference between methods; dotted lines represent the 95% Confidence Interval limits. Broken line represents the correlation line (r2=0.1165, P<0.0001).
.")
.")
Bland-Altman plot comparing GAT before surgery and ST 10 g after surgery for group-1 patients. Solid line represents the average difference between methods; dotted lines represent the 95% Confidence Interval limits. Broken line represents the correlation line (r2 = 0.4317, P<0.0001).
In Particular, Bland-Altman plots show that the comparison of ST with preoperative GAT readings (Figures 4, 6 and 8) reveals a proportional error, as the differences are negative in case of low IOP measurements and positives in case of higher IOP values, mainly when we used the Friedenwald nomogram.
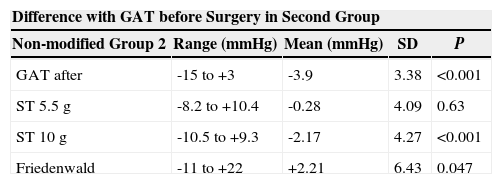
Similarly, the values ranges, means, standard deviations and P values corresponding to the differences of GAT before PRK and GAT and ST after PRK for the second group are shown in table 3.
Ranges, means, standard deviations (SD) and P values between the differences of GAT before PRK and GAT, ST 5.5 g, ST 10 g and Fiendewald nomogram after PRK in the second group
| Difference with GAT before Surgery in Second Group | ||||
| Non-modified Group 2 | Range (mmHg) | Mean (mmHg) | SD | P |
| GAT after | -15 to +3 | -3.9 | 3.38 | <0.001 |
| ST 5.5 g | -8.2 to +10.4 | -0.28 | 4.09 | 0.63 |
| ST 10 g | -10.5 to +9.3 | -2.17 | 4.27 | <0.001 |
| Friedenwald | -11 to +22 | +2.21 | 6.43 | 0.047 |
Moreover, for Group 2, at the same follow-up interval of the operated eye (before and at least 3 months after surgery), in the non-operated eye, GAT showed a difference that ranged between -6mmHg and +5mmHg (mean ±SD = −0.58±2.21mmHg), with a non-significant difference (P=0.122).
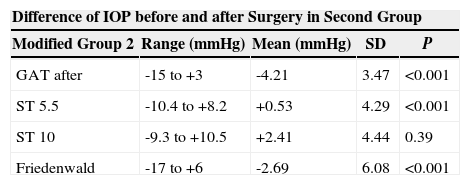
The same values obtained subtracting the change measured with GAT in the untreated eye from the change in the treated eye are shown in table 4.
Ranges, means, standard deviations (SD) and P values between the differences of GAT before PRK and GAT, NCT, ST 5.5 g, ST 10 g and Fiendewald nomogram after PRK in the modified second group
| Difference of IOP before and after Surgery in Second Group | ||||
| Modified Group 2 | Range (mmHg) | Mean (mmHg) | SD | P |
| GAT after | -15 to +3 | -4.21 | 3.47 | <0.001 |
| ST 5.5 | -10.4 to +8.2 | +0.53 | 4.29 | <0.001 |
| ST 10 | -9.3 to +10.5 | +2.41 | 4.44 | 0.39 |
| Friedenwald | -17 to +6 | -2.69 | 6.08 | <0.001 |
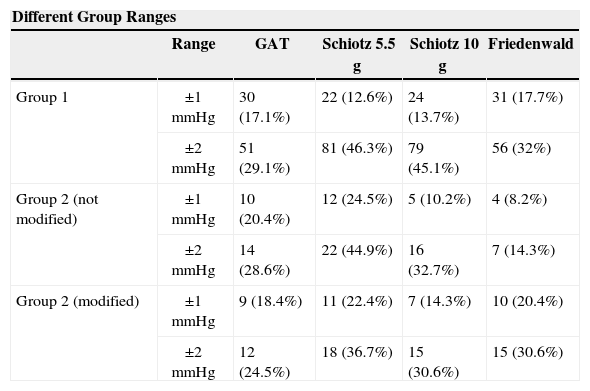
Table 5 shows the number of patients for whom the postoperative IOP fell in the ±1-mmHg interval and in the ±2-mmHg interval, relative to the preoperative GAT values, for the different methods under study.
Number of patients for whom the postoperative IOP fell in the ± 1mmHg interval and in the ± 2mmHg interval relative to the preoperative GAT values, for the different groups and for the different techniques under study
| Different Group Ranges | |||||
| Range | GAT | Schiotz 5.5 g | Schiotz 10 g | Friedenwald | |
| Group 1 | ±1mmHg | 30 (17.1%) | 22 (12.6%) | 24 (13.7%) | 31 (17.7%) |
| ±2mmHg | 51 (29.1%) | 81 (46.3%) | 79 (45.1%) | 56 (32%) | |
| Group 2 (not modified) | ±1mmHg | 10 (20.4%) | 12 (24.5%) | 5 (10.2%) | 4 (8.2%) |
| ±2mmHg | 14 (28.6%) | 22 (44.9%) | 16 (32.7%) | 7 (14.3%) | |
| Group 2 (modified) | ±1mmHg | 9 (18.4%) | 11 (22.4%) | 7 (14.3%) | 10 (20.4%) |
| ±2mmHg | 12 (24.5%) | 18 (36.7%) | 15 (30.6%) | 15 (30.6%) | |
Moreover, ST with both 5.5 and 10g load showed an underestimation (more pronounced for the 10g measurements than for the 5.5g load) that increased with the amount of treatment. On the contrary, when we applied the Friedenwald nomogram such relationship disappeared (Figures 9-11).
 and effective treatment. (r2=0.1046).")
 and effective treatment. (r2=0.1899).")
 and effective treatment. (r2=0.0022).")
Several authors studying the IOP after refractive surgery found the measurements obtained with both GAT and NCT10-16 unreliable, and proposed different ways to overcome this problem, such as correcting factors,10,11,13 or different techniques, such as pneumotonometry, dynamic contour tonometry or peripheral measurements.1-3,5,17
The possible causes of the decrease of the measured postoperative IOP with GAT and NCT are debated. Mardelli et al.18 proposed that the removal of Bowman's membrane and the deposition of newly synthesized collagen material alter the resistance of the cornea to applanation. In the same way, Patel and Aslanides19 suggested that the general softening of the corneal tissue after the natural healing process following PRK might be the cause of the lower postoperative IOP readings.
On the contrary, Rosa et al.10 and Montés-Micó and Charman12 supported the hypothesis that the decrease in thickness and the decrease in curvature might be the reason behind this underestimation.
One of the main problems in this kind of study is to establish which one is the real IOP.
The best approach should be to compare the IOP readings with the direct measurement of the IOP, but this is very difficult to perform in human eyes. Today, even if it has been shown that the accuracy of GAT depends on many factors including corneal thickness and structure, it is considered the standard for measuring IOP in ophthalmology in normal eyes1 and it is used world-wide to validate other measuring methods.20-23
For this reason, we decided to retrospectively compare the ST measurements with the GAT values obtained preoperatively, assuming that there are no changes in the IOP due to the surgical procedure. One criticism that could be raised against this study is that we did not check the IOP before surgery with ST, which is true. However:
- 1.
This is a retrospective study and ST is not used any-more to check the IOP in normal eyes as it is a gross method subject to many sources of error.
- 2.
The purpose of the study was not to establish whether ST values correlate with the ST measurements obtained before surgery, but to establish whether ST is able to give IOP measurements after PRK that reflect the real IOP, which was postulated to be the GAT measured preoperatively.
- 3.
The validity of our choice was confirmed by the fact that for the 49 fellow unoperated eyes, no significant changes were detected relative to the initial IOP values.
The results of the present study confirm that after PRK, GAT significantly underestimates IOP. Regarding ST, we found the IOP measured with this method to be higher than that measured with GAT. The reason for this is not clear to us, but the different diameter and shape of the plunger might explain this difference, more than the different mechanism (indentation vs. applanation).
This could also explain why when utilizing Friedenwald nomogram we found even higher values. In fact, one possible explanation could be that we measure the corneal rigidity in the area where the maximal ablation is performed, where the cornea is thinner compared to the remaining structure. These findings are confirmed by the Bland-Altman plot (Figure 8), which shows a systematic error caused by a much higher range of values obtained with this device and that it is clear the trend to change bias for values of average IOP below and above 13 to 15mmHg.
In conclusion, even if a prospective study should be performed to further validate our findings, our results showed such a wide spread of data that less than 50% of the eyes fell in the ±2-mmHg interval relative to the presumed real IOP. For this reason, ST cannot be used alone, but perhaps it could be used in combination with other methods in an attempt to calculate the right value. Further studies are required to establish if such a method could be reliably used in patients that have undergone other refractive surgery procedures, such as LASIK, or may only be limited to particular LASIK cases complicated with interstitial keratitis and accumulation of intrastromal fluid.6,7


