

A periodical self-monitoring of spherical refraction using smartphones may potentially allow a quicker intervention by eye care professionals to reduce myopia progression. Unfortunately, at low levels of myopia, the far point (FP) can be located far away from the eye which can make interactions with the device difficult. To partially remedy this issue, a novel method is proposed and tested wherein the longitudinal chromatic aberration (LCA) of blue light is leveraged to optically bring the FP closer to the eye.
MethodsFirstly, LCA was obtained by measuring spherical refraction subjectively using blue pixels in stimuli shown on organic light-emitting diode (OLED) screens and also grey stimuli with matching luminance. Secondly, the visual acuity (VA) measured with a smartphone located at 1.0 m and 1.5 m and displaying blue optotypes was compared with that obtained clinically standard measurements. Finally, the spherical over refraction obtained in blue light with a smartphone was compared with clinical over-refraction with black and white (B&W) optotypes placed at 6 m.
ResultsMean LCA of blue OLED smartphone screens was −0.67 ± 0.11 D. No significant differences (p > 0.05) were found between the VA measured with blue optotypes on a smartphone screen and an eye chart. Mean difference between spherical over-refraction measured subjectively by experienced subjects with smartphones and the one obtained clinically was 0.08 ± 0.34 D.
ConclusionsSmartphones using blue light can be used as a tool to detect changes in visual acuity and spherical refraction and facilitate monitoring of myopia progression.
The rate of increase in prevalence of high myopia has accelerated in recent times with reported levels reaching 20 % in young East Asian populations.1,2 High myopia is the most significant risk factor for development of sight threatening retinal pathologies in later life.3–8 Early onset of childhood myopia is associated with higher levels of myopia in adults.7,9 Early detection, and treatment of myopia progression is becoming an important issue and indeed the World Health Organization (WHO) has recommended increasing the availability of eye care services.10 It is often difficult to monitor ocular health in patients who cannot attend appointments physically, for example during the COVID-19 restrictions or due to limitations imposed by rural living and inaccessibility of eye care facilities. In response to these access issues as well as continued technological advances, there has been an unprecedented increase in the utilization of tele eye care in optometry and ophthalmology.11,12
With the availability of high resolution digital displays with high pixel density exceeding that of good printers, it is now possible to employ mobile devices as a tool for monitoring several aspects of visual performance such as: visual acuity (VA), contrast, color and potentially even refraction.13–16 Screen densities often exceed 400 pixels per inch (PPI or DPI), and recent technologies achieve display luminance values reaching 1000 nits with the capability of generating 90 % of the colors discernable by the human eye.17 Many eye care professionals use electronic displays instead of standard printed charts to display stimuli when measuring subjective refraction and VA. These displays are usually situated at 6.0 m (20 feet), which corresponds to the target vergence (TV) of −0.17 D, usually subtending ∼5.0° from the point of view of the eye. In some cases, i.e., in amblyopia measurements this distance is shortened to 3.0 m (10 feet or TV = −0.33 D).
Replicating these standard clinical test distances with smartphones18,19 faces certain challenges: a) the inability to display multiple large optotypes at far distances (e.g. a smartphone with a 6″ diagonal screen at 6.0 m would subtend only ∼1.5°), and b) the difficulty to interact with devices at far distances. These limitations could be avoided by placing the smartphone relatively nearer to the eye (i.e., at 1.5 m, it would subtend ∼6.0°). However, in this case the device would no longer be close to the FP of an emmetropic eye, unless blue stimuli are used. The human eye experiences significant levels of longitudinal chromatic aberration (LCA)20 between blue and white light. This natural refractive change, which is very similar in all human subjects20 can be leveraged by smartphones which may display blue stimuli employing either light emitting diode (LED) or organic light-emitting diode (OLED) technology which emit relatively broadband light.21 Thus, blue pixels in modern digital displays can be used to generate a more proximal far point (FP) potentially allowing the use of mobile devices at relatively short distances for monitoring VA and myopia progression.
However, the use of blue light for testing visual performances can be limited. Firstly, effective luminance of short wavelength stimuli is generally low, which could potentially limit the subjects’ VA in such light.22 Secondly, the lack of S-cones in the central fovea could reduce the VA values and blur detection which might also affect any refraction measures with respect to the clinical standard.
The purpose of the present study was to determine whether blue light emitted by smartphone screens can be used to obtain measures of VA and spherical component of refraction (SPH) on par with standard clinical methods. To this end, three experiments were conducted. In the first one, the LCA between blue and white light emitted by pixels in smartphone screens was measured empirically. In the second one the effect of blue pixel luminance on visual acuity measures was investigated. Finally, in the third experiment clinical SPH obtained in white light was compared with SPH measurements using a mobile phone and blue stimuli.
MethodsThree different experiments were carried out. In the first one (E1) the LCA of the eye for the blue stimuli displayed on OLED smartphone screens was determined empirically using an adaptive optics (AO) system with a controllable Badal optometer. In the second experiment (E2), the VA in blue light was evaluated using with a mobile application (app) and compared with clinical measures. Finally, in the third one (E3), the feasibility to detect refractive errors using blue light and high contrast letters was investigated by comparing SPH obtained with an app and clinically.
An Early Treatment Diabetic Retinopathy Study chart (ETDRS) was chosen for clinical VA and refraction measurements because it is the “gold standard”.23 However, for VA measurements with smartphones, the Landolt C optotype was used because the new DIN 58,220 standard indicates that it is the appropriate stimulus to use with tablets and smartphones.24 Additionally, some studies show a good agreement between the Landolt C and ETDRS charts.25–28 Finally, a stimulus comprising three parallel lines was used to measure SPH because it had been identified as a simple and quick test for the subject in our past experiments.
Institutional Review Board Committee approvals were obtained for each experiment. The study was conducted in compliance with the United States and European Health Insurance Portability and Accountability Act (HIPAA) and adhered to the tenets of the Declaration of Helsinki.
- 1.
Experiment E1 – measuring LCA differences between blue and white pixels
The values of LCA between the relatively-broadband blue and white pixels in an OLED screen were measured in one eye in 10 subjects – 5 presbyopes (ages 51 ± 8) and 5 young adults (ages 24 ± 2). The latter group was cyclopleged with two drops of tropicamide 10 mg/ml with 5′ in-between instillations. All measurements were monocular and subjects wore their habitual sphero-cylindrical spectacle corrections when applicable.
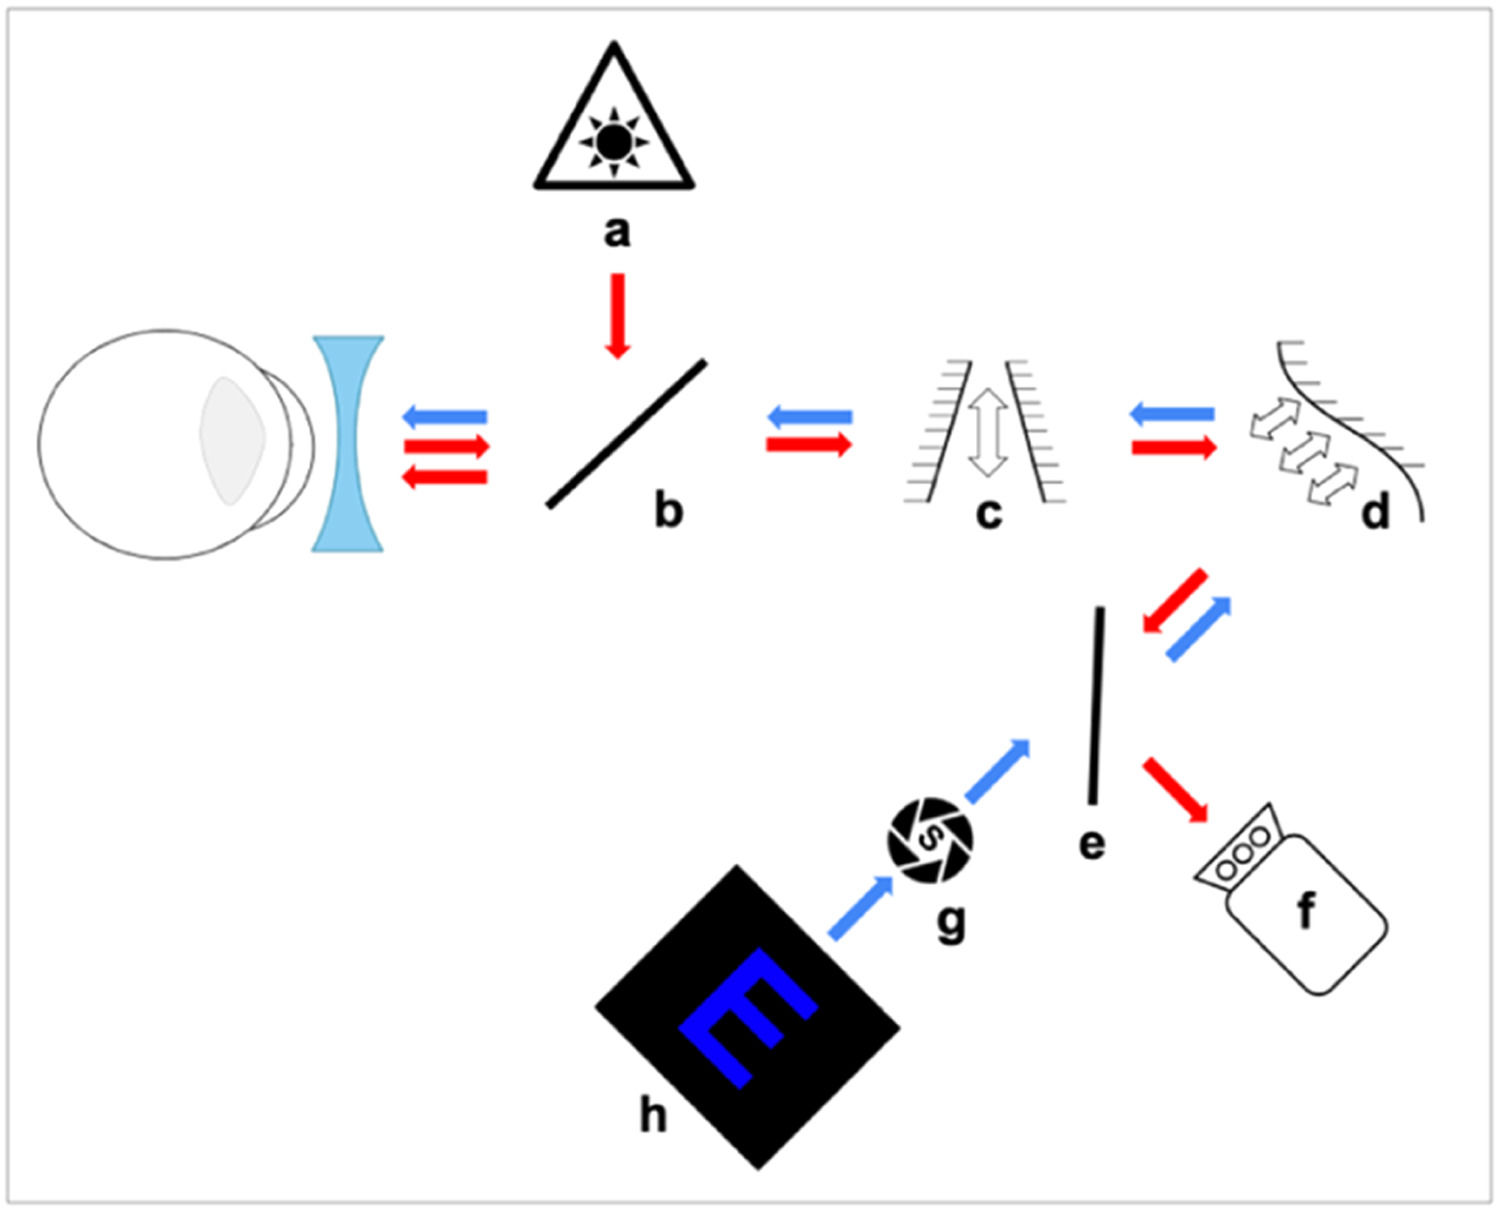
Fig. 1 shows the experimental AO system used for LCA measurements which is described in detail elsewhere.29
 and stimulus (blue) light. (a) IR laser diode, (b) and (e) Beam splitter, (c) Badal system, (d) Deformable mirror, (f) Wavefront sensor, (g) Artificial pupil and (h) Blue target.")
Experimental set-up using a Badal optometer for subjects to subjectively find their FP in blue or white light. Arrows show the path of the infrared (red) and stimulus (blue) light. (a) IR laser diode, (b) and (e) Beam splitter, (c) Badal system, (d) Deformable mirror, (f) Wavefront sensor, (g) Artificial pupil and (h) Blue target.
The deformable mirror (Fig. 1d) was used to correct small amounts of monochromatic aberrations present in the system itself, which showed a total RMS of less than 0.1 μm for a 4 mm pupil. A pupil camera29 was used to ensure that a subject's pupil was centered within the system and that the pupil diameter was greater than 4 mm during the experiment. The target (Fig. 1h) was a smartphone screen (Samsung Galaxy S20 FE) with an OLED screen displaying an optotype E with a total height of 1.22 mm and a spatial frequency of 7.2 c/d. The letter was displayed as a blue (R = G = 0 and B = 255) stimulus with a luminance of 50 nits on a black background, or as a white stimulus with luminance matching the blue optotype. Subjects viewed the target though a 4 mm artificial pupil (Fig. 1g) which was optically conjugated with the entrance pupil of the eye. Subjects used a motorized Badal optometer (Fig. 1c) (step < 0.01 D) to find their subjective FP (where the letters appeared the sharpest) whilst approaching it from the distal side (having been “fogged-in” to avoid accommodation). If more than one position of the Badal system yielded the same sharpness, subjects chose the more distal one. After 3 practice trials, 5 repeated positions of the Badal system were measured for each color (blue and white). Between each measurement the target was defocused randomly in the myopic or hyperopic direction to make it appear blurred for the subject.
- 2.
Experiment E2 – estimating the visual acuity with blue light from OLED displays
Foveal VA was reported to be unconstrained for retinal illuminances of ≥ 100 td,30 but was reduced for lower retinal illuminances. The spectral composition of light emitted by blue pixels spanned approximately 400–500 nm, with a luminance-weighted mean of approximately 460 nm. To achieve 100 td of retinal illuminance, the stimulus luminance was required to be at a level of at least 20.4 nits (assuming a minimum pupil size of 2.5 mm). This value can be achieved by blue pixels in most smartphones. The luminance of blue pixels in different devices (Samsung Galaxy S20 FE, Samsung Galaxy A12, Samsung Galaxy A32, Xiaomi Redmi Note 11, Huawei P20 Lite, iPhone 13, iPhone 12 mini and iPhone X) had been measured using a Konica Minolta Luminance Meter LS-110, obtaining an average value of 27 ± 4 nits, with a minimum value of 20.5 nits.
Although the spectral band of the blue light emitted by smartphone screens (see Fig. 6 in the Discussion section) was narrower than the white band, it concentrated the light over the region within which the slope of the LCA was greater in the LCA = f (wavelength) model.20 An assessment of the impact of the relatively-broadband blue light was carried out in order to verify that VA in blue light was not affected by the lack of S-cones in fovea. This initial step was necessary to demonstrate that VA can be measured in blue light as long as the stimulus luminance is adequate.
- a.
Comparing best corrected visual acuity (BCVA) measurements using the same luminance in white and blue light.
Standard clinical VA measurements were taken using a ETDRS chart at 6.0 m distance in both eyes (non-cyclopeged) in 4 subjects (ages 30 ± 6) wearing their sphero-cylindrical correction and compared with the values obtained using a luminance-matched (13 nits) translucent eye chart retro-illuminated by a powerful projector (emitting 4600 nits). In order to achieve the same level of retinal illumination31 the chart was situated behind a) an interference filter with peak transmission of 467 nm (Balzers B-40 467 g, Materion Balzers Optics), and b) two neutral density filters (ND) with total density of 2.50. Subject performed measurements from two distances; 1.15 m and 0.95 m. Taking into account the LCA value for blue obtained theoretically these distances corresponded to approximately 6.0 m and 3.0 m in white light, respectively (see Eq. (1) in Discussion). A single VA measurement was taken for each of the filters (interference for blue- and ND for white light) and distances and compared with standard clinical VA values.
- b.
Measuring uncorrected visual acuity (UCVA) with an app using blue light
In another experiment, UCVA was measured clinically and with the app vision.app (Visionapp Solutions S.L., Spain) in both eyes in 40 subjects (80 eyes) of different ages (35 ± 16 years) without cycloplegia. Subjects with any ocular pathology or spherical equivalent refraction (SER = SPH + ½ CYL) < - 4.5 D were excluded. In addition, subjects with SER < - 2.5 performed the measurements with half of their SER corrected (i.e. an eye with the prescription −3.25 −0.5 @ 30° wore the correction of −1.75 D). This ensured that high levels of defocus in these eyes did not require optotypes larger than the size of the screen to be displayed.
Clinical UCVA measurements employing a black-and-white (B&W) ETDRS chart viewed from 6.0 m were compared with results obtained with the app running on one of five different mobile devices: a tablet (Samsung Galaxy Tab S2) and four smartphones (Google Pixel 3, Xiaomi Redmi 9C, Huawei Mate 20 Pro-and Huawei P20 Lite). The app was used to measure UCVA monocularly, four times per eye, using a blue Landolt C optotype with crowding on black background following a four-choice selection algorithm based on the Freiburg Visual Acuity test (FRACT).32 The app additionally included a “I can't see it” option that subjects could use in case they could not distinguish the orientation of the optotype. Blue optotypes were viewed by subjects looking at mobile devices at two distances; first 1.0 m and then 1.5 m. The retinal TVs of these optotypes corresponded to the white light TVs corresponding to 3.0 m and at infinity, respectively. Face-device distance was continuously monitored using images of a subject's head captured by the front facing camera of the device. Angular size of the stimuli was maintained constant as letter sizes were automatically rescaled if a change in viewing distance was detected. The app maintained the screen brightness at the maximum value ensuring blue luminance greater than 30 nits and Michelson contrast higher than 87.5 %.
Clinical and app measures of UCVA were compared using a Bland-Altman statistical analysis based on a two-tailed, paired t-test. These statistical methods were selected because normality and homoscedasticity of the sample could be assumed after performing the Shapiro Wilk and F-tests following the Levene's criterion. All recorded decimal measures were converted to logMAR format to conduct the statistical analysis.
- 3.
Experiment E3 – estimating subjective spherical refraction
Subjective clinical refraction was obtained in 72 subjects (144 eyes) of different ages (21 ± 3 years) using an ETDRS chart at 6.0 m distance. Subjects were tested wearing their best correction (trial lenses), spherical over-refraction (SPH) measurements (expected to be = 0) were compared to the same obtained using the app vision.app which displayed blue stimuli on the OLED screen. The app measured face-device distance using the device's front camera33 in the same manner as in E2. Subjects performed the measurements with their own mobile devices. The stimulus comprised three parallel vertical blue lines on a black background, with a black gap between the blue lines being twice wider than the thickness of the lines. These parameters were adjusted in real time with face-device distance, so that the lines always subtended the same angle from the subjects’ point of view, corresponding to 80 % of their decimal BCVA, which had to be entered in the app before starting the test. The phone was initially moved further away from the user until they reported that the three-line stimulus could no longer be resolved by their eye. Then the phone was moved slowly towards the user until the three blue lines could be clearly seen. The face-device distance was then recorded by the app after pressing a button. Three repetitions of the process were performed for each eye. The distance at which the subject failed to resolve the 3 lines was converted to vergence and a diopter value of LCA (−0.67 D) that had previously been obtained in E1 was subtracted to obtain the SPH value obtained with the app and compare it with the clinical SPH = 0 (see Eq. (1) in Discussion).
The similarity of measurement methods (clinical versus app) was assessed via a Bland-Altman statistical analysis based on a Wilcoxon Man Whitney test because the assumptions of normality (p < 0.05) and homoscedasticity (p < 0.05) were not fulfilled. These statistical methods were selected since normality and homoscedasticity of the sample after performing the Shapiro Wilk and F test following the Levene's criterion could not be assumed. The mean difference between the SPH measured with the app and the traditional measurement, Wilcoxon statistic test and associated standard deviation were determined.
Results- 1.
Experiment E1 – evaluating the amount of LCA between blue and white pixels
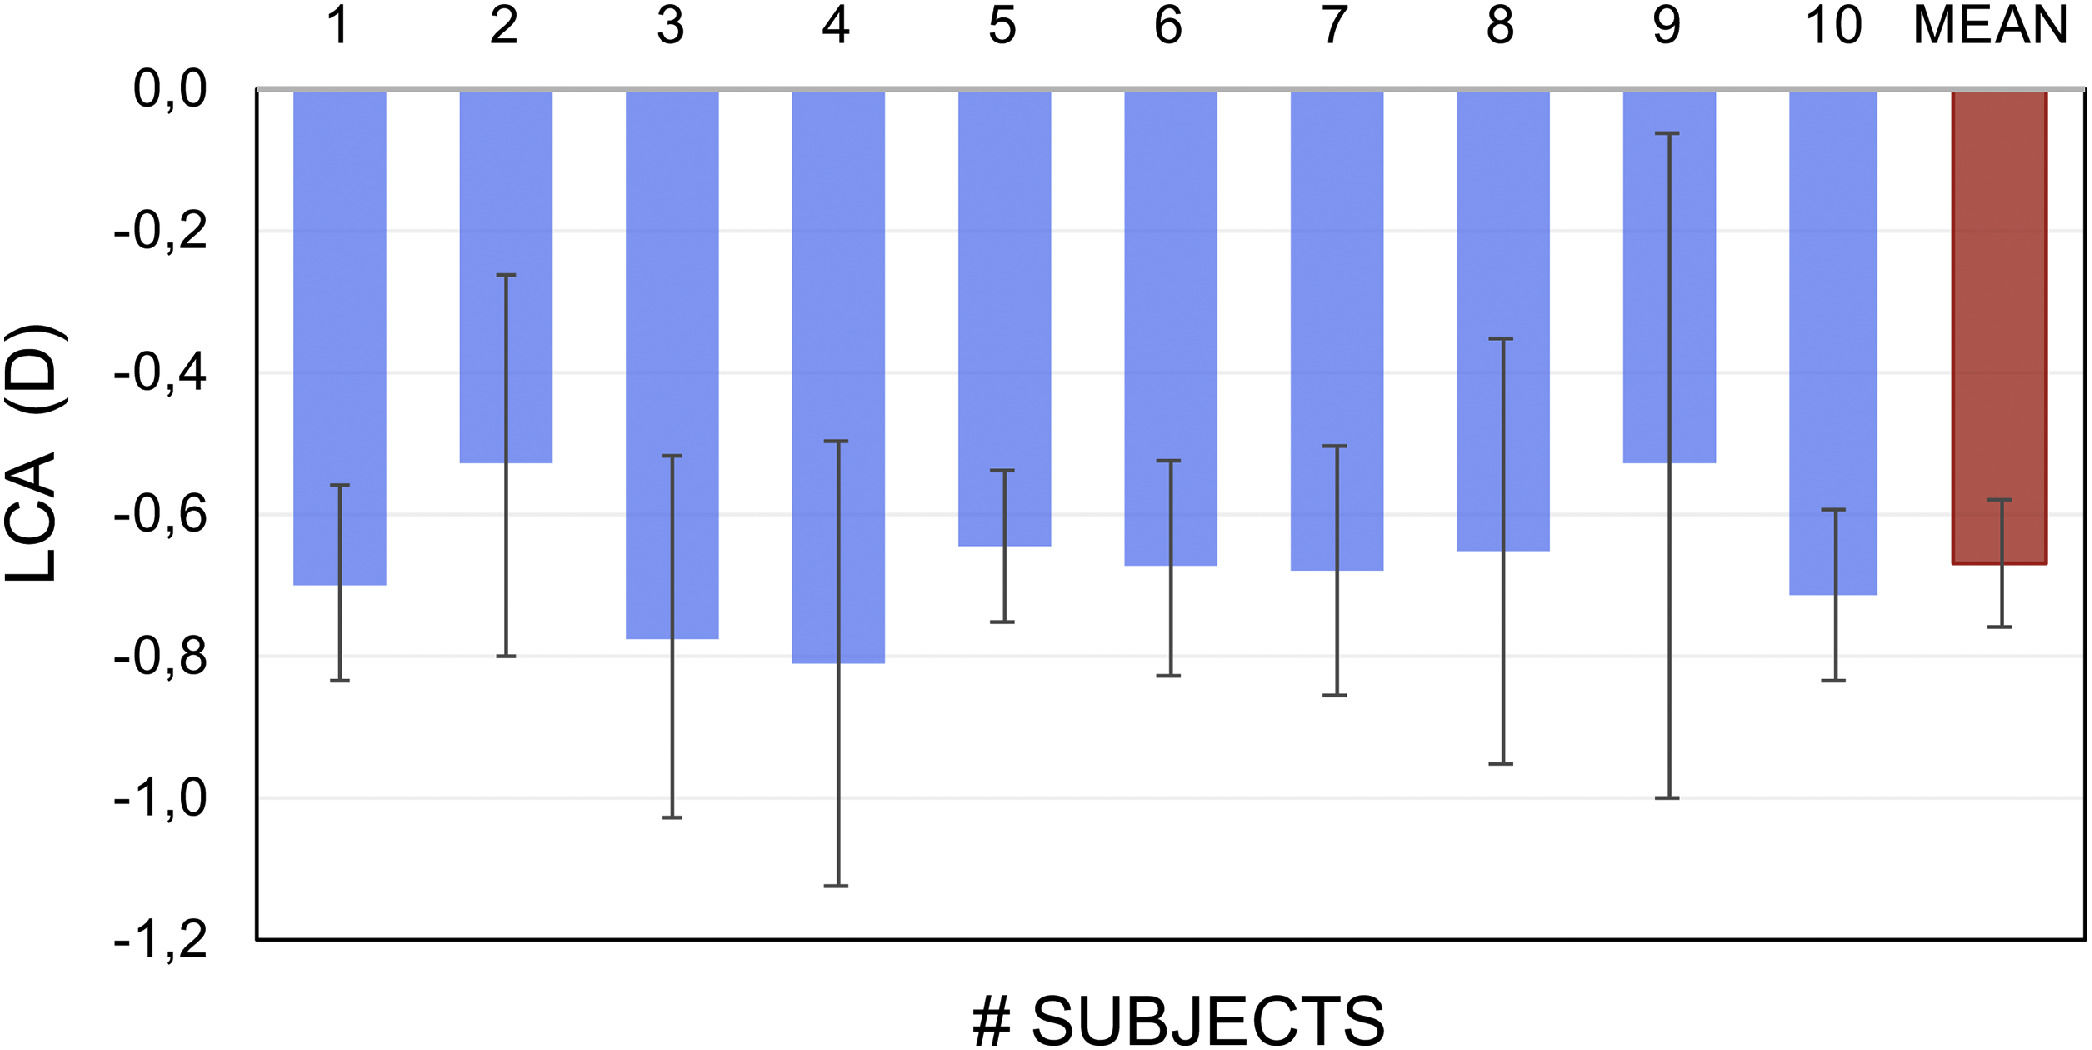
Fig. 2 shows the empirically-obtained difference in LCA between the blue and white pixels in OLED screen in 10 subjects. Blue light FP was found to be on average −0.67 ± 0.21 D more myopic than the same for white light.
- 2.
Experiment E2 – estimating the visual acuity with blue light from OLED displays
- a.
Comparing best corrected visual acuity (BCVA) measurements using the same luminance in white and blue light.
- a.
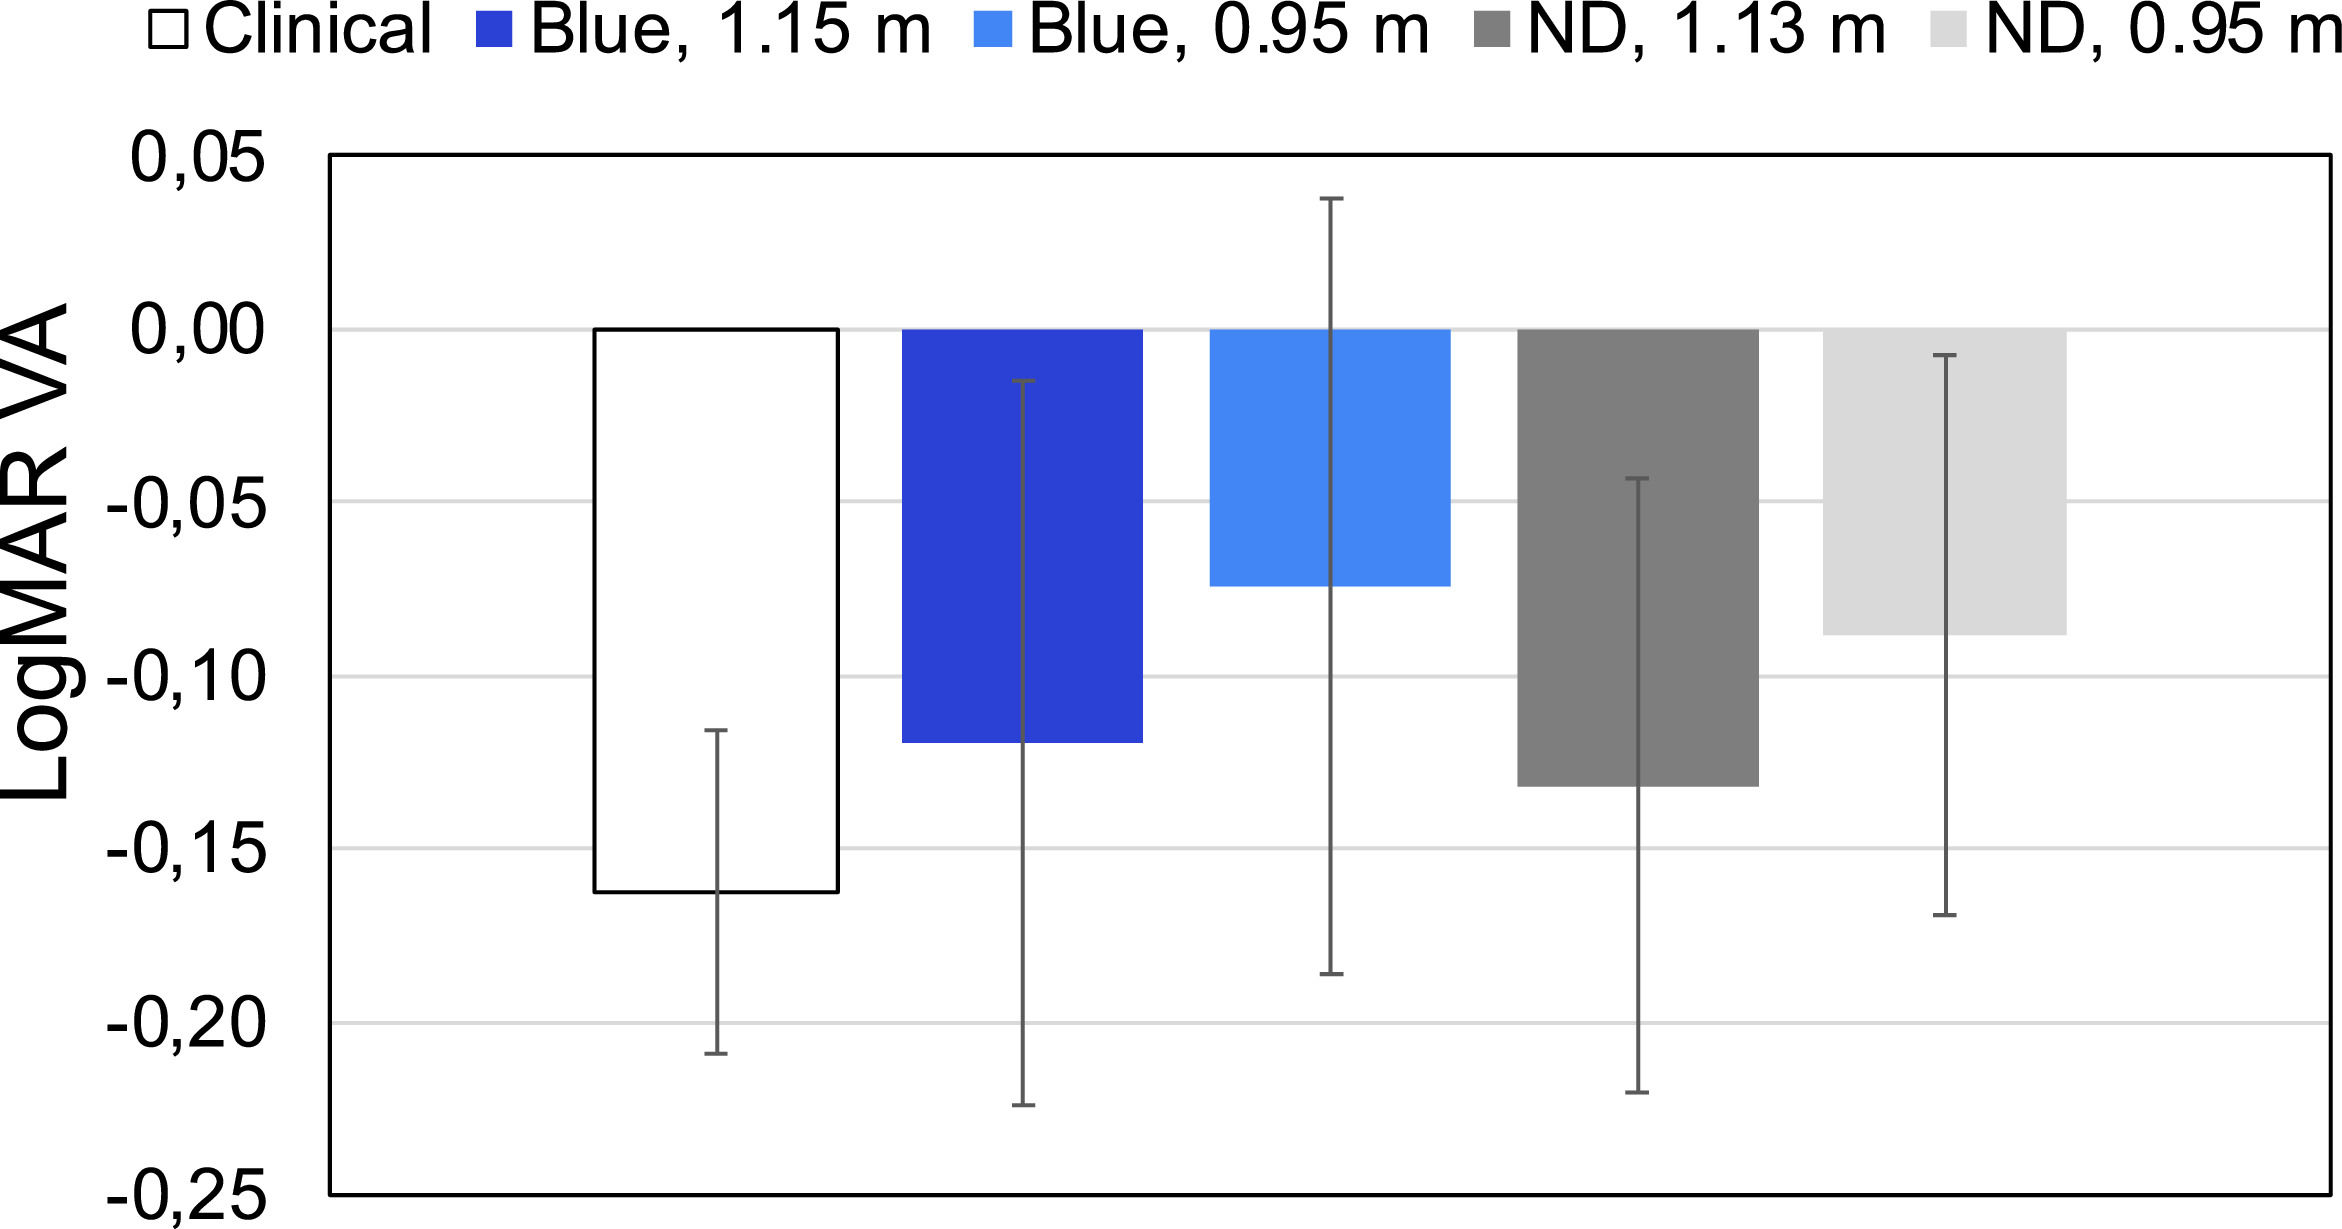
 and group mean (red bar). The error bars represent +/- 1 SD.")
The BCVA values obtained in 4 subjects with different filters and clinical standard values are presented in Fig. 3. b Measuring uncorrected visual acuity (UCVA) with an app using blue light
 in 4 subjects. The error bars represent the intrasubject ± 1SD in each condition.")
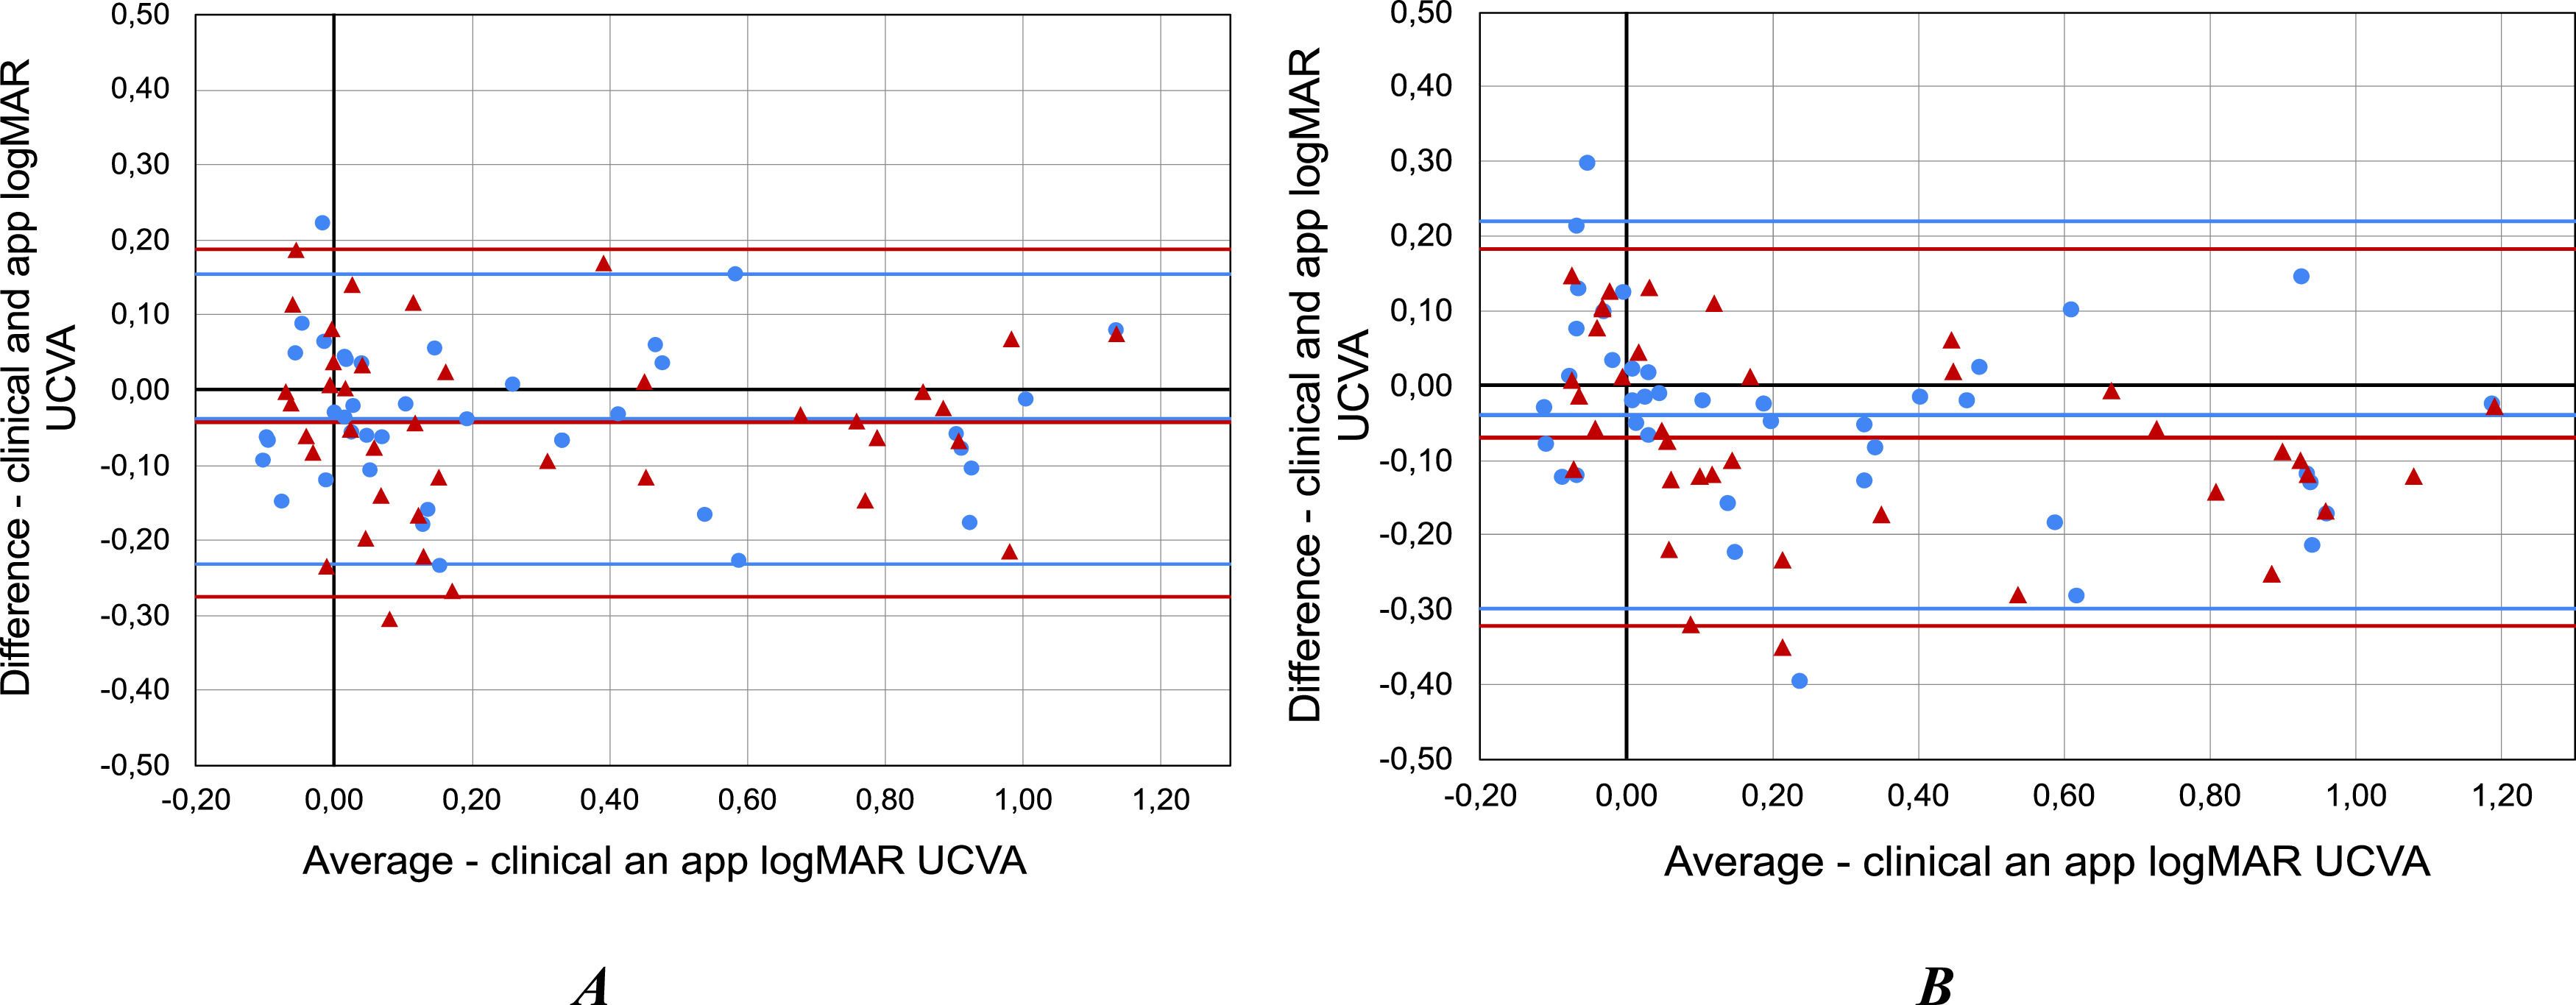
The standard clinical logMAR UCVA values obtained with the ETDRS chart in 40 subjects were 0.24 ± 0.36 (OD) and 0.28 ± 0.38 (OS). The logMAR UCVA values obtained with the app were 0.28 ± 0.37 (OD) and 0.33 ± 0.38 (OS) for the 1.0 m face-device distance, and 0.28 ± 0.40 (OD) and 0.35 ± 0.43 (OS) for the 1.5 m. The mean difference between clinical and experimental values of UCVA in both eyes were −0.04 ± 0.10 (OD) and −0.04 ± 0.12 (OS) for the 1.0 m face-device distance, and −0.04 ± 0.13 (OD) and −0.07 ± 0.13 (OS) for 1.5 m (Fig. 4).
 and 1.5 m (B)The ● symbols correspond to OD, and ▲ to OS.")
The assumptions of normality and homoscedasticity were fulfilled in the Shapiro Wilk test obtaining a result p = 0.722 (OD) and p = 0.900 (OS). The F test following the Levene's criterion to compare the two variances yielded p = 0.886 (OD) and p = 0.972 (OS) for measurements at 1.0 m. Furthermore, the assumptions of normality (p = 0.772 (OD) and p = 0.460 (OS)) and homoscedasticity (p = 0.505 (OD) and p = 0.487 (OS)) are also fulfilled for measurements at 1.5 m. In addition, the t-test revealed significant differences between the clinical values and the same obtained with devices displaying blue optotypes for measurements at 1.0 m (p-value = 0.019 (OD) and 0.025 (OS). However, there were no statistically significant differences for OD (p = 0.075) while there are significant differences for OS (p = 0.002) for measurements at 1.5 m.
A statistical analysis of the power of the hypothesis test (1-β) was carried out using open software (G Power 3).34 For a significance level of p = 0.05 and considering a clinically significant difference of 0.1 logMAR the calculated powers were 1.00 (OD) and 0.99 (OS) for UCVA measurements at 1 m and 0.997 (OD) and 0.998 (OS) at 1.5 m.
- 3.
Experiment E3 – estimating subjective spherical refraction
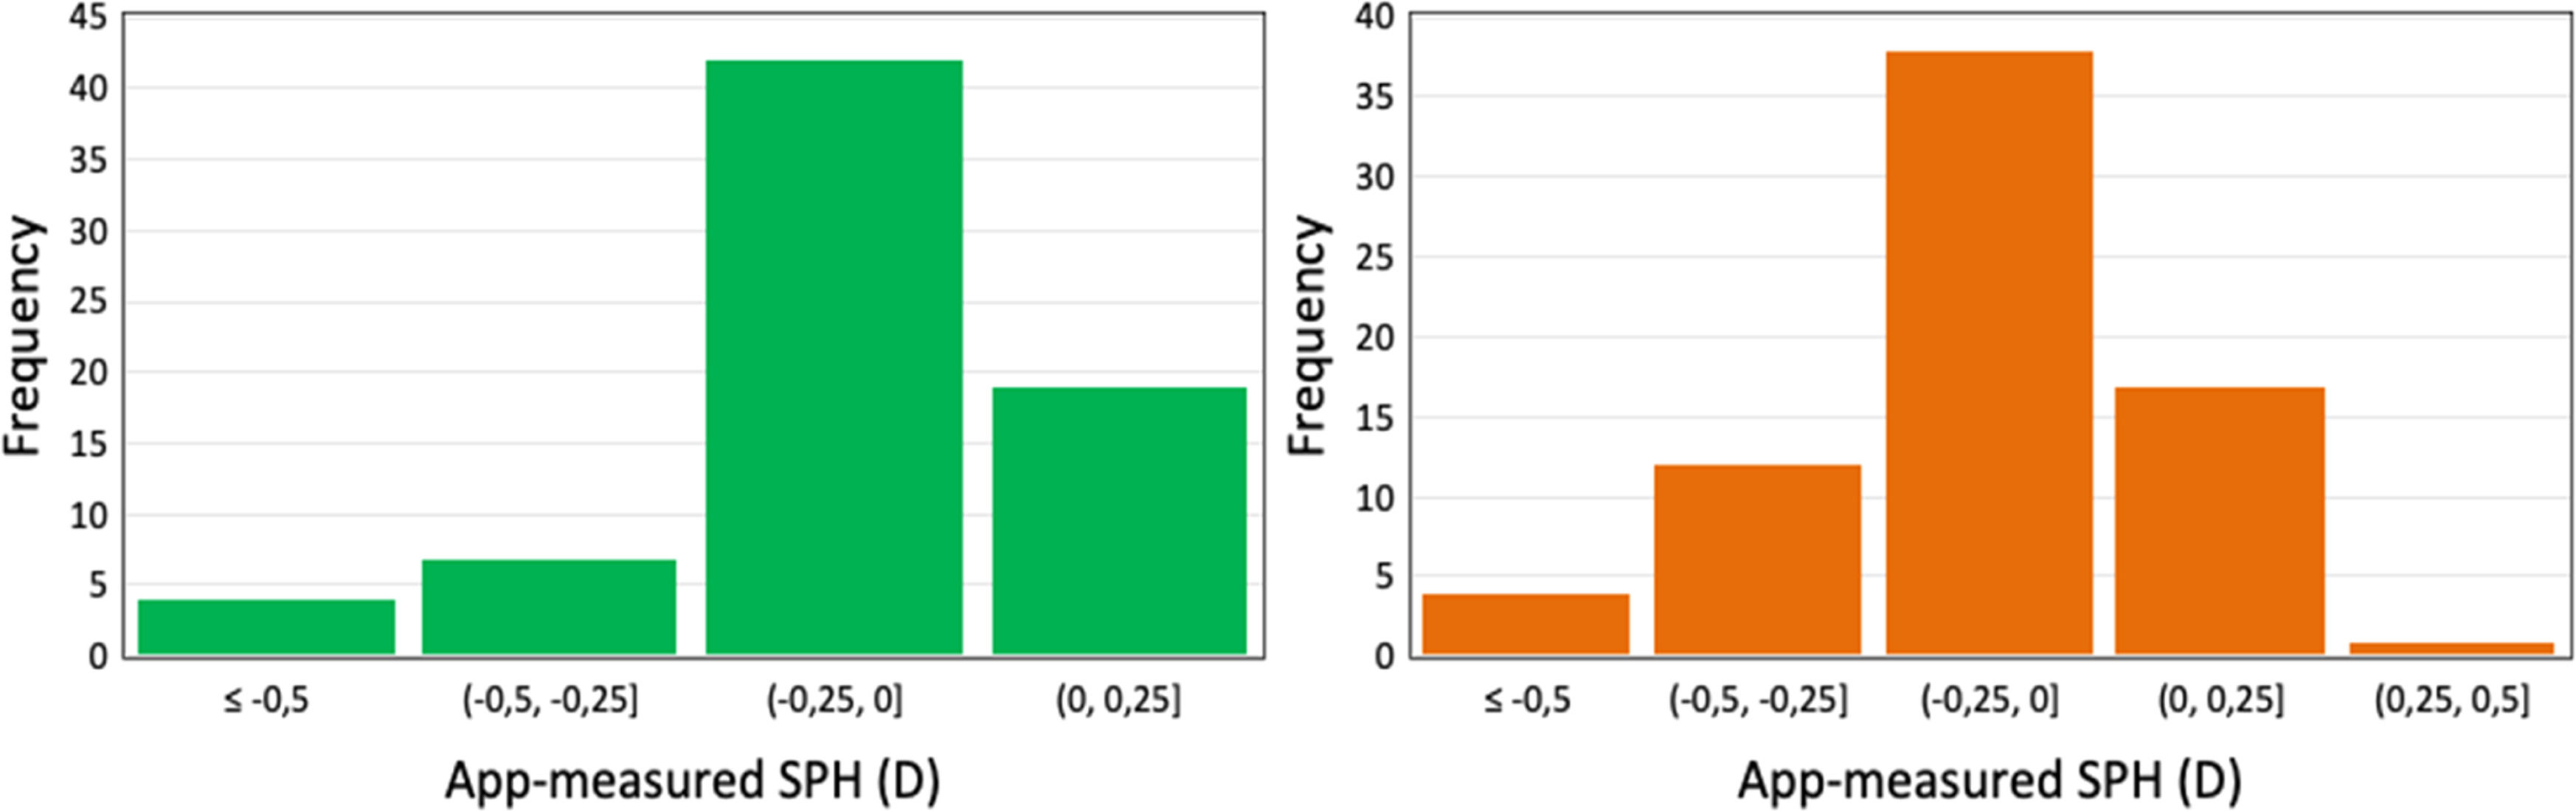
Mean clinical SPH found in 72 subjects were −0.5 ± 0.7 D for OD and −0.4 ± 0.6 D for OS, while the corresponding ametropia ranges were −3.00 D – 0.00 D for OD and −2.50 D –0.00 D for OS. Mean app-measured SPH was −0.3 ± 0.6 D and −0.2 ± 0.4 D for OD and OS, respectively, while the corresponding ametropia ranges were −2.50 D – 0.00 D (0.35 m –1.50 m) for OD and −1.83 D – 0.00 D (0.40 m – 1.50 m) for OS.
The values obtained with the app were found to be slightly less myopic than clinical, with the mean intra-subject difference between standard and the SPH measurements being −0.08 ± 0.39 (OD) and −0.08 ± 0.30 D (OS) with upper and lower limits of agreement (LOA) of 0.68, −0.82 D and 0.50, −0.65 D for OD and OS, respectively. In addition, histograms show a higher frequency of measurement error between methods between 0 and −0.25 D for both eyes (Fig. 5).

The differences between the mean SPH measurements carried out with the app and standard clinical methods were found not to be statistically significant (p = 0.856 for OD and p = 0.395 for OS).
DiscussionA novel method to address the previously mentioned challenges: a) the inability to display multiple large optotypes at far distances, and b) the difficulty to interact with devices at far distances was proposed to leverage mobile devices for monitoring VA and SPH. The method is based on using a blue stimulus to isolate the eye's FP for blue light, which is situated nearer to the eye than the corresponding FP for white light. This allows for subjective assessment of different levels of ametropia with a hand-held device in relative proximity to the subject's face, facilitating its usage.
The blue OLED displays produced sufficient luminance (20–30 nits) to attain good visual acuity (up to −0.2 logMAR). The core underlying idea that blue light and ocular LCA may allow an individual to use their phone at a convenient distance to measure their VA or myopia progression was validated with spherical refraction (after adjustment for the - 0.7 D of LCA) being within 0.5 D of values obtained using standard subjective clinical refraction methods.
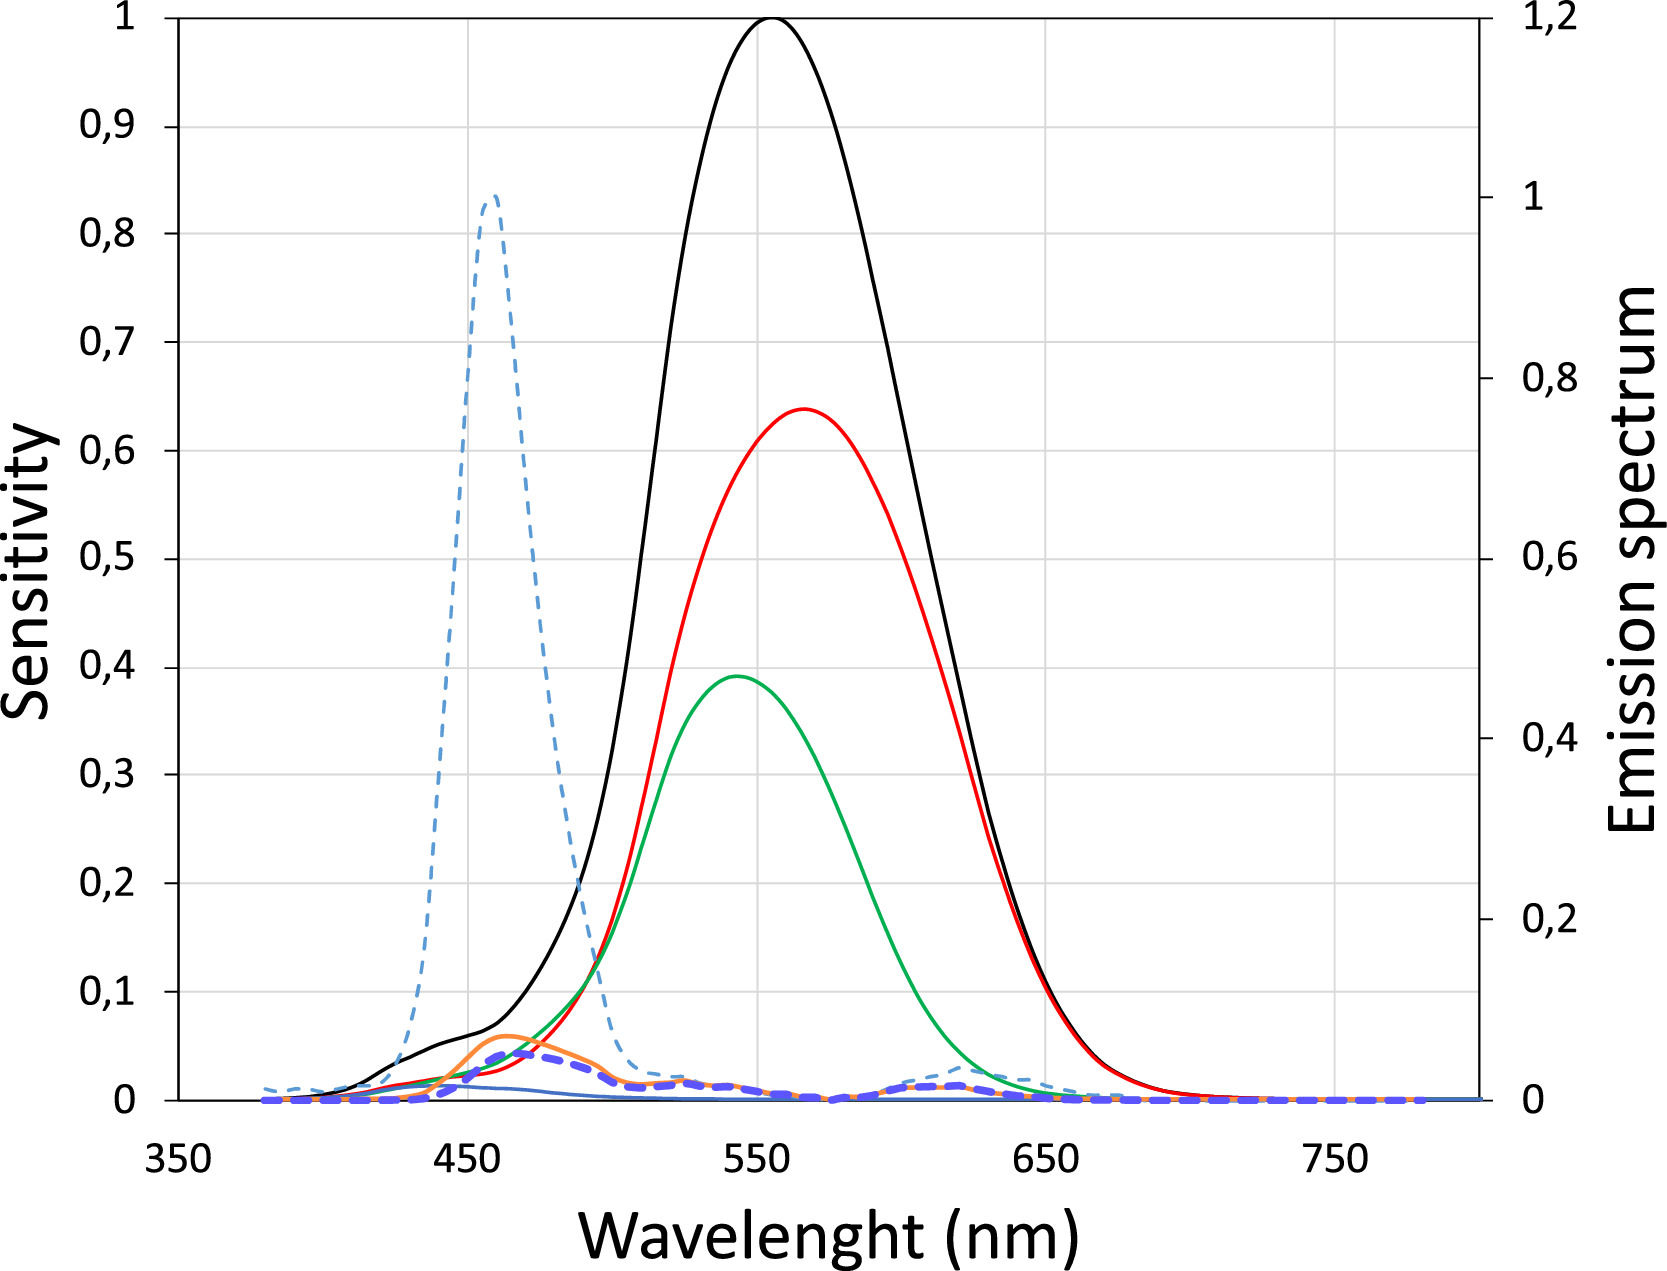
In study E1 the LCA value for relatively broadband light emitted by blue pixels in OLED screens was measured empirically in 10 subjects. The dioptric difference between white and blue light was approximately −0.7 D (Fig. 2). A theoretical value quantifying the difference between screen-emitted blue and white light was obtained using the method proposed by Bradley35 and the typical spectral emission of OLED screens.36 In this method the spectral emission of the OLED screen for blue LEDs (Fig. 6) is multiplied by the spectral sensitivity curve of the eye to obtain a new function, in which the maximum corresponds to the wavelength that represents the blue light spectrum. Fig. 6 shows the new curve in which the maximum corresponds to 460 nm.
, M-Cone (green line) and l-Cone (red line) sensitivity for each wavelength (Left Y-axis) and its sum (black line).37 Normalized emission spectrum for blue OLED screens (dotted light blue) (Right Y-axis). Dotted dark line represents the multiplication of the dotted light blue line and the black line (V-lambda), which has a maximum at 460 nm.")
S-Cone (blue line), M-Cone (green line) and l-Cone (red line) sensitivity for each wavelength (Left Y-axis) and its sum (black line).37 Normalized emission spectrum for blue OLED screens (dotted light blue) (Right Y-axis). Dotted dark line represents the multiplication of the dotted light blue line and the black line (V-lambda), which has a maximum at 460 nm.
Now we can use the formula of the chromatic difference of focus of the human eye obtained previously20:
to theoretically calculate the LCA between 555 nm and 460 nm,35 obtaining a value of −0.72, which is very similar to the result obtained empirically. It can be assumed that the chromatic difference between the standard clinical ETDRS chart and a blue stimulus displayed on an OLED screen is approximately −0.7 D. Leveraging the LCA a blue stimulus situated at 1.43 m (= 1 / 0.7 D) would be at the FP of an emmetropic eye. In order to mimic an eye chart situated at 6.0 m (20 feet), an equivalent blue stimulus should be placed at 1.15 m (= 1 / (⅙ + 0.7)). Moreover, a typical B&W eye chart used in amblyopia measurements at 3.0 m, would be equivalent to a blue stimulus placed at 0.97 m (= 1 / (⅓) + 0.7)), which is a convenient distance to monitor progress of treatment in an amblyopic eye of children at home.
The results in the first part of study E2 show that VA in blue can attain high values even with a narrow band filter, this speaks against the theory that relatively high VA values when using a blue target in the smartphone are achieved mainly as a result of the broad spectral bandwidth of the blue light of the OLED screens. The results of the present study agree with the results obtained by Domenech et al.,38 which show that after LCA compensation, the asymptotic values for the three colors (green, red and blue) can be considered identical, so no significant statistical differences are found when measuring the VA using typical optotype projector lighting.
In addition, good agreement was found in the second part of the E2 between the UCVA measured with a smartphone placed at a distance of 1.0 and 1.5 m using a blue optotypes compared with clinical standard measurements obtained with an ETDRS chart at 6.0 m. This is probably due to the fact that the luminance of modern smartphones is high enough to produce sufficient retinal illumination. The t-test revealed no significant differences in measured VA (p = 0.243 and p = 0.1) at 1 m and 1.5 m respectively, with a mean difference between clinical and app measurements of less than one line (−0.041 and −0.054 logMAR) for 1.0 m and 1.5 m measurements, respectively. The Bland-Altman analysis showed that the mean difference between measurement methods was −0.04 ± 0.1 and −0.05 ± 0.1 logMAR for 1.0 m and 1.5 m measurements respectively. The standard deviation obtained for both conditions correspond to one optotype line. K. Bellsmith et al.13 performed VA measurements with a mobile app different from the one used in this study; they obtained results similar to those obtained in the present study. They also found an appreciable mean difference between both methods (−0.12) with LOA = 0.26 and −0.5.
Due to the high dependency of VA on the luminance of the stimulus38 it is not surprising that VA in blue light usually provides slightly lower values than in white light (see Fig. 3). J. Pokorny et al.30 showed that VA increases as luminance is increased, until an maximum visual acuity is reached at about 30 to 100 trolands, beyond which further increases of luminance do not improve VA. This may be one reason why some VA values obtained with blue stimuli on OLED screens were lower than the same obtained in clinical measurements. However, Y. Tanaka et al.39 studied the change of human VA for 15 colors in six young subjects and demonstrated that there was no significant difference in VA for colors in the case of achromatic (grey) backgrounds at 100 nit. However, when the background luminance was 30 nit, there were significant differences not only in the blue but also with many other colors such as green, for which the eye is very sensitive.
Another potential explanation for the reduction of the VA in blue light is that the cone sampling in the central fovea is absent due to the lack of S-cones. However, although short wavelength stimuli generates the perception of the color blue by photon absorption in the low sampling density S-cone pathway, the M- and L-cones are sensitive to 460 nm light (see Fig. 6) allowing resolving relatively high spatial frequencies.40 One might wonder why small blue letters do not look yellowish when viewed using central vision. According to Williams et al.41 the continued perception of blue is due to light scattering, even though the stimulus was small and reflected roughly from the fovea: the short wavelength light was scattered to the surrounding S-cones and it was probably eye movements which eventually stimulated the S-cones.
In the final study E3 subjective SPH was self-estimated using blue light, and a relatively good agreement was found between the clinical and smartphone measurements. The Bland–Altman analysis showed that the mean difference between measurement methods was −0.13 ±0.33 D and −0.12 ± 0.31 D for OD and OS, respectively, with limits of agreement of 0.5 and −0.7 and the histograms (Fig. 5) show that 60 % of the measurement errors between both methods are between 0 D and −0.25D. Furthermore, the Wilcoxon test revealed no significant differences in measured SPH (p-value > 0.05). Further longitudinal studies on the change of refraction caused by myopia progression are needed to verify the real potential of the app as a tool for early detection of myopia progression.
The UCVA and remote point measurements with the app present some limitations. Regarding the UCVA measurements, letters with a very low spatial frequency may not fit on the device screen, there is a maximum VA limit of 1.5 decimal due at the resolution of some screens. In addition, the contrast could be diminished due to dirt on the screen and depending on the device the blue luminance could be limited (<100 td) although most of the devices on the market do reach said luminance. Finally, some screens may use a different color space which would affect the chromatic. Regarding the measurements of the FP, the 3 parallel lines in a certain orientation limit the measurement of the refractive change in the perpendicular direction, so refractive changes of astigmatism would not be detected. On the other hand, due to the resolution limitation of the front cameras, the measurement of the face-device distance could be inaccurate from a distance of approximately 2.0 m.33 This distance in blue would correspond to a hyperopia of +0.17 D (95% CI: +0,67D to −0,50D), so it is not possible to measure hyperopia > +0.17 D.
As mentioned in the introduction section, the main advantages of the method studied using blue light are: it is not necessary to move the device too far away to carry out the visual tests, it allows the user to carry out the tests at any distance thanks to the rescaling of the stimulus with the face-device distance. In addition, people will be able to use their smartphone to carry out a screening of their visual health.
ConclusionsIn conclusion, the results of the four experiments show the possibility of using a smartphone with blue light to obtain values of VA and SPH that are similar to those obtained without the need to place the stimulus far away (6.0 m or 20 feet). The method can be used to screen for anomalies limiting patients’ VA so that they can be referred to an eye care professional, as well as for a remote follow-up of the evolution of treatments such as amblyopia or myopia progression.
Funding informationNone
We would like to thank Arthur Bradley for his suggestions and review of the manuscript.


