To develop a method to calculate the angle λ of the human eye using Zernike tilt measurements in specular reflection corneal topography.
MethodsThe meaning of Zernike tilt in specular reflection corneal topography is demonstrated by measurements on translated artificial surfaces using the VU Topographer. The relationship derived from the translation experiments is used to determine the angle λ. Corneal surfaces are measured for a set of eight different fixation points, for which tilt angles ρ are obtained from the Zernike tilt coefficients. The angles ρ are used with respect to the fixation target angles to determine angle λ by fitting a geometrical model. This method is validated with Orbscan II's angle-κ measurements in 9 eyes.
ResultsThe translation experiments show that the Zernike tilt coefficient is directly related to an angle ρ, which describes a tilt orientation of the cornea and can therefore be used to derive a value for angle λ. A significant correlation exists between measured values for angle λ with the VU Topographer and the angle κ with the Orbscan II (r=0.95, P<0.001). A Bland-Altman plot indicates a mean difference of -0.52 degrees between the two instruments, but this is not statistically significant as indicated by a matched-pairs Wilcoxon signed-rank test (P≤0.1748). The mean precision for measuring angle λ using the VU topographer is 0.6±0.3 degrees.
ConclusionThe method described above to determine angle λ is sufficiently repeatable and performs similarly to the angle-κ measurements made with the Orbscan II.
Desarrollar un método para calcular el ángulo λ del ojo humano utilizando el coeficiente de Zernike de tilt (inclinación del frente de onda) medido mediante topografía corneal por reflexión especular.
MétodosEl significado del término de tilt del desarrollo de Zernike en topografía corneal especular queda demostrado por medio de medidas realizadas con el Topógrafo VU en superficies artificiales desplazadas transversalmente. La relación que se deriva de los experimentos de traslación se utiliza para determinar el ángulo λ. Se realizan medidas de la superficie corneal para ocho puntos de fijación diferentes. Para cada uno de ellos se obtiene el ángulo ρ de tilt (inclinación) a partir del correspondiente coeficiente de Zernike de tilt. El conjunto de ángulos ρ se utiliza con respecto a los ángulos que forman los puntos de fijación correspondientes para determinar el ángulo λ, ajustando para ello un modelo geométrico. Este método se valida comparando los resultados con medidas del ángulo κ realizadas con el Orbscan II en 9 ojos.
ResultadosLos experimentos de traslación demuestran que el coeficiente de Zernike de tilt está directamente relacionado con un ángulo ρ, el cual describe la inclinación global de la córnea y, por lo tanto, se puede utilizar para derivar el valor del ángulo λ. Existe una correlación significativa entre los valores del ángulo λ medidos con el Topógrafo VU y los valores del ángulo κ medidos con el Orbscan II (r=0,95; P<0,001). Mediante una gráfica de Bland-Altman observamos una diferencia media de -0,52 grados entre los dos instrumentos de medida. Sin embargo, esta diferencia no resulta ser estadísticamente significativa, según indica el resultado de un contraste de Wilcoxon de rangos con signo para muestras apareadas (P≤0,1748). La precisión promedio de la medida del ángulo λ mediante el Topógrafo VU es igual a 0,6±0,3 grados.
ConclusionesEl método aquí descrito para determinar el ángulo λ presenta una repetibilidad aceptable y ofrece unos resultados de similar calidad a los de la medida del ángulo κ realizada con el Orbscan II.
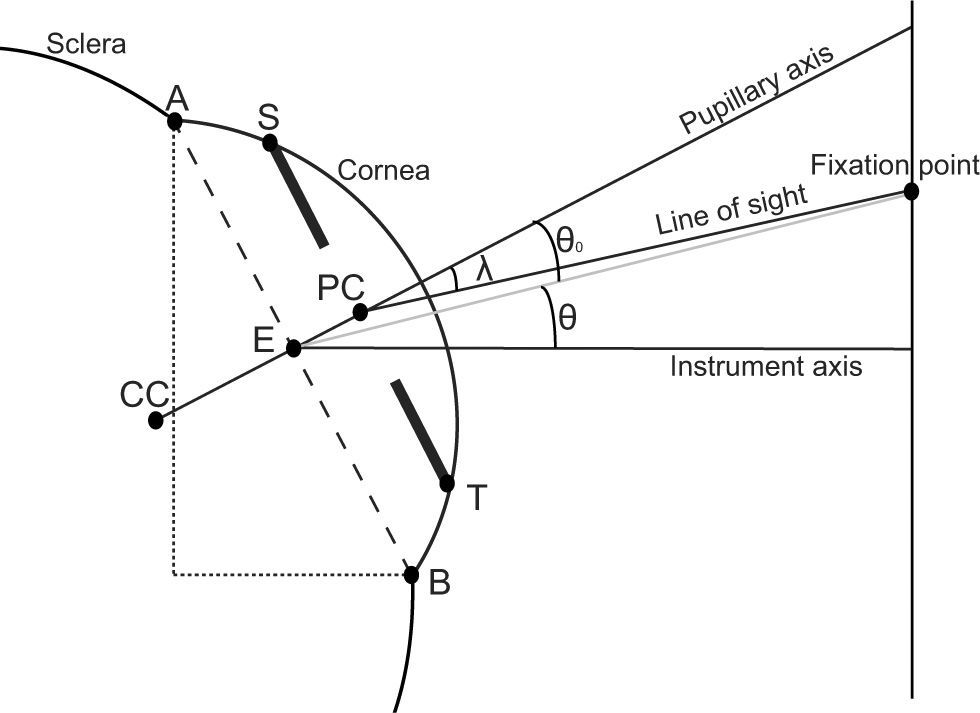
In evaluating the quality of the optics of the eye it is important to know the ray path of the light from a fixation point to the fovea. The first part of this ray path is defined as the line of sight, which is the connection from the eye's fixation point to the center of the pupil as seen refracted through the cornea. This image of the pupil is also called the entrance pupil.1 The line from the center of the entrance pupil to a point on the cornea with a perpendicular tangent is called the pupillary axis. This axis forms an angle with the line of sight which is called the angle λ.1 This angle can be seen as a global tilt offset of the eye when it fixates on a specific target and is a response to the eccentric displaced position of the fovea from the geometrical center of the retina.
In healthy individuals angle λ is positive and develops from an average value of eight degrees at birth to a relatively stable average value between five and six degrees at age three.2,3 Throughout literature angle λ is often called angle κ, due to conflicting formulations of the same angle with different names by Le Grand & El Hage and Lancaster, as pointed out, for example, by Tabernero.4 Readers interested in the angle-λ topic should therefore also consider reading literature on angle κ. While the real angle κ is defined as the angle between the visual axis and the pupillary axis1, it is practically equal to angle λ when the fixation point can be assumed to be far away.5 In this definition, the visual axis is defined as the line from the fixation point to the foveal image through the nodal points.1
The importance of the human eye's angle λ can be found in both clinical and technical applications. Clinically, angle λ is important when it comes to properly centering corneal surgery. A large angle lambda can cause misalignment of the photoablation site in laser refractive surgery,6 or misalignment of corneal graft material.7 Also, angle λ has been found to be a good parameter for the detection of strabismus and albinism.8-10 Furthermore, in the measurement of corneal topography with videokeratoscopic systems, angle λ was identified to be a factor of instrument misalignment and, therefore, responsible for the incorrect calculation of corneal aberrations.11 A solution to overcome this problem is to align videokeratoscopes to the line of sight.12 Furthermore, in aberration calculation angle λ is found to be significantly correlated with the compensation of horizontal coma of the cornea by the internal optics of the eye.4,13-16
Originally, angle λ is measured by looking at the corneal reflections of a fixation light. It is then qualitatively evaluated by the observer7-9 or quantitatively measured by means of instruments such as the synoptophore6 or through the use of a perimeter arc.17 These methods are modernized by the use of video gaze trackers which automatically detect and track corneal reflections along multiple fixation points.18 Angle λ is normally calculated in these methods based on the distance between the first Purkinje corneal reflection and the center of the pupil.7,18 Slit-lamp imaging or Scheimpflug imaging devices allow the reconstruction of a cross-sectional image of the anterior eye chamber. Angle λ can be calculated out of these images by calculating the tilt of the iris plane in the image with respect to the fixation target, as it is done by the Orbscan.6,19 In Placido–ring-based videokeratoscopes, angle λ can be calculated from the displacement of the pupil center relative to the center of a ring of the Placido system12 or from the displacement of the geometric center of a specified ring from the center of the ring system.20-22
Recently, a new type of specular reflection corneal topographer has been developed, which is different from Placido-ring-based systems in that a one-to-one correspondence between stimulator and image points is available.23-26 Also, these topographers measure the corneal shape usually along the line of sight, contrary to Placido-ring-based topographers. 11,27 They are validated to be more accurate and as precise than Placido-ring-based systems, especially when it comes to measuring the non-rotationally symmetric features of the cornea25,27,28. Models for measuring angle λ applicable to Placido-ring-based systems cannot be used for these new systems because they don’t use a ring system.
In this study, we develop a method for the determination of angle λ using the VU Topographer, a topographer where a one-to-one correspondence between stimulator and image points can be established. The angle λ values are derived from Zernike tilt measurements of the cornea. The Zernike tilt coefficients are often neglected and not well understood in ophthalmic applications. However, in this study, Zernike tilt coefficients are used to derive the angle λ of the eye. Furthermore, we validate this method by comparing it with angle-κ measurements carried out with the Orbscan II – a slit-lamp-based topographer.
MethodsThe VU –TopographerSpecular-reflection topographers are commonly used to measure the shape of the cornea. These topographers use patterns reflected by the cornea to form topographic reconstructions of the corneal surface. The VU-Topographer (VU University Medical Center, Amsterdam, The Netherlands) is a corneal topographer of this sort, with the advantage of providing a one-to-one correspondence between source points and captured points, thus eliminating skew ray ambiguity. 26,27 Apart from the standard corneal height map, the VU Topographer also describes the shape of the cornea by means of a Zernike polynomial expansion.29 This model extends the spherical model of the cornea into one that has finer details. In the Zernike convention, each polynomial term represents a unique shape and is either rotationally symmetric (e.g. defocus) or not rotationally symmetric (e.g. astigmatism). The coefficient of each term specifies how strong a particular corneal shape feature exists. In corneal topography, the first three Zernike terms are usually neglected. The first term Z(0,0) is a piston term which is related to the distance from the apex of the cornea to the nodal point of the lens camera system. This distance is a calibrated instrument constant and can therefore be neglected. The second Z(1,-1) and third Z(1,1) terms describe the tilt of the corneal surface with respect to the optical axis of the lens camera system and are called vertical tilt and horizontal tilt, respectively.30
The Meaning of the Zernike TiltBy standard convention, the monomial representation of the Zernike x-tilt term is defined as:30

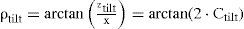
The ztilt and the x variable form an angle ρtilt which can be determined directly from the coefficient Ctilt:
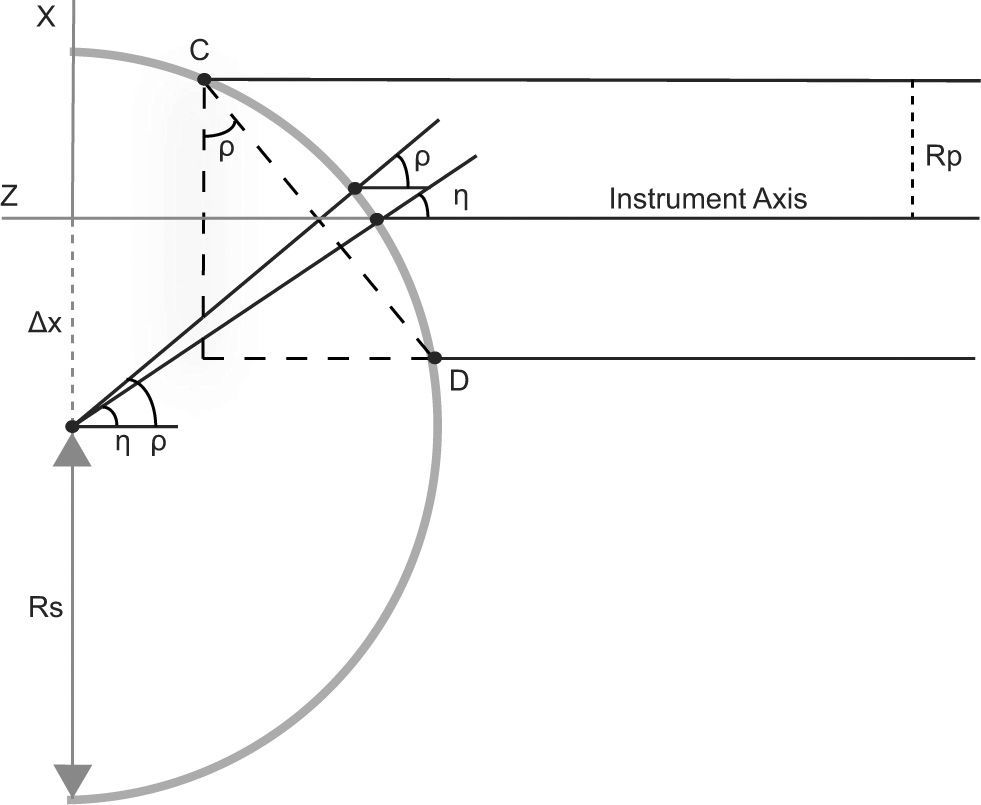
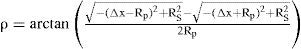
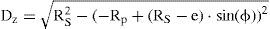
It can be shown that this angle ρtilt(Figure 1) is related to a surface orientation as measured in corneal topography. This is demonstrated by a series of measurements carried out on artificial surfaces that are translated horizontally. In figure 1, the x-z plane of a typical spherical surface is shown where the apex of the surface is translated along the x-axis with respect to the instrument axis. In this configuration the angle ρ can be theoretically calculated based on the value of that translation (Δx; displacement of the surface apex relative to the instrument axis), the surface radius (Rs) and the radius of the surface area over which Zernike polynomials are fitted (Rp), using geometrical modeling:

Two-dimensional schematic model of the translation experiment. Δx describes the translation of the surface apex along the x-axis. Points C and D are the borders of the measured surface area, which has a radius of Rp. ρ is the angle formed by line segment CD¯ and the x-axis and η is the angle between the instrument axis and the surface normal.
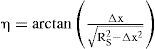
The Zernike tilt is often mistakenly linked with the angle η that the normal to the surface makes with the instrument axis (Figure 1). The angle η can be derived using the same spherical geometrical model of figure 1:
To show that the Zernike tilt is related to angle ρ and not to angle η, several measurements are done in which an artificial surface is translated in steps of 0.5 mm along the x-axis, with Δx ranging from -2 mm to 1.5 mm with respect to the instrument axis. These measurements are repeated for four types of artificial surfaces to investigate the dependence of the Zernike tilt on the surface features, including the orientation of the surface normals. The artificial surfaces include a pure sphere, a sphere + coma feature, a sphere + trefoil feature, and a sphere + quadrafoil feature. All surfaces have a base radius of 8.00 mm and a feature amplitude of 5 μm. The surfaces are made of PMMA material and were manufactured by SUMIPRO BV, Almelo, The Netherlands. Shape fitting is done following Zernike convention up to the 6th radial order, within a surface zone diameter of 6.0 mm. The experimental relation (2) and theoretical relations (3) and (4) are compared using chi-square statistics evaluated on the absolute value of the angles. The chi-square values will indicate how close the theoretical values are to the experimental values.
Using Zernike tilt to Measure the Angle λThe angle λ can be determined in real eyes by applying equation (2) to corneal topography measurements. A similar model to the one proposed here was simulated in a previous investigation by Salmon and Thibos.11 In this simulation, the instrument axis of the videokeratography system is aligned to the line of sight and a linear relationship was observed between the angle λ and the Zernike tilt coefficient. In the present study, several off-axis fixation points are used where the instrument axis and the fixation axis are not co-axial (parallel). The measurements in this study are not done along the line of sight and, therefore, they can not be used for the determination of the corneal aberrations. However, they can be useful when the aim is to get the tilt orientation of the cornea. Although this is a different situation, compared to that of the Salmon/Thibos study,11 a similar linear relationship can be observed, this time between the angle ρ and the fixation angle θ. This linear relationship is a natural consequence of the geometrical properties of the cornea.
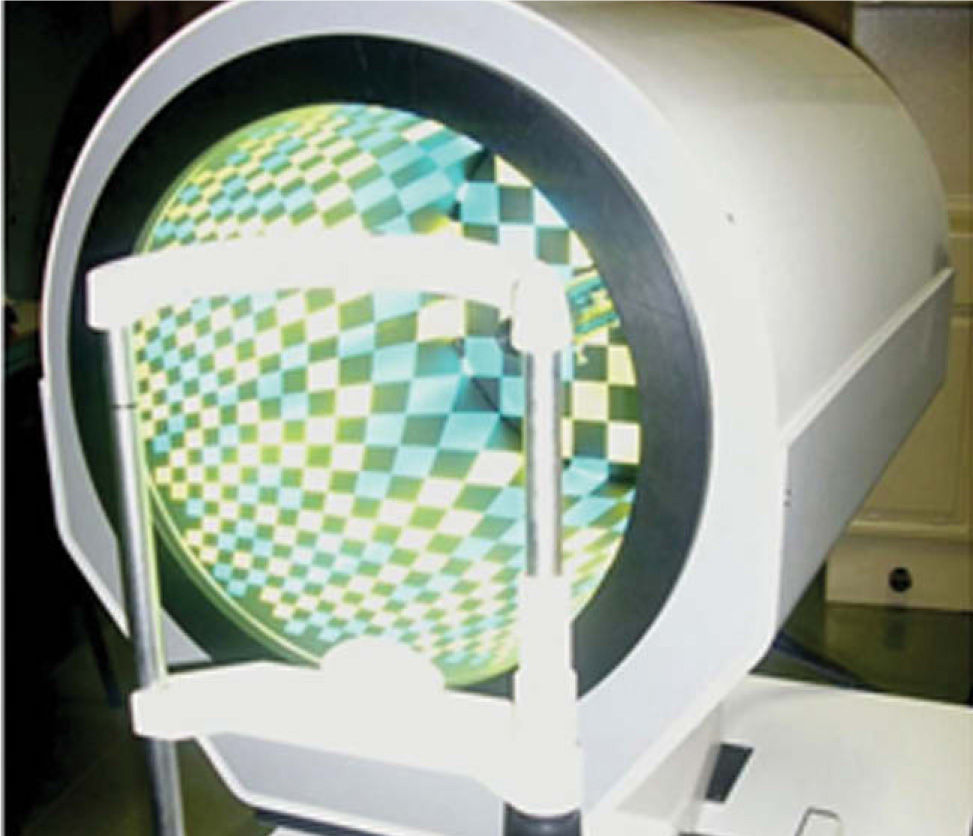
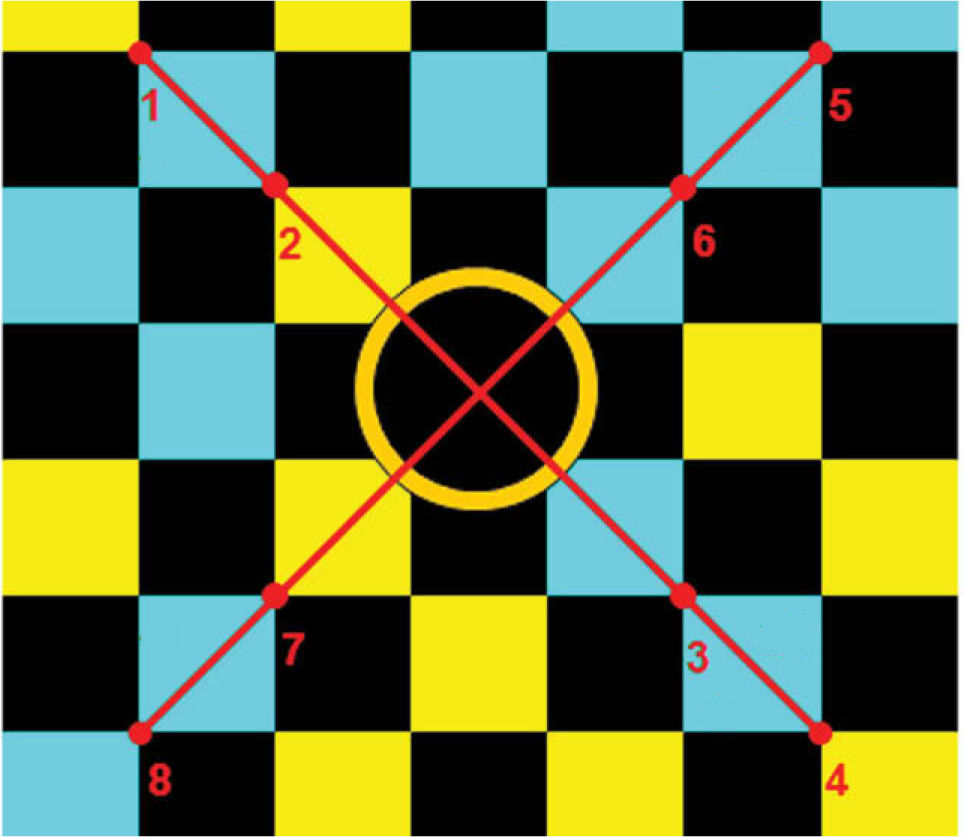
Subjects are measured with the VU Topographer (Figure 2) and are asked to look at eight fixation points at the stimulator's back-panel, for which the color-coded pattern, as seen by the subject, is shown in figure 3. The color-coded squares are used to define the eight fixation points and are each marked by the border between four squares. The fixation points are distributed in such a way that redundancy exists in terms of fixation angles (both in the x- and y-directions), in order to record repeated measurements of the same angles. Since the limbus is proven to be a more reliable landmark than, for instance, the pupil center,31 the measurements are centered on the subject's limbus.


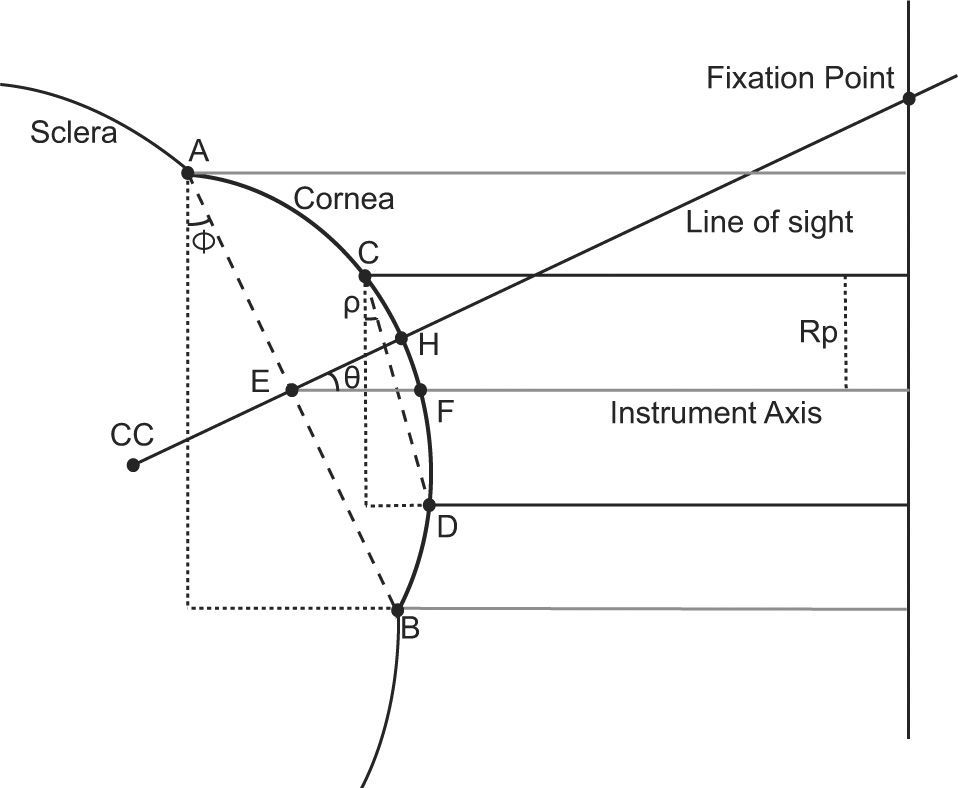
The known fixation angle θ of the stimulator point is shown in figure 4: it is the angle between the instrument axis and the line connecting the center of the limbus plane with the fixation point. The model in figure 4 represents an eye with an angle λ equal to zero for a clear visualization of the geometrical model. In the case where the angle λ is not equal to zero, the angle θ in figure 4 can be considered to be the summation of the angle λ and the fixation angle θ. Angle ρtilt is calculated from the Ctilt output of the VU Topographer using equation (2). Assuming a spherical cornea with small angles θ, the relation between angle ρtilt and an angle θ is:

Schematic diagram showing the geometrical model used to determine the angle λ. CC: centre of curvature of the cornea; A and B: the edges of the limbus; E: the midpoint on the line segment AB¯; H: the intercept of the line CC E¯ with the cornea; Point F: the intercept of the instrument axis with the cornea; Rp: the radius of the measured surface area, with points C and D being its borders on the cornea.
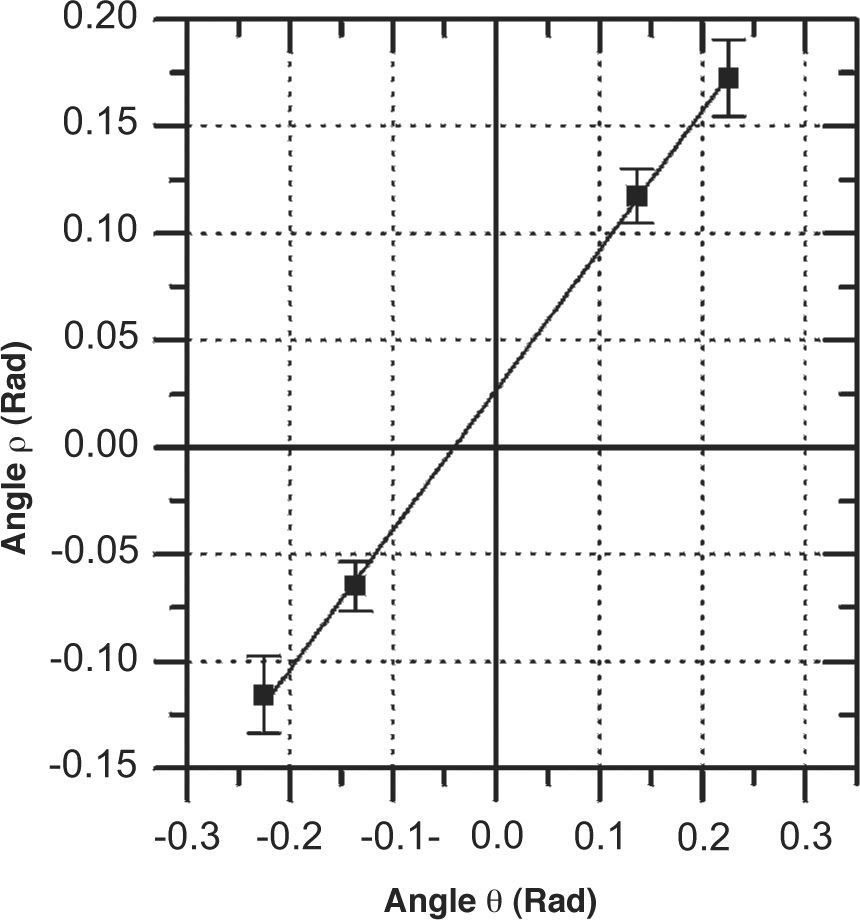
where e is related to the distance from the limbal plane to the corneal apex. The dependence on e in finding angle λ can be eliminated by combining the measurements of all stimulator points. The angles ρtilt are plotted against the known fixation angles θ and a linear regression line is fitted to all measured points. Angle λ can be then directly determined from the θ-intercept of the fit. By applying this method to the ρtilt values obtained from both the Zernike x- and y-tilt coefficients, both components (in both x- and y-directions) of the angle λ can be determined. A typical example of the linear fitting of ρtilt in the x-direction is shown in figure 5. The complete derivation of relation (5) can be found in the Appendix.

A typical plot of angle ρ in the x-direction, obtained by plotting measured Zernike x-tilt values against fixation angles θ. The linear relation between angle ρ and angle θ is shown. The error bars indicate the spread of angle ρ obtained from three repeated measurements for two fixation points with the same angle θ.
The angle λ derived from the VU topographer is compared with the angle-κ values obtained from Orbscan II (Bausch & Lomb, Rochester, NY, USA). The Orbscan II was chosen because it has a readily available feature to measure angle κ, which has been previously validated with synoptophore procedures.6 The synoptophore validation study showed that despite of the Orbscan II giving significantly higher values of angle κ, there was a high correlation between the two instruments, which means that the differences are systematic.
The comparison of the Zernike tilt method is validated with 9 eyes (average age 36 years, ranging from 22 to 63 years; 8 males and 1 female; equivalent refractive error ranging from -1.25 to +4 diopters). The research followed the tenets of the Declaration of Helsinki. Written informed consent was obtained from the subjects after explanation of the nature and consequences of the study. The study was reviewed and approved by the Medical Ethics Committee of the VU University Medical Center, Amsterdam, The Netherlands.
The shape fitting of the VU Topographer is done following Zernike convention up to the 6th radial order, within a surface zone diameter of 6.0 mm.
Three repeated measurements for every subject and for every fixation point are carried out both with the Orbscan II as well as with the VU Topographer. In preparation for the statistical analysis, the resulting values from the Orbscan II are averaged, while for the VU Topographer for every fixation point the average ± standard deviation is used in the linear fit of relation (5). The Zernike-tilt method described above calculates the value of angle λ in one direction only: the x-direction for the Zernike x-tilt and the y-direction for the Zernike y-tilt. Since no anatomical dependency between the λx and λy is known in literature, they are treated as separate measurements in the statistical analysis. Consequently, the measured angle-κ values from the Orbscan II are decomposed in their x- and y-components using the given meridian angle:
where κtotal is the full angle κ, κx and κy are its x- and y- components, respectively, and γ is the meridional angle of the corneal surface angle in which angle κ is positioned. It is considered that angle λ is approximately equal to angle κ, which is a valid assumption for measurements where the fixation points are sufficiently far away.5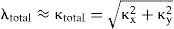

Statistical analyses for instrument comparison are performed using a Pearson correlation test, a Bland-Altman plot,32,33 and a non-parametric Wilcoxon matched-pairs signed rank test. Possible dependency between λx and λy is investigated by means of a Pearson correlation test. The precision of the VU Topographer in measuring angle λ is quantified by means of the standard deviation for three trials, which is averaged over all subjects.
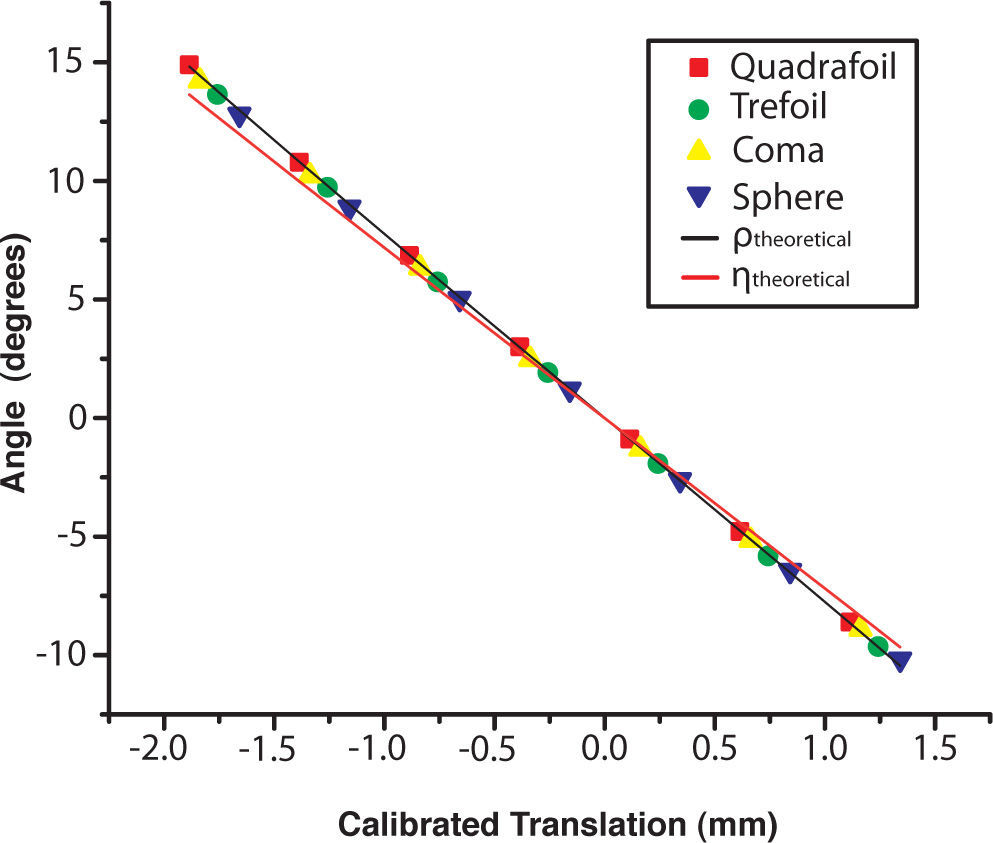
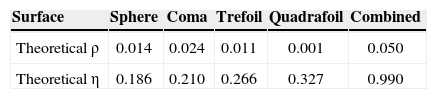
ResultsThe Meaning of the Zernike TiltThe effect of surface translation on angle ρ is shown in figure 6. The theoretically expected ρ is shown as a black line, the theoretically expected η is shown as a red line, and the experimentally obtained values for angle ρ are shown as colored dots. The chi-square statistic test values for both models for all surfaces as well as all together are presented in table 1. In general, the theoretical ρ model predicts the experimental ρ values more accurately than the theoretical η model, with overall chi-square values of 0.050 degrees and 0.990 degrees respectively. The chi-square value for the theoretical ρ model is below 0.025 degrees for all surface types, while it is greater than 0.185 degrees for the theoretical η model.

The results of the translation experiments, where the experimental values obtained for angle ρ are shown as colored objects: red squares for the quadrafoil surface, green circles for the trefoil surface, yellow upright triangles for the coma surface, and blue inverted triangles for the spherical surface. The theoretical models are depicted as a black line for ρ and a red line for η.
Comparison of the experimentally determined ρ with the theoretical models for ρ and η using chi-square statistics. The chi-squared values are given in degrees
| Surface | Sphere | Coma | Trefoil | Quadrafoil | Combined |
| Theoretical ρ | 0.014 | 0.024 | 0.011 | 0.001 | 0.050 |
| Theoretical η | 0.186 | 0.210 | 0.266 | 0.327 | 0.990 |
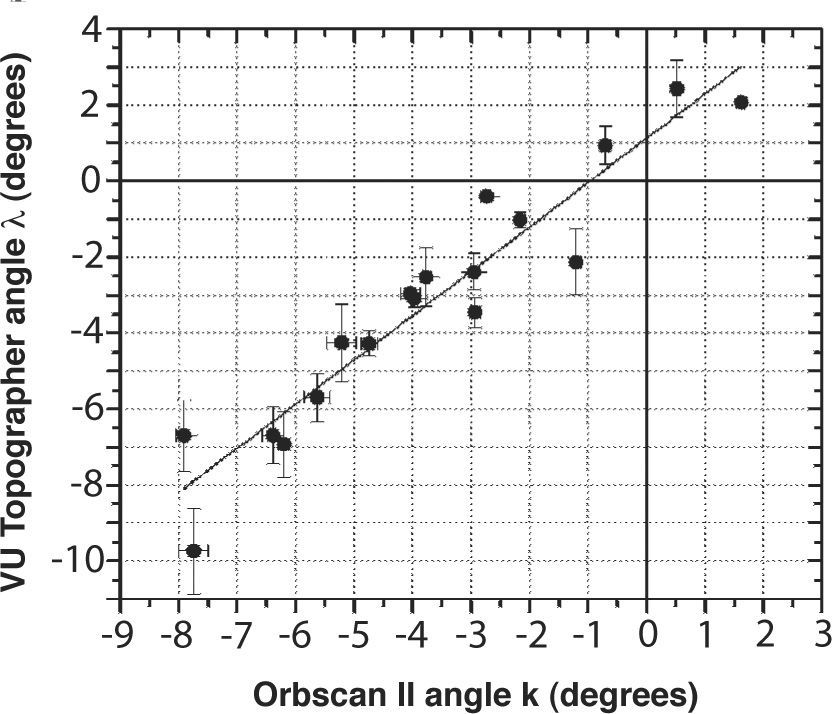
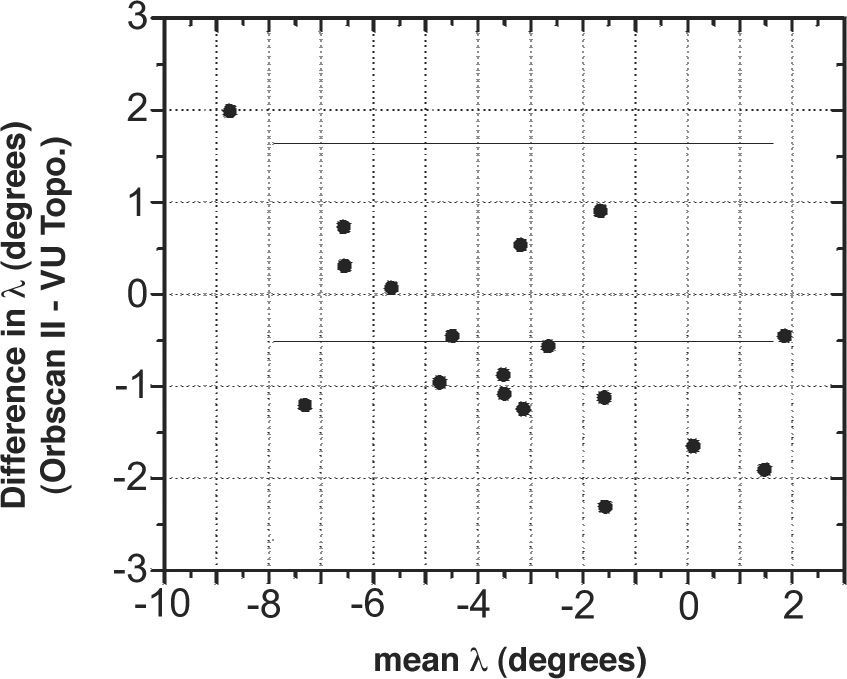
No significant correlation is found between λx and λy for the measurements carried out with the VU Topographer, as indicated by the Pearson correlation test (r=0.43, P>0.2). The correlation between the angle λ measured with the VU Topographer and the angle κ measured with the Orbscan II is shown in figure 7. There is a strong and significant correlation between the angles yielded by the VU Topographer and those obtained with the Orbscan II: r=0.95, P<0.001. A Bland-Altman plot of the comparison is shown in figure 8, reporting a mean difference of -0.52 degrees with a 95% limits of agreement of [-2.67,1.64]. A Wilcoxon matchedpairs signed rank test proves that the difference found is not statistically significant, with P<=0.1748. The precision in determining angle λ, as measured with the VU Topographer, is 0.6±0.3 degrees.

![Bland-Altman plot comparing the VU-topographer with the Orbscan II, and indicating a difference of -0.52 degrees with a 95% limits of agreement of [-2.67,1.64].](https://static.elsevier.es/multimedia/18884296/0000000200000004/v2_201308272051/S1888429609700482/v2_201308272051/en/main.assets/gr8.jpeg?xkr=ue/ImdikoIMrsJoerZ+w93meMsSv3kCFu9ka1kgzl/xrK32s3f4YRcWD6Dd7AXarpdNwuTG4boz7u8BYi3GYCINa+dVGwguUFD23Wulaui7AWVXG8mVx1auMQehHagbsNO+Lw3aZp9EaNfS8Lw35Pw7P4Wp9s5Q+qm8s2OMYn0zTxvH85r7OQtCvfIHoNqCbYUNWTdjrIPlU9yGEmEXAvg3/55QHDDuURcKSwZ6BKi2eDSjuZ3CxHIGtv2uUuvKZe3zQZiZBiwEDtWsmFvTQL3z3PyIoo04Kl8aqArGj1uk= "Bland-Altman plot comparing the VU-topographer with the Orbscan II, and indicating a difference of -0.52 degrees with a 95% limits of agreement of [-2.67,1.64].")
From an initial assessment one might think that the Zernike tilt is directly related to the angle between the surface normal and the instrument axis (angle η in figure 1). The results of the translation experiments do not support this supposition and show that the chi-square value is significantly lower for the theoretical ρ model than for the theoretical η (surface normal) model, indicating that the former has a better similarity to the experimentally obtained angle ρ. Furthermore, the experimentally measured angle ρ is practically the same for all surface types. Since the surface normals are different for the various surface types, therefore the measured Zernike tilts can not be correlated with the surface normals. Instead, the Zernike tilt term measures a tilt feature of the corneal surface (angle ρ in figure 1); it specifies the global tilt of the cornea within a margin of error of 0.050 degrees, which is applicable to λ angles as large as 14 degrees.
For real-eye measurements, it is noteworthy that the linear fit of the scatter plot between Orbscan II and the Zernike tilt method (Figure 7) does not intersect the (0,0) point and has a slope not equal to unity. Consequently, the Bland-Altman plot (Figure 8) shows a mean difference of -0.52 degrees between both methods. Nevertheless, a Wilcoxon matched-pairs signed-ranks test shows that this difference is not statistically significant. This indicates that both methods are interchangeable when it comes to measuring angle λ.
The Zernike tilt method relies on two assumptions: (1) a spherical corneal surface and (2) it considers the pupil center and the limbal center to lie on the pupillary axis. Figure 5 shows that the first assumption is valid because the measured values for angle ρ can be well fitted linearly. Any error related to this assumption is described by the error in the fit coefficients from which the angle λ is derived. The second assumption could have a direct effect on the calculated value for angle λ, since the geometrical relationship between angle λ and angle θ would change. In the case of pupil decentration, the expression for the slope in equation (5) will change. Nevertheless, the linear approximation would still be valid. The biggest changes will be in the values of ρ in equation (5) and, therefore, the slope and the θ-intercept that will be generated (Figure 5) will slightly change. However, the pupildecentration correction should be accompanied by measurements aligned to the pupil center instead of the limbal center. The Zernike method presented in this study should therefore be treated as a first approximation to the actual value of angle λ. The error arising from this approximation can be estimated using a small-angle approximation (Figure 9) since the fixation point is sufficiently far away from the cornea. In a worst-case scenario of a 1 mm pupil decentration19 the error is 0.12 degrees because the fixation points are at least 480 mm away from the corneal surface. This error is too small to be detected by statistical tests since it falls within the precision of the method.

Another representation of figure 5 with a negative angle λ. CC: centre of curvature of the cornea; A and B: the edges of the limbus; E: the midpoint on the line segment AB¯; PC: the center of the entrance pupil; points S and T: the edges of the entrance pupil plane.
Basmak et al.6 reported significantly higher values for angle κ, as measured with the Orbscan II, compared to synoptophore measurements. However, there was also a significant correlation between the values measured with the two instruments. This suggests that the difference is systematic, as occurs, for example, when there are differences in calibration. Therefore, both instruments can be considered to provide good measures of angle κ. This means that the Zernike tilt method is also comparable to the existing methods; e.g. the synoptophore. Nevertheless, at this moment no solid conclusion can be drawn on which instrument is the most accurate, because no gold standard for measuring angle λ exists yet.
To conclude, it is shown that Zernike tilt coefficients relate directly to the global tilt orientation of the surface under evaluation and that it can be used to measure the eye's angle λ by means of a corneal topographer. The proposed method looks promising: it is sufficiently repeatable and it performs similarly to the angle-κ measurements carried out with the Orbscan II, at least for regular eyes.
The research described in this article followed the tenets of the Declaration of Helsinki. Written informed consent was obtained from the subjects after explanation of the nature and consequences of the study. The study was reviewed and approved by the Medical Ethics Committee of the VU University Medical Center, Amsterdam, The Netherlands.
Financial disclosure: Sicam and Van der Heijde have commercial interest in the VU topographer.
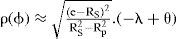
In order to calculate the angle λ from measured angles ρ two steps are taken: (1) the angle ϕ is calculated from the angle ρ using the model shown in figure 4 and (2) the angle λ is calculated from the fixation angle θ using the model shown in figure 9.
The relation between ϕ and ρ is obtained by taking the point CC as the (0,0) point in an xz coordinate system, where x is the axis perpendicular to the instrument axis and z is parallel to the instrument axis. In this model e is defined as the length of the line segment EH, which is the depth of the limbus plane. In an eye with an angle λ equal to zero, the angles ϕ and θ are actually the same, as shown in figure 4. In case of a non-zero angle λ, the angle ϕ will be almost equal to the summation of angle λ and the fixation angle θ. Consequently, in that case the angle called θ should be renamed to (θ + λ) in figure 4. Angle ϕ and e form a relationship from which the coordinates of point F can be calculated:
The x-coordinates of points C and D differ by +Rp and –Rp from the x-coordinate of point F, where Rp is the radius of the measured area. Points C and D are coordinates on the corneal surface and, therefore, their z-coordinates can be calculated from the intercept with the cornea. When the cornea is assumed to be a perfect sphere, the coordinates of point C are:

Similarly, the coordinates of point D are given by:

Points C and D can be used to define the cosine of angle ρ:
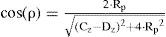
If equation (A7) is solved for angle ϕ as a function of angle ρ, the following relationship is found:
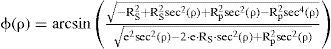
For small values of the angle ρ, equation (A8) can be approximated by a linear relation:
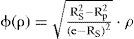
This relation shows that it is possible to determine the angle ϕ when Rs, e and ρ are known.
Equation (A9) is equal to the fixation angle θ when angle λ is zero. In all other cases the relation of (A9) needs to be extended with angle λ, since it will give the eye an offset in its fixation angle called θ0. A pupil plane is introduced in the model, going from point S to point T, as shown in figure 9. The pupil center is represented by the point PC and is assumed to be on the line connecting the center of curvature of the cornea CC with the limbus plane center E. Since the distance from point E to point PC is relatively small compared to the distance from point E to the fixation point, the angle λ can be considered to be equal to the fixation angle offset θ0:

The total tilt angle of the eye can be written as the summation of θ0 and θ, as shown in figure 9:
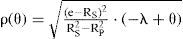
Angle λ is taken negative in figure 9 for an easier representation of all the angles in the figure. The complete relation between ρ and θ is now given by: