

To study the capability of scanning laser polarimetry with variable corneal compensation (GDx VCC) to detect differences in retinal nerve fiber layer thickness between normal and glaucomatous eyes in a Taiwan Chinese population.
MethodsThis study included 44 normal eyes and 107 glaucomatous eyes. The glaucomatous eyes were divided into three subgroups on the basis of its visual field defects (early, moderate, severe). Each subject underwent a GDx-VCC exam and visual field testing. The area under the receiver-operating characteristic curve (AROC) of each relevant parameter was used to differentiate normal from each glaucoma subgroup, respectively. The correlation between visual field index and each parameter was evaluated for the eyes in the glaucoma group.
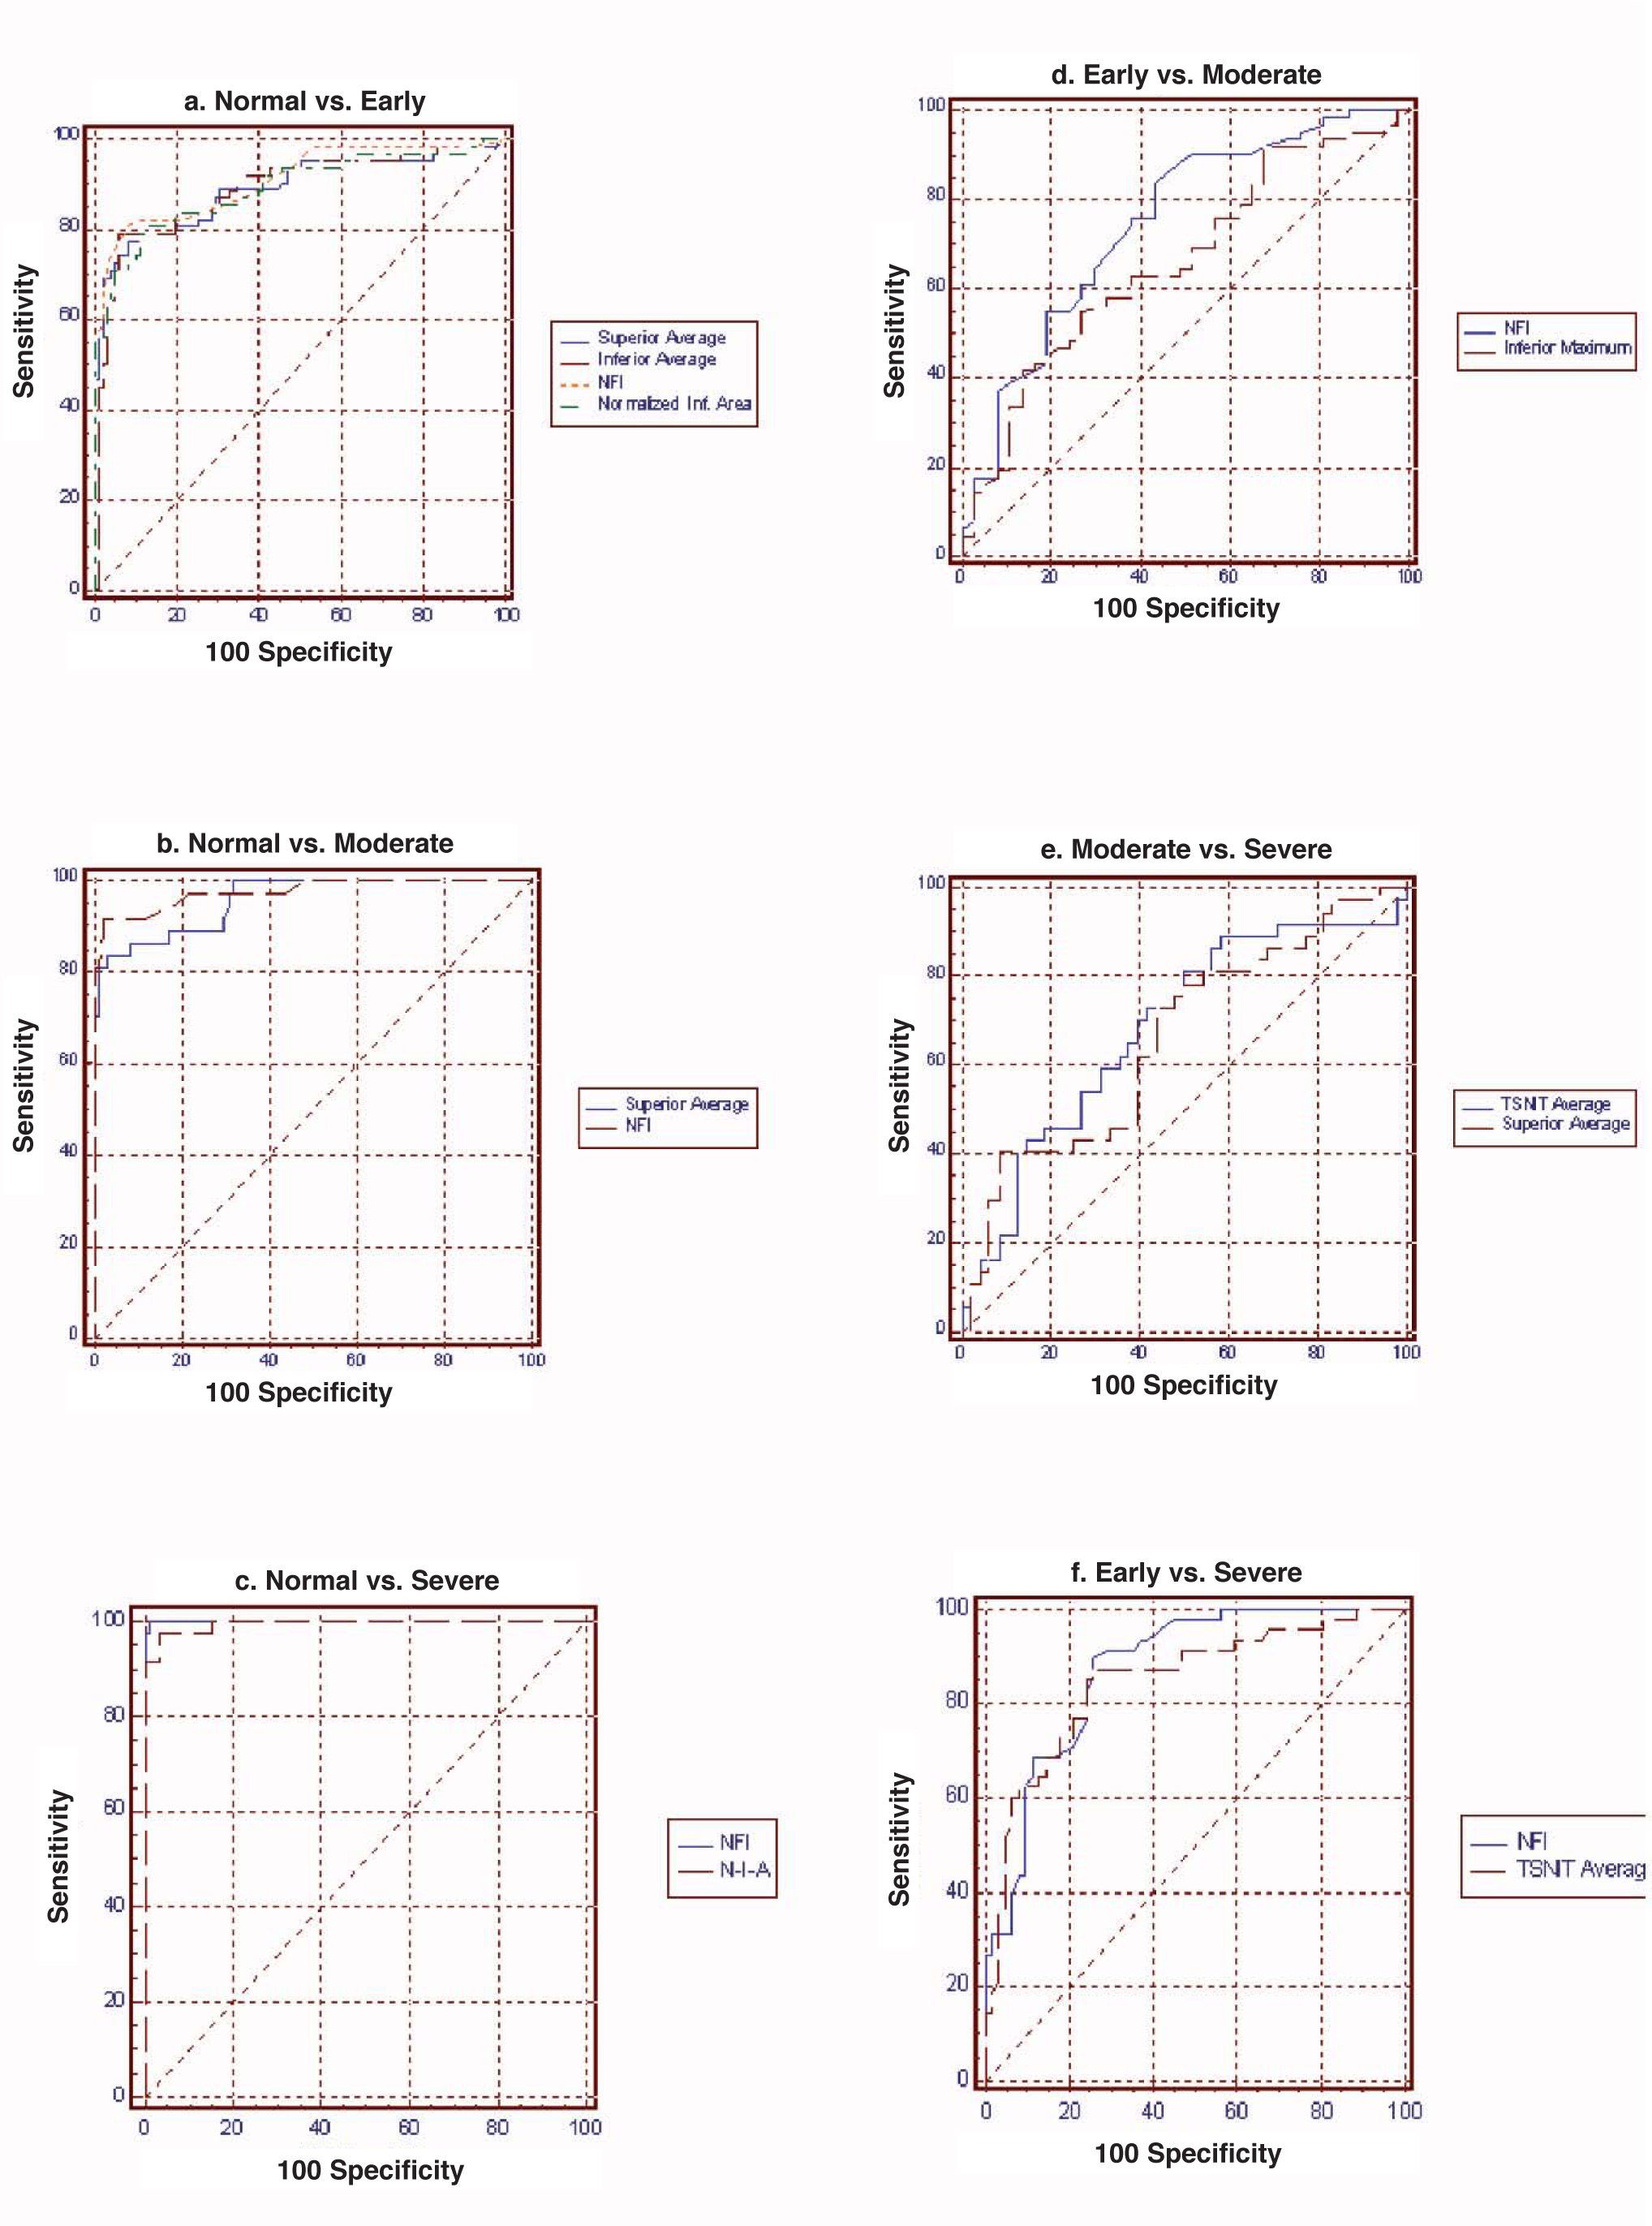
ResultsFor normal vs. early glaucoma, the parameter with the best AROC was Nerve fiber indicator (NFI) (0.942). For normal vs. moderate glaucoma, the parameter showing the best AROC was NFI (0.985). For normal vs. severe glaucoma, the parameter that had the best AROC was NFI (1.000). For early vs. moderate glaucoma, the parameter with the best AROC was NFI (0.732). For moderate vs. severe, the parameter showing the best AROC was temporal-superior-nasal-inferior-temporal average (0.652). For early vs. severe, the parameter with the best AROC was NFI (0.852).
ConclusionsGDx-VCC-measured parameters may serve as a useful tool to distinguish normal from glaucomatous eyes; in particular, NFI turned out to be the best discriminating parameter.
Estudiar la capacidad de la polarimetría láser de barrido con compensación corneal variable (dispositivo denominado GDx VCC) para detectar la diferencias de espesor de la capa de fibras nerviosas de la retina que existen entre ojos normales y ojos con glaucoma, en una población china de Taiwan.
MétodosEn este estudio se incluyeron 44 ojos normales y 107 ojos con glaucoma. El grupo de ojos con glaucoma se dividió, a su vez, en tres subgrupos según los defectos campimétricos encontrados (glaucoma temprano, moderado o grave). A cada sujeto se le realizaron medidas de GDx-VCC y una exploración del campo visual. Para discriminar entre el grupo normal (de control) y cada uno de los subgrupos con glaucoma se utilizó el área bajo la curva ROC (AROC) obtenida para cada parámetro de interés. Además, para los ojos con glaucoma se evaluó la correlación entre un índice del campo visual y cada uno de los parámetros obtenidos mediante GDx-VCC.
ResultadosPara la discriminación ojos normales — glaucoma temprano, el parámetro que proporcionó el AROC mejor o más elevado (valor=0,942) fue el indicador de fibras nerviosas (NFI). Para la diferenciación ojos normales — glaucoma moderado, el parámetro con el mejor AROC (igual a 0,985) fue el NFI. Para ojos normales — glaucoma grave, el parámetro con el mejor AROC fue el NFI (1,000). Para glaucoma temprano — moderado, el parámetro con el mejor AROC (valor=0,732) fue el NFI. Para la diferenciación glaucoma moderado — grave, el parámetro que proporcionó el mejor AROC (igual a 0,652) fue el temporal-superior-nasal-inferior-temporal. Para la discriminación glaucoma temprano — grave, el parámetro con el mejor AROC (valor=0,852) fue el NFI.
ConclusionesLos parámetros medidos mediante GDx VCC pueden ser una herramienta útil para discriminar ojos con glaucoma de los ojos normales; en particular, el NFI resultó ser el mejor parámetro para tal fin.
Quigley et al.1 reported that up to 40 to 50% of the retinal nerve fiber layer (RNFL) could be lost before visual field defects are detected by means of Goldmann kinetic perimetry. Therefore, the evaluation of RNFL thickness is important for early glaucoma detection. Many imaging technologies have been introduced for the objective assessment of the RNFL, such as scanning laser polarimetry (GDx),2-4 which estimates RNFL thickness by measuring the joint retardation of a polarized scanning laser beam. The GDx VCC machine (Laser Diagnostic Technologies, Inc) shows moderate to good discrimination ability in the diagnosis of glaucoma.5-7 In clinical glaucoma practice, it is also important to understand the severity of glaucoma.8 There is increasing evidence that shows that both structural and functional tests are important when it comes to assessing early damage and progression.9-11 Therefore, it is necessary to objectively assess the glaucomatous damage occurred. Here, in the present work, we conducted a comparative study to evaluate RNFL thickness in normal eyes and in glaucomatous eyes in differing stages of the disease. To our knowledge, there are no reports on RNFL thickness measured with GDx VCC as a function of the glaucoma severity grades that focus on a Chinese population. We aimed to evaluate the diagnostic ability of GDx VCC to discriminate between the different stages of the glaucoma disease. The RNFL thickness measured by GDx VCC will be compared across the groups described above. The correlation between the resulting parameters and the outcome of visual field testing was evaluated for the different subgroups of glaucomatous eyes.
Materials and MethodsThis cross-sectional study included 50 normal eyes from 50 normal subjects and 123 glaucomatous eyes from 123 glaucoma patients. The glaucoma patients are among those people who had sought treatment at the Department of Ophthalmology, China Medical University Hospital (CMUH). Subjects with normal eyes were volunteers from the staff or their family members at the CMUH. This research follows the tenets of the Declaration of Helsinki. Informed consent was obtained from all participants, and the study was approved by the Institutional Review Board of the CMUH.
Each subject underwent a detailed ophthalmic examination, including slit-lamp biomicroscopy, gonioscopy, pachymetry, Goldmann applanation tonometry, stereoscopic examination of the optic disc, and standard automated perimetry (SAP, 30-2 mode, Humphrey Field Analyzer, model 750, HFA; Carl Zeiss Meditec, Inc.). All subjects underwent were assessed by means of the GDx VCC imaging technique within 3 months of the clinical examination and visual field testing. GDx VCC imaging was performed by one experienced operator. Subjects with a best-corrected visual acuity of less than 20/40, a spherical equivalent outside the ±6.0 diopter range, and a cylinder correction >3.0 diopters were excluded. Patients whose eyes suffered from coexisting retinal diseases, uveitis, or unknown optic neuropathy were also excluded from this study.
Normal control eyes had normal findings in clinical examination, an intraocular pressure (IOP) not exceeding 21 mmHg, no history of increased IOP, normal-looking optic nerve12 (intact rim, no evidence of hemorrhage, focal rim thinning, notching, glaucomatous excavation or RNFL defects) and normal visual-field results. A normal visual field was defined as a mean deviation (MD) and a pattern standard deviation (PSD) within 95% confidence limits, and a Glaucoma Hemifield Test (GHT) result within normal limits.
Inclusion criteria for the glaucoma groups included an intraocular pressure above 22 mmHg, an open angle, and a reproducible glaucomatous visual field defect in the absence of any other abnormalities that could explain that defect.
Visual Field TestingAchromatic automated perimetry was performed by means of a Humphrey Field Analyzer II (Carl Zeiss Meditec, Inc.) using the central-full-threshold program (number 30-2) of the visual field testing device. Visual field reliability criteria included fixation losses and false-positive and false-negative rates of less than 20%. The evaluation of glaucomatous visual field defects was made based on the following liberal criteria: two or more contiguous points with a pattern deviation sensitivity loss of P<0.01, or three or more contiguous points with a sensitivity loss of P<0.05 in the superior or inferior arcuate areas, or a 10 dB difference across the nasal horizontal midline at two or more adjacent locations and an abnormal result on the glaucoma hemifield test.13 Visual field defects had to be confirmed on at least two separate examinations. The categorization of glaucoma eyes into three subgroups was performed by applying Hodapp's classification, which is based on the MD visual field index.8 Briefly to say, early glaucoma was defined by a visual field loss with an MD better than -6 dB, moderate glaucoma by an MD between -6 dB and -12 dB and severe glaucoma by an MD worse than (i.e., below) -12 dB.
Scanning Laser Polarimetry MeasurementsGDx VCC measurements were carried out by the same trained and experienced person that performed the visual field tests. The subject's pupil was left undilated and the room lights were kept on. The spherical equivalent of the refractive error was input into the software to allow the GDx VCC to focus the laser beam on the retina. The GDx VCC device measures the retardation of the two components of a polarized laser beam (in nanometers) and a fixed conversion factor was used to calculate the corresponding RNFL thickness in micrometers. The images were analyzed with version 5.5.0 of the software. To ensure an accurate corneal thickness measurement, the software provided an image quality check score (1-10) based on the correct alignment, fixation, and refraction of the scan. The variable corneal compensator was then set so as to neutralize the anterior corneal birefringence, and the retinal retardation was imaged and measured. The margin of the optic disc was manually marked with an ellipse of the reflection image of the fundus. All images had to be of high quality, i.e., a well focused, even, centered optic disc without any motion artifacts. Furthermore, in the present study a score of 8 was selected as the minimum standard for good-quality scans. Each patient underwent multiple GDx VCC scans until a successful (i.e., high-quality) one was obtained. Only one successful scan per eye was saved onto the hard disc and printed out. All the printouts were evaluated by the same ophthalmologist. To avoid the image artifact, we excluded any atypical scan showing an atypical birefringence patterns (6 normal eyes and 16 glaucomatous eyes were excluded). Atypical scans are scans with an atypical birefringence (i.e., retardance) pattern (ABP) that is not representative of those RNFL thickness patterns found histologically (i.e., increased birefringence superiorly and inferiorly, indicating a thicker RNFL compared with decreased birefringence temporally and nasally, indicating a thinner RNFL).14 As a result, only 44 normal eyes and 107 glaucomatous eyes were further analyzed. We evaluated all the parameters included in the GDx VCC-analyzer printout. Finally, 14 RNFL thickness parameters were selected: temporal-superior-nasal-inferior-temporal (TSNIT) average (total average RNFL thickness), superior average, inferior average, TSNIT standard deviation, nerve fiber indicator (NFI), superior ratio, inferior ratio, superior/nasal, maximum modulation, superior maximum, inferior maximum, ellipse modulation, normalized superior area, and normalized inferior area.
Statistical AnalysesThe statistical analysis was performed on a personal computer using SPSS (Version 11.0; SPSS, Chicago, IL). Differences in age, visual field MD, and average RNFL thickness (measured with GDx VCC) across the groups under study were evaluated by means of ANOVA. The area under the receiver operating characteristic (AROC) curve was used to assess the ability of each parameter to differentiate normal eyes from glaucoma eyes, for each of the established glaucoma subgroups. The AROC was calculated using MedCalc software, version 9.0 (MedCalc Software, Mariakerke, Belgium). The ROC-curve comparison was done according to the method proposed by Hanley et al.15 The correlation of each visual field index (MD and PSD) with the various GDx VCC-measured parameters was evaluated based on the resulting Pearson's coefficient of correlation. In all statistical analyses, we set significance at 0.05/N, where N is the number of tests used (Bonferonni correction).
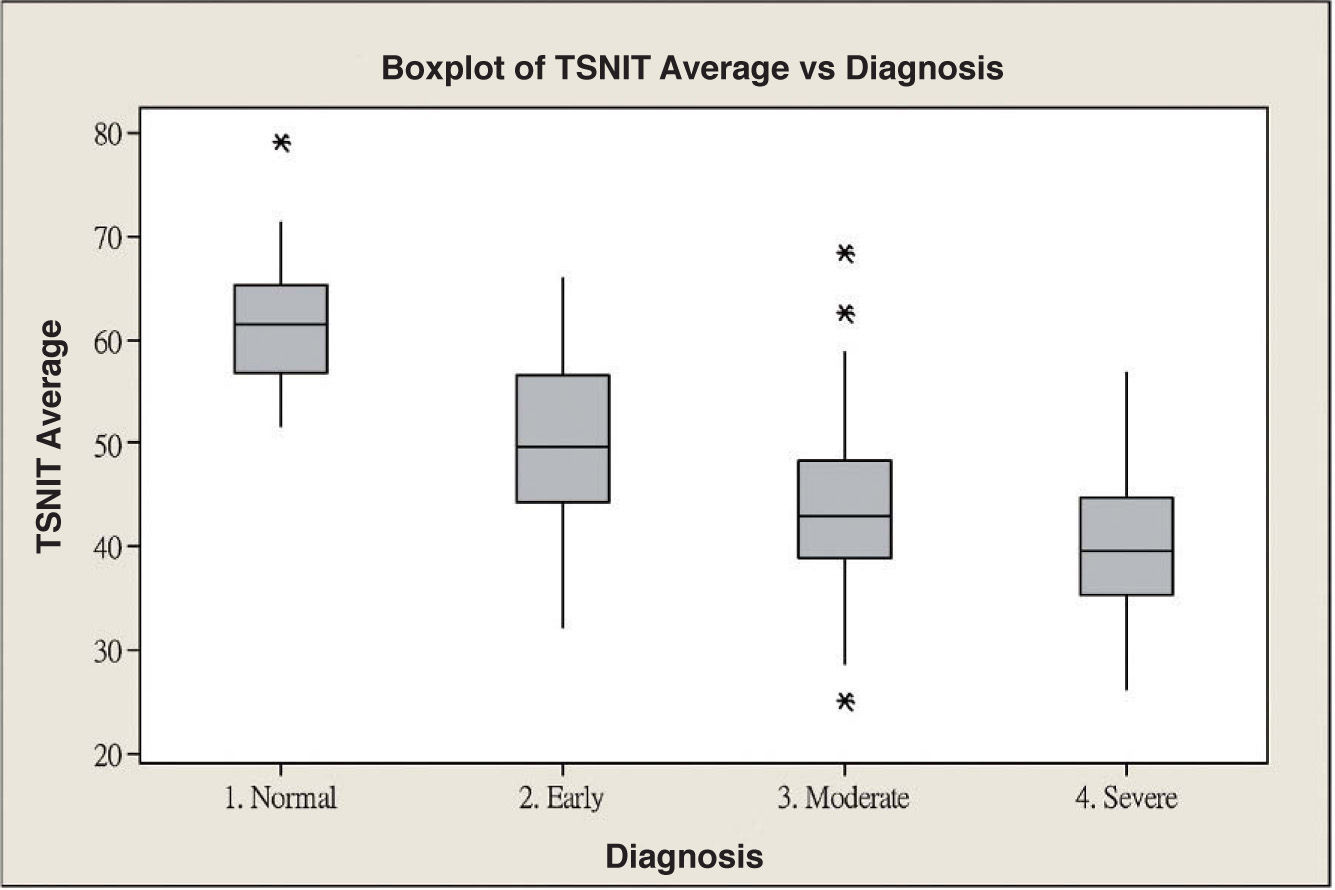
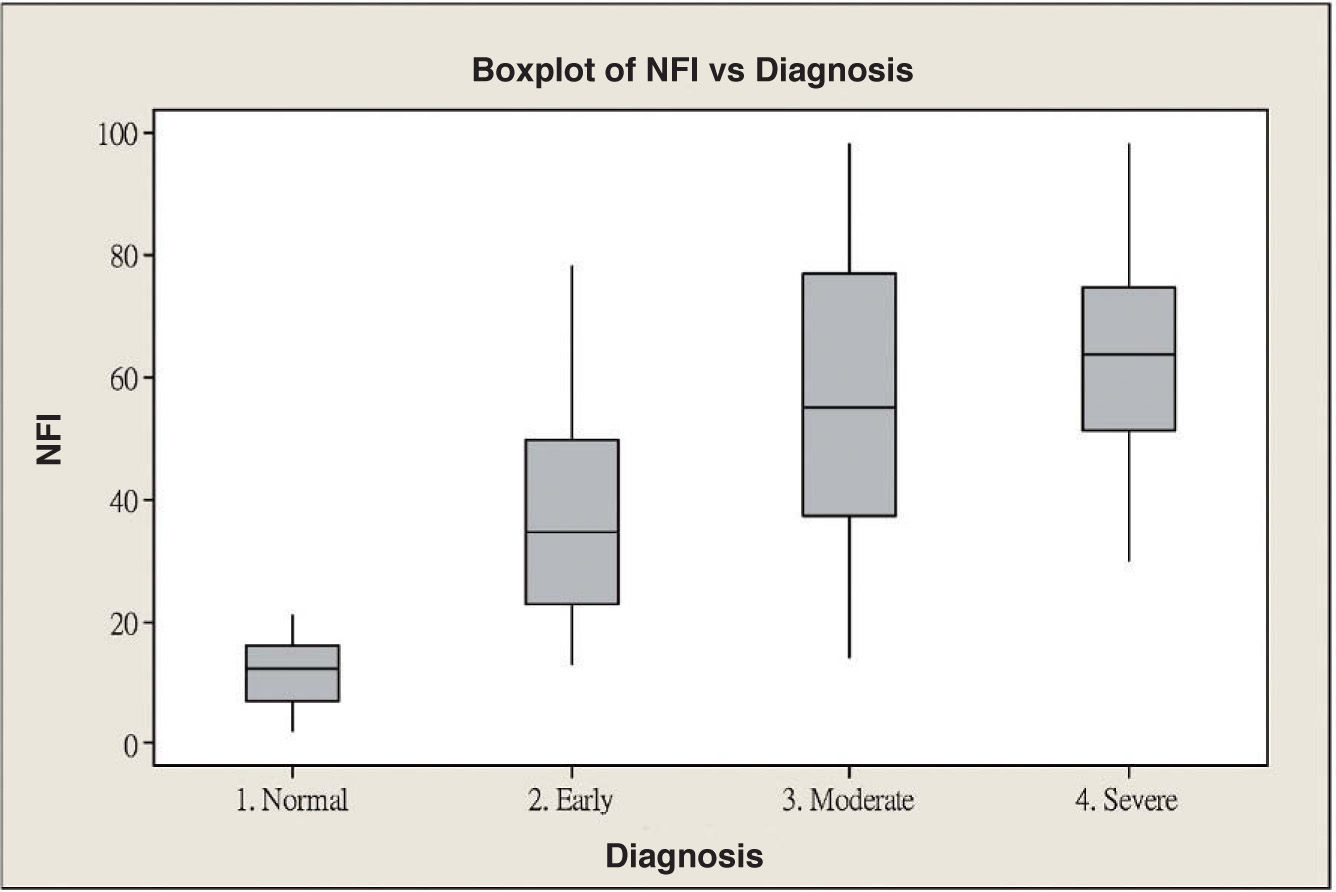
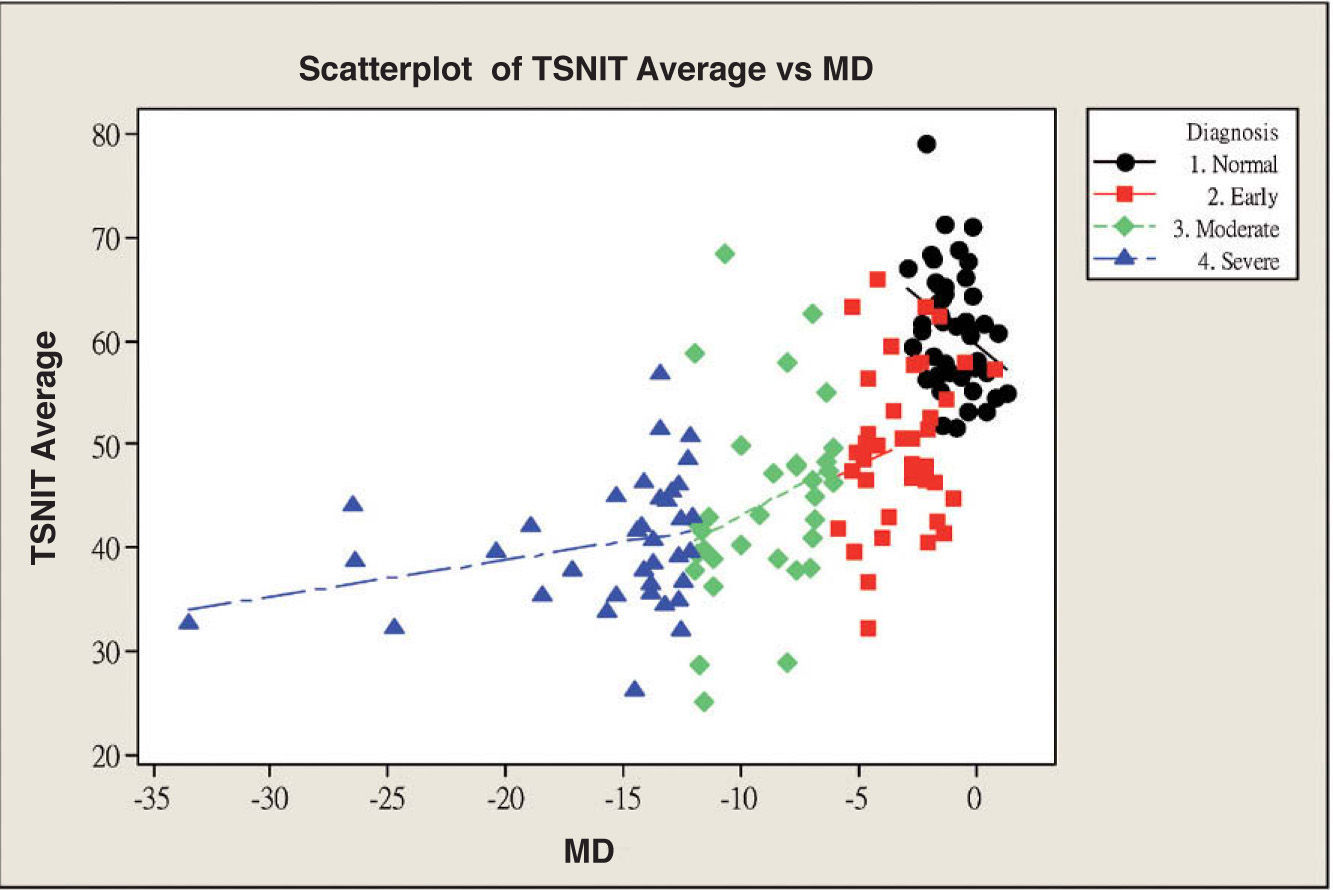
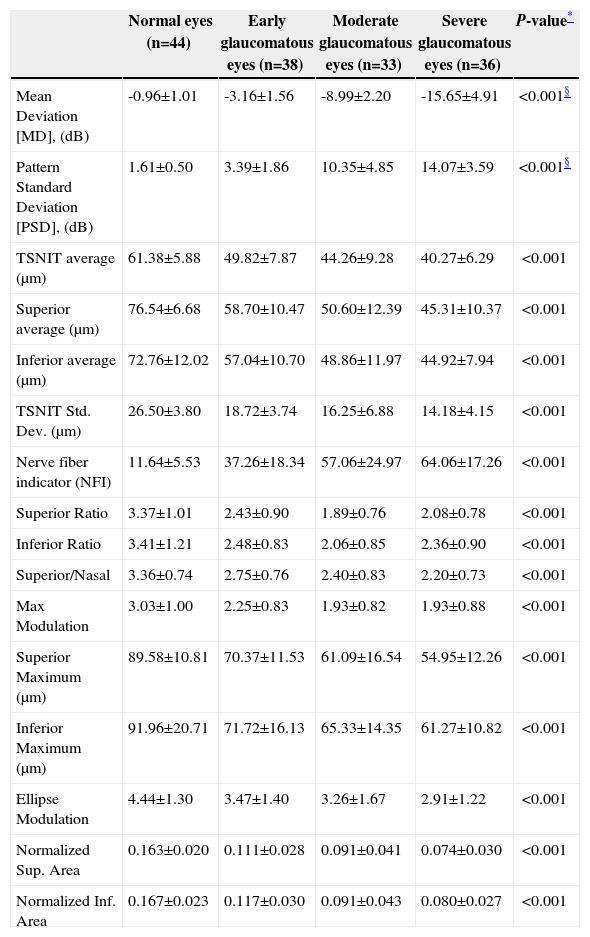
ResultsScanning Laser Polarimetry MeasurementsTable 1 shows the results of the scanning laser polarimetry (SLP) measurements performed on each group. Forty-four normal eyes (mean refractive error: -2.4±1.6 diopters) and 107 glaucomatous eyes (mean refractive error: -2.7±1.4 diopters) in different stages of glaucoma were included in the study. The mean age was 46.8±8.65 years for the control group and 55.8±16.5 years for the glaucoma group. There is no statistically significant difference in terms of refractive error between the normal and the glaucoma groups. The average MD of visual field was -0.96±1.01 dB in the control group and -9.15±6.13 dB in the glaucoma group. The average PSD of visual field was 1.61±0.50 dB in the control group and 9.13±5.75 dB in the glaucoma group. There were significant differences in terms of age, MD and PSD between the two groups. For the glaucoma group, 38 eyes showed early glaucomatous visual field defects (mean MD: -3.16±1.56 dB), 33 eyes had moderate ones (mean MD: -8.99±2.20 dB) and 36 eyes showed severe ones (-15.65±4.91 dB). There is a significant difference in MD between the normal group and each glaucoma subgroup. Regarding the resulting GDx VCC parameters, there was a significant difference between the various groups for each parameter under consideration. Specifically, the TSNIT average for the control eyes and for those eyes within the early, moderate, and severe glaucoma subgroups was 61.38±5.88 μm, 49.82±7.87 μm, 44.26±9.28 μm, and 40.27±6.29 μm, respectively. The box plots for TSNIT average (in μm) showed a considerable overlap between several glaucoma subgroups (Figure 1). The NFI is 11.64±5.53 for the control group, 37.26±18.34 for the early-glaucoma subgroup, 57.06±24.97 for the moderate-glaucoma subgroup and 64.06±17.26 for the severe-glaucoma subgroup. The box plots for NFI also showed a considerable overlap between several glaucoma subgroups (Figure 2).
RNFL thickness for the various groups, as measured with GDx VCC
| Normal eyes (n=44) | Early glaucomatous eyes (n=38) | Moderate glaucomatous eyes (n=33) | Severe glaucomatous eyes (n=36) | P-value* | |
| Mean Deviation [MD], (dB) | -0.96±1.01 | -3.16±1.56 | -8.99±2.20 | -15.65±4.91 | <0.001§ |
| Pattern Standard Deviation [PSD], (dB) | 1.61±0.50 | 3.39±1.86 | 10.35±4.85 | 14.07±3.59 | <0.001§ |
| TSNIT average (μm) | 61.38±5.88 | 49.82±7.87 | 44.26±9.28 | 40.27±6.29 | <0.001 |
| Superior average (μm) | 76.54±6.68 | 58.70±10.47 | 50.60±12.39 | 45.31±10.37 | <0.001 |
| Inferior average (μm) | 72.76±12.02 | 57.04±10.70 | 48.86±11.97 | 44.92±7.94 | <0.001 |
| TSNIT Std. Dev. (μm) | 26.50±3.80 | 18.72±3.74 | 16.25±6.88 | 14.18±4.15 | <0.001 |
| Nerve fiber indicator (NFI) | 11.64±5.53 | 37.26±18.34 | 57.06±24.97 | 64.06±17.26 | <0.001 |
| Superior Ratio | 3.37±1.01 | 2.43±0.90 | 1.89±0.76 | 2.08±0.78 | <0.001 |
| Inferior Ratio | 3.41±1.21 | 2.48±0.83 | 2.06±0.85 | 2.36±0.90 | <0.001 |
| Superior/Nasal | 3.36±0.74 | 2.75±0.76 | 2.40±0.83 | 2.20±0.73 | <0.001 |
| Max Modulation | 3.03±1.00 | 2.25±0.83 | 1.93±0.82 | 1.93±0.88 | <0.001 |
| Superior Maximum (μm) | 89.58±10.81 | 70.37±11.53 | 61.09±16.54 | 54.95±12.26 | <0.001 |
| Inferior Maximum (μm) | 91.96±20.71 | 71.72±16.13 | 65.33±14.35 | 61.27±10.82 | <0.001 |
| Ellipse Modulation | 4.44±1.30 | 3.47±1.40 | 3.26±1.67 | 2.91±1.22 | <0.001 |
| Normalized Sup. Area | 0.163±0.020 | 0.111±0.028 | 0.091±0.041 | 0.074±0.030 | <0.001 |
| Normalized Inf. Area | 0.167±0.023 | 0.117±0.030 | 0.091±0.043 | 0.080±0.027 | <0.001 |
Thickness in micrometers; mean ±SD


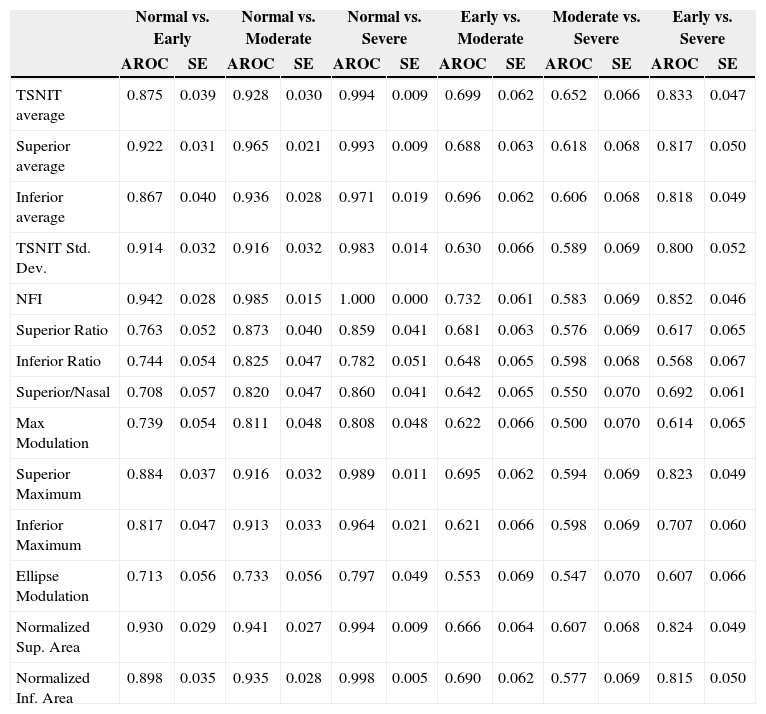
Table 2 and figure 3 report the diagnostic performance of GDx VCC for the different glaucoma subgroups. For normal vs. early-glaucoma eyes, the parameter showing the best AROC was the NFI (AROC=0.942). For normal vs. moderate-glaucoma eyes, the parameter with the best AROC was the NFI (0.985). For normal vs. severe-glaucoma eyes, the parameter showing the best AROC was the NFI (1.000). For early- vs. moderate-glaucoma eyes, the parameter with the best AROC was the NFI (0.732). On the other hand, for moderate- vs. severe-glaucoma eyes, the parameter having the best AROC was TSNIT average (0.652). For early- vs. severe-glaucoma eyes, the parameter with the best AROC was again the NFI (0.852).
AROC, sensitivity & specificity (SE) and best cut-off value of each parameter for differentiating normal eyes from glaucomatous eyes in different stages of the disease
| Normal vs. Early | Normal vs. Moderate | Normal vs. Severe | Early vs. Moderate | Moderate vs. Severe | Early vs. Severe | |||||||
| AROC | SE | AROC | SE | AROC | SE | AROC | SE | AROC | SE | AROC | SE | |
| TSNIT average | 0.875 | 0.039 | 0.928 | 0.030 | 0.994 | 0.009 | 0.699 | 0.062 | 0.652 | 0.066 | 0.833 | 0.047 |
| Superior average | 0.922 | 0.031 | 0.965 | 0.021 | 0.993 | 0.009 | 0.688 | 0.063 | 0.618 | 0.068 | 0.817 | 0.050 |
| Inferior average | 0.867 | 0.040 | 0.936 | 0.028 | 0.971 | 0.019 | 0.696 | 0.062 | 0.606 | 0.068 | 0.818 | 0.049 |
| TSNIT Std. Dev. | 0.914 | 0.032 | 0.916 | 0.032 | 0.983 | 0.014 | 0.630 | 0.066 | 0.589 | 0.069 | 0.800 | 0.052 |
| NFI | 0.942 | 0.028 | 0.985 | 0.015 | 1.000 | 0.000 | 0.732 | 0.061 | 0.583 | 0.069 | 0.852 | 0.046 |
| Superior Ratio | 0.763 | 0.052 | 0.873 | 0.040 | 0.859 | 0.041 | 0.681 | 0.063 | 0.576 | 0.069 | 0.617 | 0.065 |
| Inferior Ratio | 0.744 | 0.054 | 0.825 | 0.047 | 0.782 | 0.051 | 0.648 | 0.065 | 0.598 | 0.068 | 0.568 | 0.067 |
| Superior/Nasal | 0.708 | 0.057 | 0.820 | 0.047 | 0.860 | 0.041 | 0.642 | 0.065 | 0.550 | 0.070 | 0.692 | 0.061 |
| Max Modulation | 0.739 | 0.054 | 0.811 | 0.048 | 0.808 | 0.048 | 0.622 | 0.066 | 0.500 | 0.070 | 0.614 | 0.065 |
| Superior Maximum | 0.884 | 0.037 | 0.916 | 0.032 | 0.989 | 0.011 | 0.695 | 0.062 | 0.594 | 0.069 | 0.823 | 0.049 |
| Inferior Maximum | 0.817 | 0.047 | 0.913 | 0.033 | 0.964 | 0.021 | 0.621 | 0.066 | 0.598 | 0.069 | 0.707 | 0.060 |
| Ellipse Modulation | 0.713 | 0.056 | 0.733 | 0.056 | 0.797 | 0.049 | 0.553 | 0.069 | 0.547 | 0.070 | 0.607 | 0.066 |
| Normalized Sup. Area | 0.930 | 0.029 | 0.941 | 0.027 | 0.994 | 0.009 | 0.666 | 0.064 | 0.607 | 0.068 | 0.824 | 0.049 |
| Normalized Inf. Area | 0.898 | 0.035 | 0.935 | 0.028 | 0.998 | 0.005 | 0.690 | 0.062 | 0.577 | 0.069 | 0.815 | 0.050 |

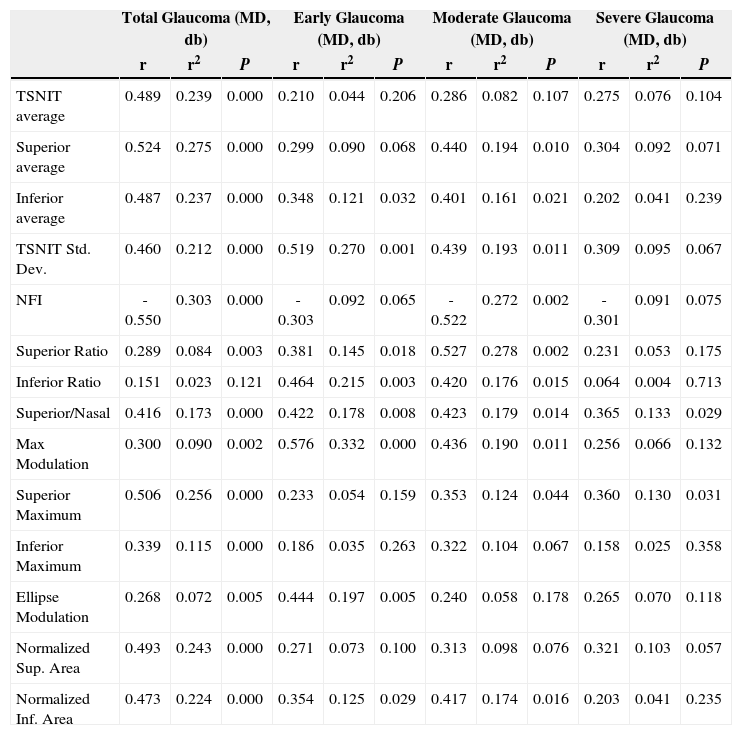
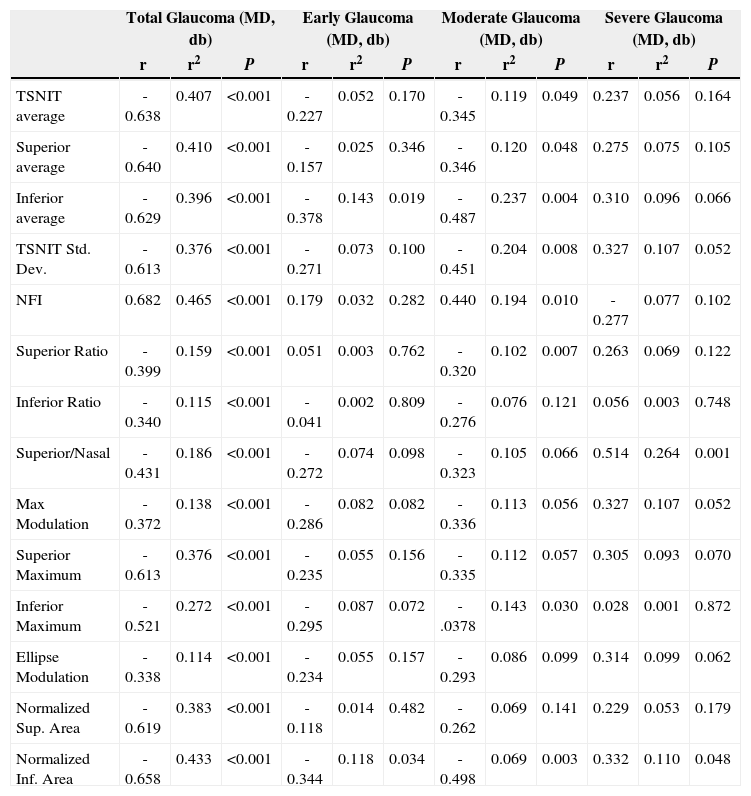
Table 3 and figure 4 show the correlation between MD and each GDx VCC-related parameter for each particular glaucoma group. There is a statistically significant correlation between each of the abovementioned parameters and MD, except for the “inferior ratio”. (P<0.001) table 4 shows the correlation between the PSD values and each GDx VCC-related parameter in the glaucoma group. There is a statistically significant correlation between each of the abovementioned parameters and PSD for each glaucoma subgroup as well as for the glaucoma group as a whole. (P<0.001)
Correlation of the mean deviation (MD) of visual field with the various parameters obtained by means of GDx VCC, for the glaucoma group
| Total Glaucoma (MD, db) | Early Glaucoma (MD, db) | Moderate Glaucoma (MD, db) | Severe Glaucoma (MD, db) | |||||||||
| r | r2 | P | r | r2 | P | r | r2 | P | r | r2 | P | |
| TSNIT average | 0.489 | 0.239 | 0.000 | 0.210 | 0.044 | 0.206 | 0.286 | 0.082 | 0.107 | 0.275 | 0.076 | 0.104 |
| Superior average | 0.524 | 0.275 | 0.000 | 0.299 | 0.090 | 0.068 | 0.440 | 0.194 | 0.010 | 0.304 | 0.092 | 0.071 |
| Inferior average | 0.487 | 0.237 | 0.000 | 0.348 | 0.121 | 0.032 | 0.401 | 0.161 | 0.021 | 0.202 | 0.041 | 0.239 |
| TSNIT Std. Dev. | 0.460 | 0.212 | 0.000 | 0.519 | 0.270 | 0.001 | 0.439 | 0.193 | 0.011 | 0.309 | 0.095 | 0.067 |
| NFI | -0.550 | 0.303 | 0.000 | -0.303 | 0.092 | 0.065 | -0.522 | 0.272 | 0.002 | -0.301 | 0.091 | 0.075 |
| Superior Ratio | 0.289 | 0.084 | 0.003 | 0.381 | 0.145 | 0.018 | 0.527 | 0.278 | 0.002 | 0.231 | 0.053 | 0.175 |
| Inferior Ratio | 0.151 | 0.023 | 0.121 | 0.464 | 0.215 | 0.003 | 0.420 | 0.176 | 0.015 | 0.064 | 0.004 | 0.713 |
| Superior/Nasal | 0.416 | 0.173 | 0.000 | 0.422 | 0.178 | 0.008 | 0.423 | 0.179 | 0.014 | 0.365 | 0.133 | 0.029 |
| Max Modulation | 0.300 | 0.090 | 0.002 | 0.576 | 0.332 | 0.000 | 0.436 | 0.190 | 0.011 | 0.256 | 0.066 | 0.132 |
| Superior Maximum | 0.506 | 0.256 | 0.000 | 0.233 | 0.054 | 0.159 | 0.353 | 0.124 | 0.044 | 0.360 | 0.130 | 0.031 |
| Inferior Maximum | 0.339 | 0.115 | 0.000 | 0.186 | 0.035 | 0.263 | 0.322 | 0.104 | 0.067 | 0.158 | 0.025 | 0.358 |
| Ellipse Modulation | 0.268 | 0.072 | 0.005 | 0.444 | 0.197 | 0.005 | 0.240 | 0.058 | 0.178 | 0.265 | 0.070 | 0.118 |
| Normalized Sup. Area | 0.493 | 0.243 | 0.000 | 0.271 | 0.073 | 0.100 | 0.313 | 0.098 | 0.076 | 0.321 | 0.103 | 0.057 |
| Normalized Inf. Area | 0.473 | 0.224 | 0.000 | 0.354 | 0.125 | 0.029 | 0.417 | 0.174 | 0.016 | 0.203 | 0.041 | 0.235 |

Correlation of PSD with the various parameters obtained by means of GDx VCC, for the glaucoma group
| Total Glaucoma (MD, db) | Early Glaucoma (MD, db) | Moderate Glaucoma (MD, db) | Severe Glaucoma (MD, db) | |||||||||
| r | r2 | P | r | r2 | P | r | r2 | P | r | r2 | P | |
| TSNIT average | -0.638 | 0.407 | <0.001 | -0.227 | 0.052 | 0.170 | -0.345 | 0.119 | 0.049 | 0.237 | 0.056 | 0.164 |
| Superior average | -0.640 | 0.410 | <0.001 | -0.157 | 0.025 | 0.346 | -0.346 | 0.120 | 0.048 | 0.275 | 0.075 | 0.105 |
| Inferior average | -0.629 | 0.396 | <0.001 | -0.378 | 0.143 | 0.019 | -0.487 | 0.237 | 0.004 | 0.310 | 0.096 | 0.066 |
| TSNIT Std. Dev. | -0.613 | 0.376 | <0.001 | -0.271 | 0.073 | 0.100 | -0.451 | 0.204 | 0.008 | 0.327 | 0.107 | 0.052 |
| NFI | 0.682 | 0.465 | <0.001 | 0.179 | 0.032 | 0.282 | 0.440 | 0.194 | 0.010 | -0.277 | 0.077 | 0.102 |
| Superior Ratio | -0.399 | 0.159 | <0.001 | 0.051 | 0.003 | 0.762 | -0.320 | 0.102 | 0.007 | 0.263 | 0.069 | 0.122 |
| Inferior Ratio | -0.340 | 0.115 | <0.001 | -0.041 | 0.002 | 0.809 | -0.276 | 0.076 | 0.121 | 0.056 | 0.003 | 0.748 |
| Superior/Nasal | -0.431 | 0.186 | <0.001 | -0.272 | 0.074 | 0.098 | -0.323 | 0.105 | 0.066 | 0.514 | 0.264 | 0.001 |
| Max Modulation | -0.372 | 0.138 | <0.001 | -0.286 | 0.082 | 0.082 | -0.336 | 0.113 | 0.056 | 0.327 | 0.107 | 0.052 |
| Superior Maximum | -0.613 | 0.376 | <0.001 | -0.235 | 0.055 | 0.156 | -0.335 | 0.112 | 0.057 | 0.305 | 0.093 | 0.070 |
| Inferior Maximum | -0.521 | 0.272 | <0.001 | -0.295 | 0.087 | 0.072 | -.0378 | 0.143 | 0.030 | 0.028 | 0.001 | 0.872 |
| Ellipse Modulation | -0.338 | 0.114 | <0.001 | -0.234 | 0.055 | 0.157 | -0.293 | 0.086 | 0.099 | 0.314 | 0.099 | 0.062 |
| Normalized Sup. Area | -0.619 | 0.383 | <0.001 | -0.118 | 0.014 | 0.482 | -0.262 | 0.069 | 0.141 | 0.229 | 0.053 | 0.179 |
| Normalized Inf. Area | -0.658 | 0.433 | <0.001 | -0.344 | 0.118 | 0.034 | -0.498 | 0.069 | 0.003 | 0.332 | 0.110 | 0.048 |
The important clinical challenges in glaucoma are the detection of early glaucomatous damage and its progression over time.9 Therefore, it is also important to know the severity of glaucoma. As far as the classification of glaucoma severity is concerned, several methods have been proposed to grade glaucoma on the basis of visual field changes detected on standard white-on-white perimetry.8,9 However, the objective evaluation of peripapillary RNFL and of optic disc changes constitutes an important part of glaucoma diagnosis, especially when standard automated perimetry is not a feasible option, as it is the case in the late stages of the disease.16 SLP provides a good and objective method for RNFL thickness evaluation. It has been demonstrated that SLP-measured RNFL thickness shows a good correlation with histological measurements.17,18 It is found to be highly reproducible in a long-term test-retest situation, supporting the use of this instrument for longitudinal assessment of the RNFL.19 In addition, low-to-high myopia is not related to clinically relevant variations of the parameters measured with SLP, as assessed with the GDx VCC device.20 Several studies have evaluated the diagnostic capability of GDx VCC in glaucoma detection, especially at its early stages.4-7 Weinreb et al.4 showed that the parameter with the largest AROC (0.83) for discriminating 54 glaucomatous eyes (average MD: 6.49 dB) from 40 healthy eyes was the average RNFL thickness within the superior quadrant. In the study conducted by Resu and Lemij,5 they reported that the sensitivity of the NFI to identify glaucoma patients with mild, moderate, and severe damage was equal to 83.8%, 92.9%, and 90.1%, respectively, at the cutoff level of ≥40. Besides, they also reported that GDx VCC had a high discriminating power for the detection of primary open-angle glaucoma (POAG) (average MD: 8.45 dB). Medeiros et al.6 reported that the GDx VCC-related index showing the highest AROC for glaucoma detection (average MD: –4.87 dB) was NFI (AROC, 0.91). Da Pozzo et al.7 reported that GDx VCC showed a moderate-to-good discriminating ability. Our previous report also showed that GDx VCC shows only a moderate ability to distinguish normal eyes from eyes with early glaucoma (mean MD: -3.32±2.20 dB).21 In the present study, we report that NFI is still the best discriminating parameter when it comes to differentiating normal from glaucomatous eyes in the various stages of the disease (AROC values: normal vs. early, 0.942; normal vs. moderate, 0.985, normal vs. severe glaucoma, 1.000). In addition, we also evaluated the discriminating power of GDx VCC for the various glaucoma subgroups. The results are similar to the ones to those found in previous studies, even though different populations and different visual field severities had been chosen. Many studies had previously reported that the NFI is the best parameter to differentiate glaucomatous eyes from normal ones.4-7,21 The NFI is based on an advanced form of neural network analysis. It has been trained on a large sample of representative healthy and glaucomatous eyes and utilizes information from the entire RNFL thickness map to optimize the discrimination between the two groups. The output of the NFI is a single value that ranges from 1 to 100 and which indicates the overall integrity of the RNFL. It is scientifically reasonable to think that the NFI might always be the best parameter for differentiating glaucomatous eyes from normal ones. Besides, the results of the present work are in good agreement with previous reports, where GDx VCC demonstrated excellent diagnostic capability in glaucoma in a purely Chinese population, even in its early stages. However, when it comes to differentiating the severity of glaucoma, GDx VCC demonstrates only a moderate ability. (early vs. moderate glaucoma: the best AROC (0.732) was obtained for the NFI; for moderate vs. severe, the best AROC (0.652) was for the TSNIT average; for early vs. severe, the best AROC (0.852) was obtained for the NFI). This might be due to a considerable overlap between the RNFL-thickness plots (as measured with GDx VCC) corresponding to the various glaucoma subgroups. Consequently, we believe that the functional results of each glaucoma patient should be analyzed jointly with the structural results yielded by GDx VCC when evaluating the severity of their glaucoma.
Some studies have evaluated the correlations between visual field indices and structural parameters.22-27 Weinreb et al.22 reported a significant correlation between retardation ratio and both the full-field and the sensitivity sectors using the Nerve Fiber Analyzer (NFA) I. Tjon-Fo-Sang and Lemij23 found a significant correlation between retardation and visual field sensitivity. Chen et al.24 reported a significant correlation between visual field index and maximum modulation, regional modulation, and ratio using NFA II. Know et al.25 found that the number had the highest correlation with Humphrey's mean deviation, using GDx. Reus and Lemij26 found a significant correlation between GDx VCC retardation and the sensitivity as measured with the HFA. Iester et al.27 reported that some of the GDx VCC indices significantly correlated with visual field indices in glaucomatous patients (NFI, r=-0.35; superior average, r=0.28; TSNIT average, r=-0.24; inferior average, r=0.21). Our current result is in agreement with previous reports that stated that, in glaucomatous eyes, there was a significant correlation between a visual field index (MD and PSD) and some of the parameters yielded by GDx VCC. However, an interesting result that was pointed out is that the correlation seemed to be stronger for the moderateglaucoma subgroup, compared to that obtained for the severe- or the early-glaucoma subgroup. The most plausible reason for this is that the linear model for the structural/functional relationship is really stronger in the moderate stages of glaucoma. In a previous study by Leung et al's,28 they reported that the structure/function relationship was better explained with nonlinear models (logarithmic regression) when visual sensitivity's MD (dB) was plotted against RNFL thickness. Another possible reason might originate from cataract changes, which might influence the result of visual field performance. However, we should not draw any conclusion from this tentative result, since we will address this topic (the functional/structural relationship in the different stages of glaucoma) in the near future. However, we agree that it is mandatory to follow-up the RNFL thickness of each glaucoma patient using GDx VCC in addition to undertaking conventional perimetry, when it comes to evaluating the disease progression of glaucoma.
There were some limitations in our study. First, a major limitation was the selection bias in the subject inclusion/exclusion process. Although we chose our glaucoma group according to an experienced doctor, it is inevitable that these patients were identified on the basis of particular patterns of structural and functional abnormalities that met preconceived notions, which may result in a biased outcome of the comparison.13 For example, inclusion criteria for normal subjects may be “superb” normal under the strict criteria for normal (normal optic nerve appearance and visual field defect).
Moreover, there were similar problems during the image selection process.29 To increase accuracy and to obtain goodquality scans, we excluded those patients for whom only poor images were obtained, especially the atypical birefringence patterns. However, it is inevitable to suffer from an image selection bias in the context of a technical imaging study.29 Therefore, these could overestimate the diagnostic accuracy of GDx VCC. Second, the difference in age between the normal healthy subjects and the glaucoma patients may also constitute a source of bias that may increase the discriminating power of GDx VCC for glaucoma detection in this study. Third, the sample size is not large enough. Further studies with larger sample sizes are necessary to calculate likelihood ratios that can be used more confidently in the clinical practice when it comes to interpreting GDx VCC data in glaucoma management. However, our tentative result can serve as a basis for further longitudinal and large-scale studies, especially those that would evaluate the long-term RNFL thickness changes in glaucomatous eyes in the different stages of the disease.
In conclusion, RNFL thickness measured by GDx VCC may serve as a useful tool to accurately and more objectively distinguish normal from glaucomatous eyes. It may help to differentiate various severity levels of glaucoma within the Taiwan Chinese population. The NFI was the best discriminating parameter when it comes to differentiating normal from glaucomatous eyes.
The authors would like to thank for the financial support obtained under contract No. NSC-97-2628-E-167-001-MY3 & DMR-96-120.
Financial disclosure: The authors indicate no financial conflict of interest. Presented in part at: World Ophthalmology Congress, June 2008, Hong Kong, China.
This study was supported by a grant from National-Science-Council of Taiwan under contract No. NSC 97-2628-E-167-001 -MY3 and from China Medical University Hospital under contract No. DMR-96-120.


