

It is generally accepted that the presence of bilateral corneal asymmetry correlates with certain corneal diseases and may be the evidence of corneal abnormalities. A method is shown for the quantification of bilateral corneal asymmetry in 5 different corneal categories, making use of corneal topography data.
MethodsCorneal topographies (Tomey TMS, Nagoya, Japan) from both eyes of 74 subjects were reviewed by a cornea researcher who classified them according to their characteristics into five groups (normal, astigmatic, contact-lens-induced corneal warpage, keratoconus suspects and bilateral keratoconus). Topography maps were chosen from the clinical records of the LSU Eye Center. The axial-diopters tables for each pair of corneas were extracted from their corresponding corneal topographies. The resulting data from the corneal topographies of each eye were interpolated at regular intervals using a polar-coordinate system. Subsequently, the differences between corresponding points of the axial-diopters tables of the fellow eyes were calculated. The cumulative percentage of the resulting values was calculated and its distribution was plotted for each pair of eyes. A linear regression was fitted to the data of each cumulative distribution plot. Finally, the slope of the linear regression of each pair of eyes was calculated and statistical analysis was performed in order to determine whether or not there is a statistically significant difference between the slopes of each group of corneal categories.
ResultsA statistically significant difference (P<0.05) was found between keratoconus and all the other groups. Furthermore, we found a statistically significant difference between the normal and the contact-lens-induced warpage group as well as between the normal and the keratoconus-suspects group (P<0.05). There was no statistically significant difference (P>0.05) neither between the normal and the astigmatism group, nor between the astigmatism and the contact-lens-induced corneal warpage group, nor between the astigmatism and the keratoconus-suspects group, nor between the keratoconus-suspects group and the contact-lens-induced corneal warpage one.
ConclusionsA method to quantify bilateral corneal asymmetry in different corneal entities was devised. The lowest degree of bilateral asymmetry was observed in the normal group, while the highest degree of bilateral asymmetry was obtained for the keratoconus group. The contact-lens-induced warpage group and the keratoconus-suspects group presented with intermediate bilateral asymmetry.
La teoría de que la presencia de una asimetría corneal bilateral está correlacionada con ciertas enfermedades corneales y puede ser la prueba de la existencia de anormalidades corneales está ampliamente aceptada. Se presenta aquí un método para cuantificar el grado de asimetría corneal bilateral para 5 tipos (categorías) de corneas, utilizando para ello datos de topografía corneal.
MétodosUn investigador especialista en córnea analizó las topografías corneales (Tomey TMS, Nagoya, Japón) realizadas anteriormente en los dos ojos de 74 sujetos. A continuación, clasificó a dichos sujetos de acuerdo a sus características corneales, asignándole a cada uno una de estas cinco categorías normal (NOR), astigmatismo (AST), moldeamiento corneal producido por lentes de contacto (MCLC), sospecha de queratocono (SQ) y queratocono bilateral (QB). Los mapas de topografía corneal se cogieron de los historiales médicos de la clínica oftalmológica LSU Eye Center. Para cada par de córneas se elaboró la tabla de dioptrías axiales a partir de los datos de las topografías corneales correspondientes. Para ello, los datos de las topografías corneales se interpolaron a intervalos regulares (tanto en la dirección radial como en la angular) utilizando un sistema de coordenadas polares. A continuación, se calculó la diferencia (de potencia, en dioptrías) entre cada par de puntos análogos, a partir de las tablas de dioptrías axiales correspondientes a los dos ojos de un mismo sujeto. Para cada par de ojos, se calculó el porcentaje acumulado de los valores resultantes y se representó gráficamente esta distribución. Para cada curva de porcentajes acumulados, se realizó un ajuste lineal de los datos. Finalmente, para cada par de ojos se calculó la pendiente de esta recta de ajuste. Luego se llevó a cabo un análisis estadístico de todos los datos para determinar si existe una diferencia estadísticamente significativa entre los distintos tipos (categorías) de córnea en lo que respecta al valor de dicha pendiente.
ResultadosSe halló una diferencia significativa (P<0,05) entre QB y el resto de las categorías. Además, hallamos una diferencia estadísticamente significativa entre el grupo NOR y el MCLC, así como entre el grupo NOR y el SQ (P<0,05). No se obtuvo una diferencia estadísticamente significativa (P>0,05) ni entre el grupo NOR y el AST, ni entre el grupo AST y el MCLC, ni entre el grupo AST y el SQ, ni entre el grupo SQ y el MCLC.
ConclusionesSe ha ideado un método para cuantificar el grado de asimetría corneal bilateral para diversos tipos de córneas. El menor grado de asimetría bilateral se observó para el grupo NOR, mientras que el grado más elevado de asimetría bilateral se obtuvo para el grupo QB. Para los grupos MCLC y SQ se encontró un grado intermedio de asimetría bilateral.
It is generally accepted that humans, as well as all other vertebrates, are characterized by external bilateral symmetry along the dorsoventral (DV) and anteroposterior (AP) axes. This is achieved through a variety of mechanisms, including a complex network of signaling mechanisms and gene regulation.1 On the other hand, it should be mentioned that internally, humans present significant bilateral asymmetry, which is mainly revealed in the development of the internal organs such as the heart and the digestive tract. This process begins early in vertebrate development and it includes the encoding of several regulatory proteins and cell signaling molecules.2
In the human cornea, it has been demonstrated that the corneal topographies of the same subject present a high degree of mirror-image symmetry (enantiomorphism).3 In the same study it was demonstrated that although the corneal topographies of the same subject were similar, there was a variation in the morphology across the corneal topographies of different subjects. According to another study involving 50,995 subjects, the corneal astigmatic axis of the subjects presented mirror-image symmetry rather than direct symmetry.4 This mirror-image symmetry of the astigmatic axis was observed for all types of astigmatism (i.e., cylinder power ≤1D, cylinder power >1D, with-the-rule astigmatism, against–the-rule astigmatism and oblique astigmatism).
Another significant category of corneal morphology is contact-lens-induced corneal warpage. It has been documented that it can be caused by all types of contact lenses, although it is believed to be more commonly caused by rigid contact lenses and, especially, those made of PMMA (polymethylmethacrylate).5 The corneal topography in contact-lens-induced corneal warpage shows specific characteristics, like a central irregular pattern, flattening underneath the decentered lens and peripheral steepening opposite the resting position of the decentered lens. The latter characteristic can cause a high degree of morphological resemblance to the topographic characteristics of early keratoconus, especially when the contact lens rides on the upper part of the cornea.6,7 Research aiming to differentiate between contact-lens-induced corneal warpage and keratoconus topographies may prove beneficial in clinical screening.8,9
Corneal dystrophies often cause a significant distortion of the cornea. The most characteristic disease causing prominent corneal paramorphosis is keratoconus. Keratoconus is a non-inflammatory disease in which the cornea progressively develops a conical shape because of thinning and protrusion. It usually appears in the early adulthood, causing with visual blurring and distortion. The most common finding during eye examination is highly irregular corneal astigmatism.10,11 Early keratoconus may be present without any noticeable clinical signs and, for this reason, corneal topography has proven to be very useful in the detection of corneal irregularities.12 Keratoconus is, in most cases, a bilateral disease, where one eye is initially affected and the other eye follows after a certain period of time.13 It has also been suggested that all the unilateral cases of keratoconus, if they are observed for a sufficient amount of time, will eventually progress to a bilateral disease.14
It has been shown that there is a significant asymmetry between fellow eyes in bilateral keratoconus. In one study the asymmetry was assessed using 13 unilateral quantitative topographical indices as well as the best spectacle-corrected visual acuity (BSCVA). The results of the comparison of these parameters between fellow eyes revealed a significant degree of asymmetry in the bilateral cases of keratoconus.15 Another extended study that was based not on topographical indices but on the measurement of several clinical parameters concluded that keratoconus is an asymmetrical bilateral disease, both in an absolute scale and also in comparison with normal, myopic contact-lens-wearing patients.16
Regarding the detection of keratoconus suspects and early keratoconus cases, corneal topography has proven to be very useful; in this context, many quantitative indices17-21 that contribute to the detection of corneal irregularities have been developed. There are relevant indices that assess unilateral corneal asymmetry, such as the I-S value, which estimates the asymmetry between the inferior and the superior parts of the cornea,17 the Surface-Asymmetry Index (SAI),18 which expresses the differences in corneal power between corresponding points of the same cornea that are 180° apart on the photokeratoscope mires, and the Opposite-Surface Index (OSI),19 which represents the greatest difference in average power between opposite sectors of a given cornea.
It is a common notion that while normal corneas show a high degree of bilateral symmetry, the same thing does not happen for corneas that develop irregularities, either as a result of a disease like keratoconus or because of a mechanical distortion like that caused by contact-lens-induced corneal warpage. The aim of this study was to assess bilateral asymmetry in five distinct categories of corneal topographies (normal, astigmatic, contact-lens-induced corneal warpage, keratoconus suspects, bilateral keratoconus) and to develop a quantitative method to express the degree of asymmetry.
MethodsThis is a retrospective study of the clinical data from 148 eyes (74 subjects). All data were collected from de-identified historical patient data of the Louisiana State University (LSU) Eye Center clinic (Baton Rouge, LA, USA). Corneal topography was originally collected once the patient had read and signed an informed consent. The corneal topographies of both eyes of 74 subjects where reviewed by a corneal topography researcher with the fixed Smolek/Klyce scale (30 to 67.5 in 1.5-steps). The classification was done according to the topographic characteristics of each pair of eyes; each subject was assigned to one of the five groups of interest: the 1st group included 14 subjects that were classified as normal (NRM, Cylinder power ≤1.5 D), the 2nd group included 11 subjects that presented astigmatism (AST, Cylinder power >1.5 D), the 3rd group included 15 subjects that had contactlens-induced corneal warpage (CLW), the 4th included 20 subjects that were classified as keratoconus suspects (KCS) and the 5th included 14 subjects that suffered from bilateral keratoconus (KC).
The AST group included 9 subjects that had with-the-rule astigmatism and 2 subjects that had against-the-rule astigmatism. The KCS included subjects whose corneal topography exhibited an area of local steepening or irregular astigmatism (asymmetric bow-tie pattern) either in one or in both eyes. The KCS group also included subjects that didn’t have the afore-mentioned features but that exhibited, nevertheless, a type of bilateral asymmetry in their corneal topographies that didn’t follow a characteristic pattern. The KC included 14 subjects. For 7 of them, both eyes’ keratoconus were in the same stage of the disease (the mild stage for 2 subjects, and the moderate stage for 5 subjects). Regarding the other 7 subjects, the stage of the disease was different between fellow eyes: one eye had mild-stage keratoconus whereas the other had moderate-stage keratoconus.
The corneal topographies of the left eyes of all the subjects were flipped about their vertical axis with the help of a customized computer program that transposes left-eye data to right-eye data and vice-versa. This was done in order to correct for the naturally occurring mirror-image symmetry of fellow corneas. By means of the CTView program (Sarver and Associates, Inc, Carbondale, Il., USA) the corneal topography of each eye was sampled, based on a regular polar-coordinate system. The measurement points were distributed along radii, traced at 10˚-intervals. The distance between adjacent points on the same radius was 0.5 mm, with a maximum distance from the center of 5 mm. These data were presented on an axial diopters table with polar coordinates. The table consisted of 11 columns and 37 rows, with a total of 407 cells. The columns represented the point's radial location (at steps of 0.5 mm on each radius, from 0 to 5 mm) and the rows its angular location (at steps of 10° for each mire, from 0° to 360°).
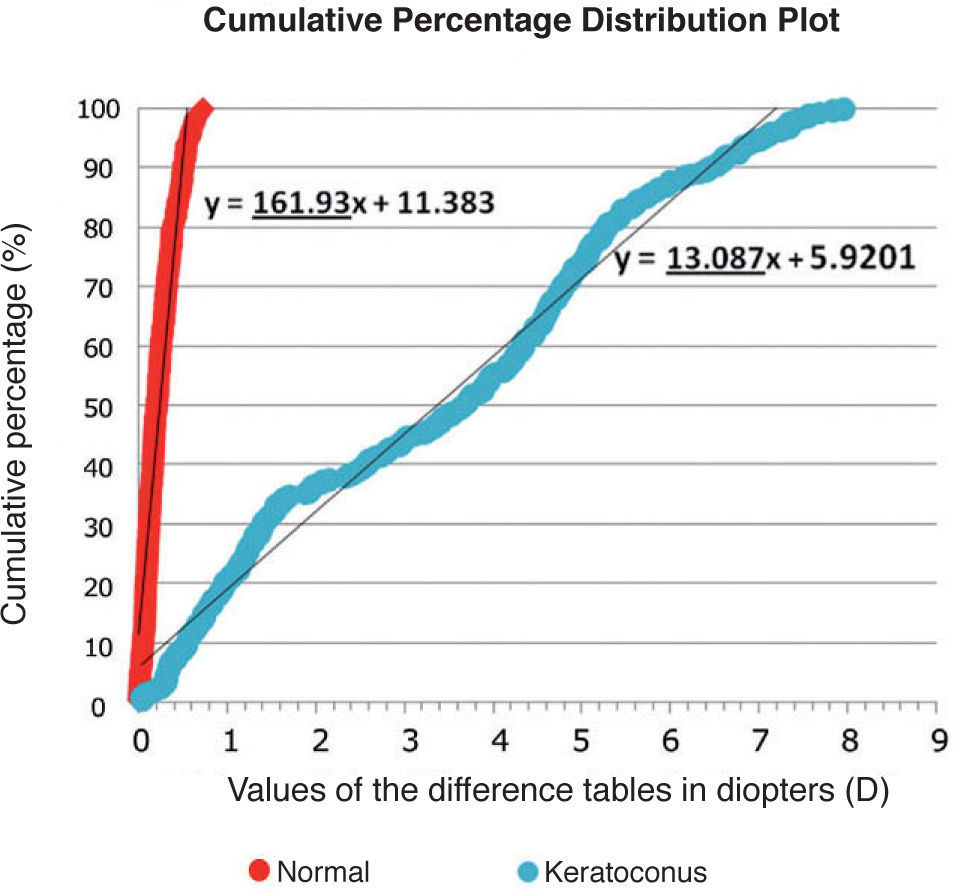
The axial diopters table for the right eye and the flipped left eye of each subject were exported to a Microsoft Excel spreadsheet and the differences between the values of corresponding points in the right and left corneas were then calculated, leading to the so-called “difference table”. When in one of the tables (left-eye or right-eye) one of the values was missing, the corresponding cell in the final difference table was left blank. Subsequently, for each pair of eyes, the cell values of the final difference table were inputted into a statistical program (Minitab, State College, PA, USA). In Minitab the columns of each difference table were stacked to only one column and the cumulative percents of the values of that column were calculated. As a result, the final data for each pair of eyes consisted of two columns: the first one contained the values (in diopters) of the final difference table in ascending order and the second column the corresponding cumulative percent value, which is calculated as the percentage of data points whose difference values are equal or below the value of that particular sample data point. For instance, a value of 100% means that all the other sampled points had a difference value below this one. The cumulative-percent values ranged from 0% to 100%. Finally, a linear regression model was applied to the data of these two columns, using the first column (values of the difference table) as x-values and the second column (cumulative percents) as y-values. The graph in figure 1 shows the cumulative percentage distribution plots (with the corresponding linear-regression fit) for two pairs of eyes, one belonging to the normal group and the other to the keratoconus group. The equation of each linear regression is also shown; the slope of each of these lines is underlined.

Cumulative percentage distribution plots, representing the data in the “difference table”, for two particular pairs of eyes. One eye belongs to the normal group and the other to the keratoconus group. The linear regression fit for each dataset is shown, together with the equation of this regression line; the value of the slope is underlined. It becomes obvious that the value of the slope for the pair of normal eyes is much higher than that for the pair of eyes that suffer from keratoconus.
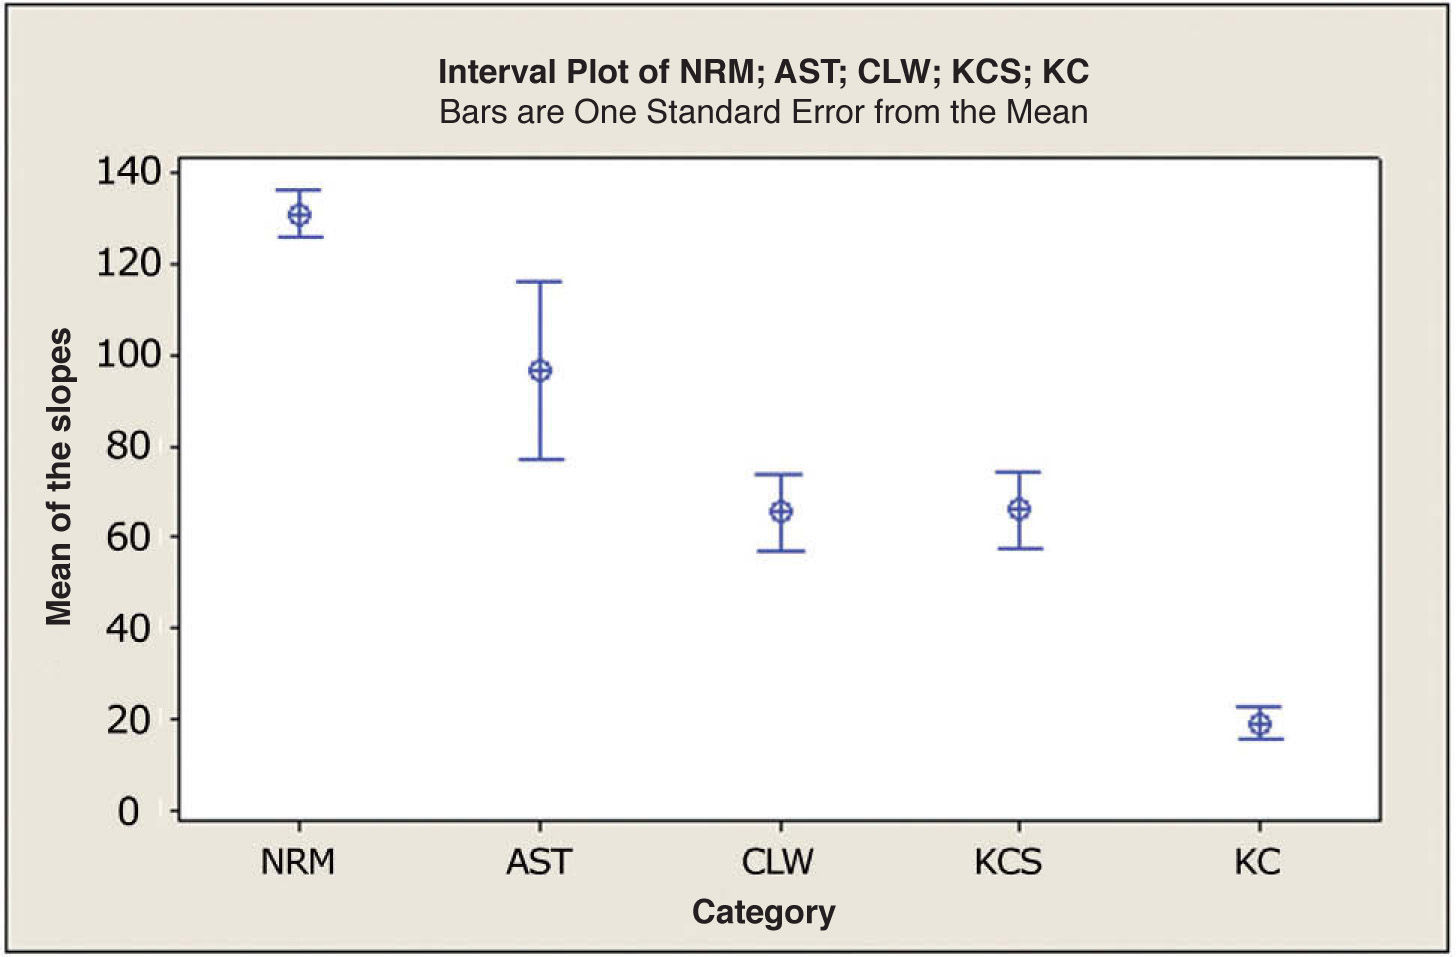
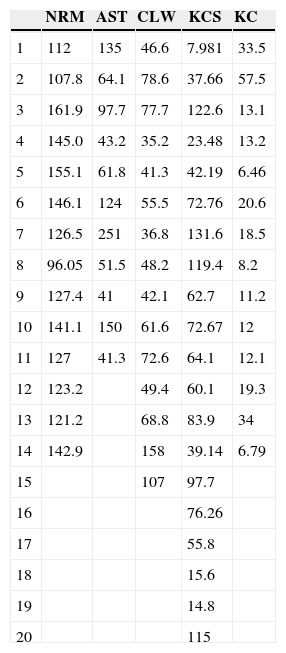
In fact, the slope of each regression line was used as a measure of the dispersion of the values of the final difference table for each pair of eyes. Higher slope values corresponded to low data dispersion, which was more prominent in the normal group, while lower slope values corresponded to a higher data dispersion, a pattern that was more typical of the keratoconus group. Table 1 shows the slope of the regression lines for each one of the 74 pairs of eyes under study, classified into the 5 different groups (NRM, AST, CLW, KCS and KC). Figure 2 is the interval plot, depicting, for each of the 5 eye categories under analysis, the slope's mean value together with standard error bars.
Individual slopes of the regression line (corresponding to the cumulative percentage distribution plot) for each pair of eyes, grouped by each of the five different corneal categories
| NRM | AST | CLW | KCS | KC | |
| 1 | 112 | 135 | 46.6 | 7.981 | 33.5 |
| 2 | 107.8 | 64.1 | 78.6 | 37.66 | 57.5 |
| 3 | 161.9 | 97.7 | 77.7 | 122.6 | 13.1 |
| 4 | 145.0 | 43.2 | 35.2 | 23.48 | 13.2 |
| 5 | 155.1 | 61.8 | 41.3 | 42.19 | 6.46 |
| 6 | 146.1 | 124 | 55.5 | 72.76 | 20.6 |
| 7 | 126.5 | 251 | 36.8 | 131.6 | 18.5 |
| 8 | 96.05 | 51.5 | 48.2 | 119.4 | 8.2 |
| 9 | 127.4 | 41 | 42.1 | 62.7 | 11.2 |
| 10 | 141.1 | 150 | 61.6 | 72.67 | 12 |
| 11 | 127 | 41.3 | 72.6 | 64.1 | 12.1 |
| 12 | 123.2 | 49.4 | 60.1 | 19.3 | |
| 13 | 121.2 | 68.8 | 83.9 | 34 | |
| 14 | 142.9 | 158 | 39.14 | 6.79 | |
| 15 | 107 | 97.7 | |||
| 16 | 76.26 | ||||
| 17 | 55.8 | ||||
| 18 | 15.6 | ||||
| 19 | 14.8 | ||||
| 20 | 115 |
![Interval plot, which represents, for each of the 5 corneal categories under study [normal (NRM), astigmatism (AST), contact-lens-induced corneal warpage (CLW), keratoconus suspects (KCS), bilateral keratoconus (KC)] the mean value of the slope of the cumulative percent plots. The interval bars represent one standard error (SE) above and below the mean.](https://static.elsevier.es/multimedia/18884296/0000000200000004/v2_201308272051/S1888429609700457/v2_201308272051/en/main.assets/gr2.jpeg?xkr=ue/ImdikoIMrsJoerZ+w93meMsSv3kCFu9ka1kgzl/xrK32s3f4YRcWD6Dd7AXarqtwg7Vp+prLKdeAag0uVLShF/sK63v+xILTPoIFXMCnhn0hBn8JFyVqMGZ/1LnV7w09BW7WeNSbcsFZqAkXfBDoy5eHJ9KkdeRPhW5m5Ssj6r3651ktzNfDA9+1VNtWyzRnE0u+ETzQ4yu8jbL56cCVxP3X0n+LccfWtMj8bvEUXvR4tpm9bLk+Y+8WvzoZ9HUaZhzf3tQAlYt/E6fKDtLv7qWH7Xm4oeH/F3xkd+1U= "Interval plot, which represents, for each of the 5 corneal categories under study [normal (NRM), astigmatism (AST), contact-lens-induced corneal warpage (CLW), keratoconus suspects (KCS), bilateral keratoconus (KC)] the mean value of the slope of the cumulative percent plots. The interval bars represent one standard error (SE) above and below the mean.")
Interval plot, which represents, for each of the 5 corneal categories under study [normal (NRM), astigmatism (AST), contact-lens-induced corneal warpage (CLW), keratoconus suspects (KCS), bilateral keratoconus (KC)] the mean value of the slope of the cumulative percent plots. The interval bars represent one standard error (SE) above and below the mean.
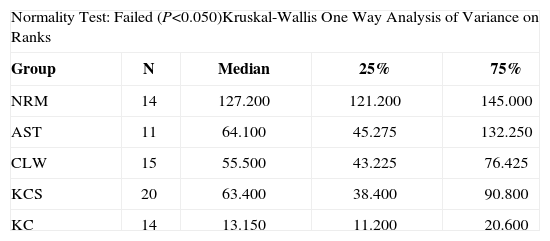
Finally, a One-Way Analysis of Variance test was conducted with SigmaStat (Systat Software, Inc, San Jose, CA, USA) in order to determine whether there was a statistically significant difference between the values of the slope across the different corneal categories. The normality test failed and a Kruskal-Wallis One-Way Analysis of Variance on Ranks test was performed. The analysis was concluded with Dunn's method for all pairwise multiple comparison of the 5 groups.
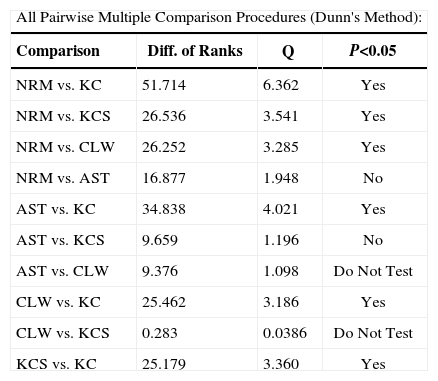
ResultsAccording to the Kruskal-Wallis test statistic value (H=42.238 with 4 degrees of freedom) there was a statistically significant difference between the 5 groups (P<0.001). The results of the test are shown in table 2. Dunn's test was performed to determine which pairwise comparisons on ranks were statistically different. The Q test statistic value that was estimated according to Dunn's method for each pair of groups indicated that there was a statistically significant difference (P<0.05) between KC and each of the other groups. Additionally, a statistically significant difference (P<0.05) was found between the NRM group and the KCS group as well as between the NRM and the CLW group. There was no statistically significant difference (P>0.05) between the NRM and the AST group or between the AST and the KCS group. It should be mentioned that, according to Dunn's method, a comparison between the AST and the CLW warpage group or between the KCS and the CLW group was not performed because the test failed to detect a significant difference between the AST and the KCS groups. The results of Dunn's test are shown in table 3.
Results of the Kruskal-Wallis One-Way Analysis of Variance test. According to the H-test statistic value, there was a statistically significant difference between the 5 groups
| Normality Test: Failed (P<0.050)Kruskal-Wallis One Way Analysis of Variance on Ranks | ||||
| Group | N | Median | 25% | 75% |
| NRM | 14 | 127.200 | 121.200 | 145.000 |
| AST | 11 | 64.100 | 45.275 | 132.250 |
| CLW | 15 | 55.500 | 43.225 | 76.425 |
| KCS | 20 | 63.400 | 38.400 | 90.800 |
| KC | 14 | 13.150 | 11.200 | 20.600 |
H=42.238 with 4 degrees of freedom. (P=<0.001)
Results of the all pairwise multiple comparison procedures with Dunn's method. According to the resulting Q value of Dunn's test, a statistically significant difference was observed between keratoconus (KC) and all the other groups (P<0.05). Additionally, a statistically significant difference was found between the normal (NRM) and the keratoconus-suspects group (KCS), as well as between the normal (NRM) and the contact-lens-induced corneal warpage group (CLW)
| All Pairwise Multiple Comparison Procedures (Dunn's Method): | |||
| Comparison | Diff. of Ranks | Q | P<0.05 |
| NRM vs. KC | 51.714 | 6.362 | Yes |
| NRM vs. KCS | 26.536 | 3.541 | Yes |
| NRM vs. CLW | 26.252 | 3.285 | Yes |
| NRM vs. AST | 16.877 | 1.948 | No |
| AST vs. KC | 34.838 | 4.021 | Yes |
| AST vs. KCS | 9.659 | 1.196 | No |
| AST vs. CLW | 9.376 | 1.098 | Do Not Test |
| CLW vs. KC | 25.462 | 3.186 | Yes |
| CLW vs. KCS | 0.283 | 0.0386 | Do Not Test |
| KCS vs. KC | 25.179 | 3.360 | Yes |
In this study, a quantitative method was developed in order to assess the bilateral asymmetry for five different corneal categories, without making use of unilateral cornealtopography quantitative indices, which only describe the corneal characteristics of individual eyes.15,17-21 The comparison of fellow eyes was based only on the raw data that were extracted from the corneal topographies of each eye by means of the CTView application. The data for each eye were interpolated at regular intervals, according to a polar-coordinates system. For each pair of matching points (one for the left eye, another for the fellow right eye) having the same coordinates, the difference in axial diopters was calculated. The concept was that if there is a significant steepening (higher power) or flattening (lower power) in an area of one of the fellow eyes, then that would result in a larger diopter difference with respect to the matching point (i.e., that with the same coordinates) in the fellow eye.
The purpose of using raw data was to avoid devising a method based solely on proprietary indices. The current method can be used on any topography system.
The statistical analysis was based on the resulting table containing the differences between the data of fellow eyes. For each pair of eyes, the raw data of the difference table were tested with the Kolmogorov-Smirnov normality test, which failed for almost all pairs of eyes within all the groups. This suggested that the data for each pair of eyes did not follow a normal distribution and, as a result, it could not be described by means of the related statistical parameters such as the mean and the standard deviation. Another alternative could be the use of the median, which was rejected because it is not representative of the dispersion of the data. The interquartile range (75th percentile – 25th percentile) was also used but the results were not as significant as those obtained with the slope-analysis method. According to this latter method, the slope of the linear regression of the cumulative-percentage distribution plot describes the dispersion of all the data, for each pair of eyes. A high slope value means that the data show a small dispersion, which corresponds to a low degree of bilateral asymmetry, while lower values of the slope means that the data show a higher dispersion, which corresponds to a higher degree of bilateral asymmetry.
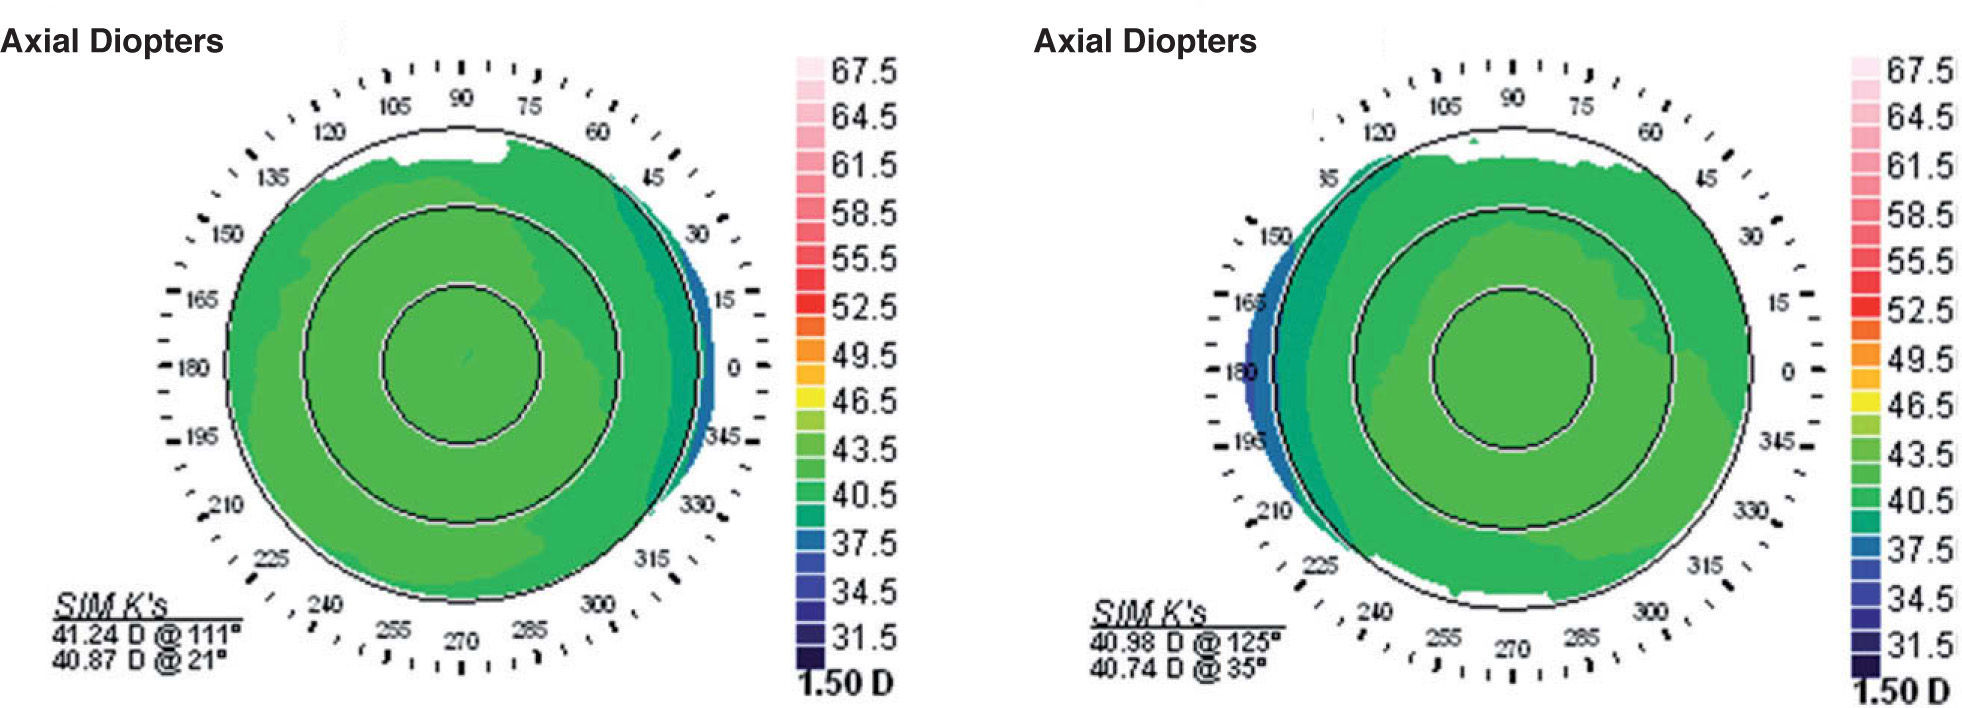
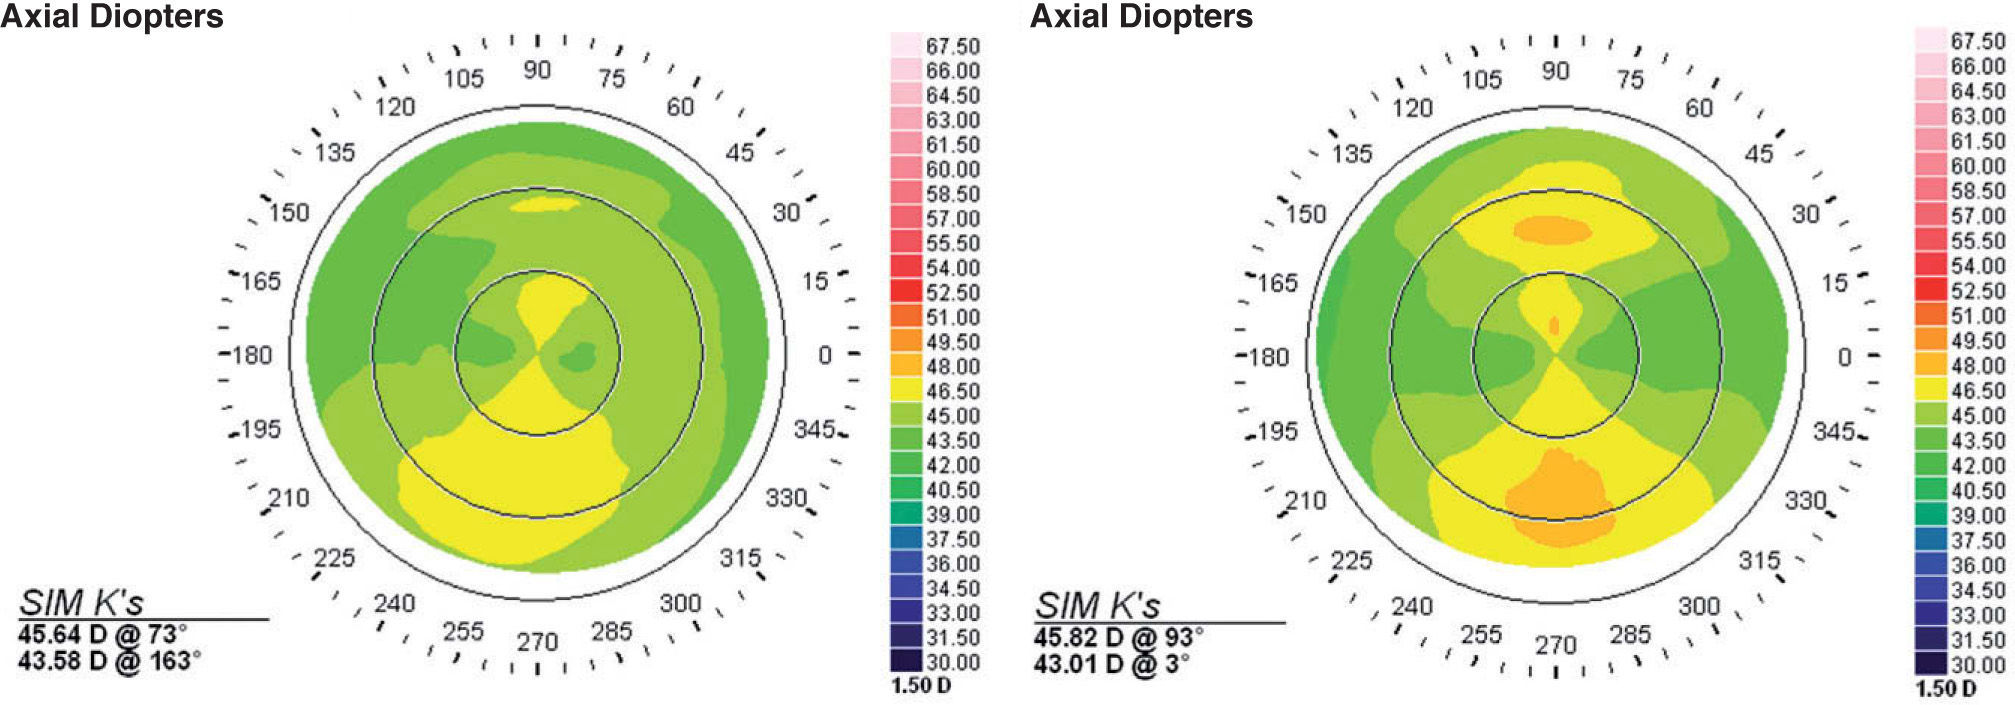
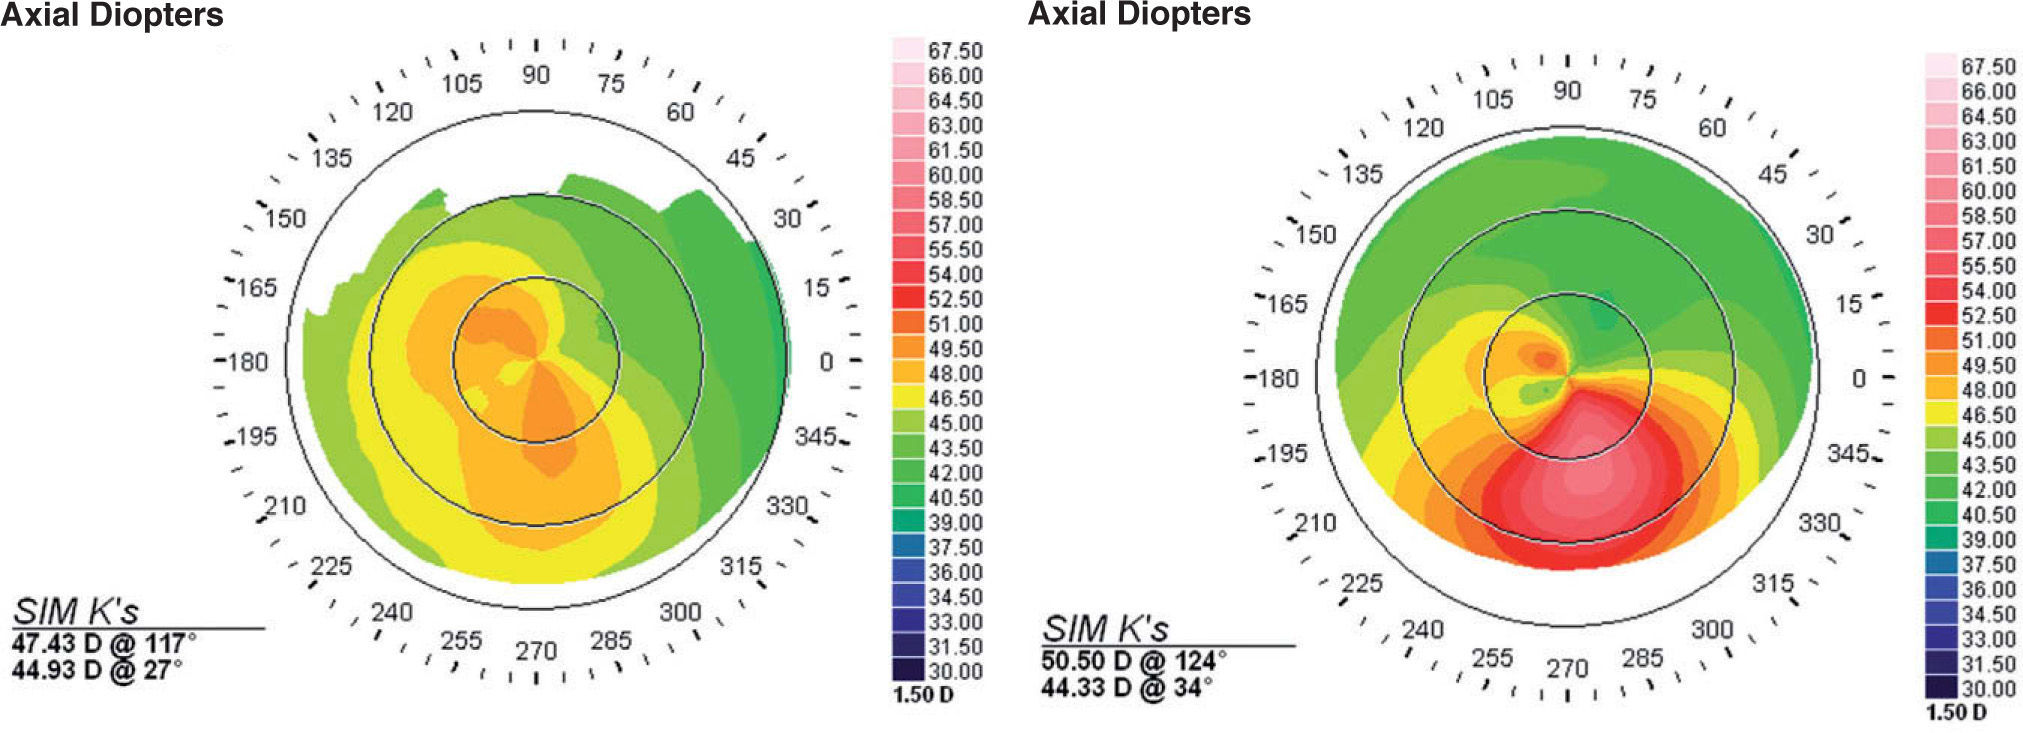
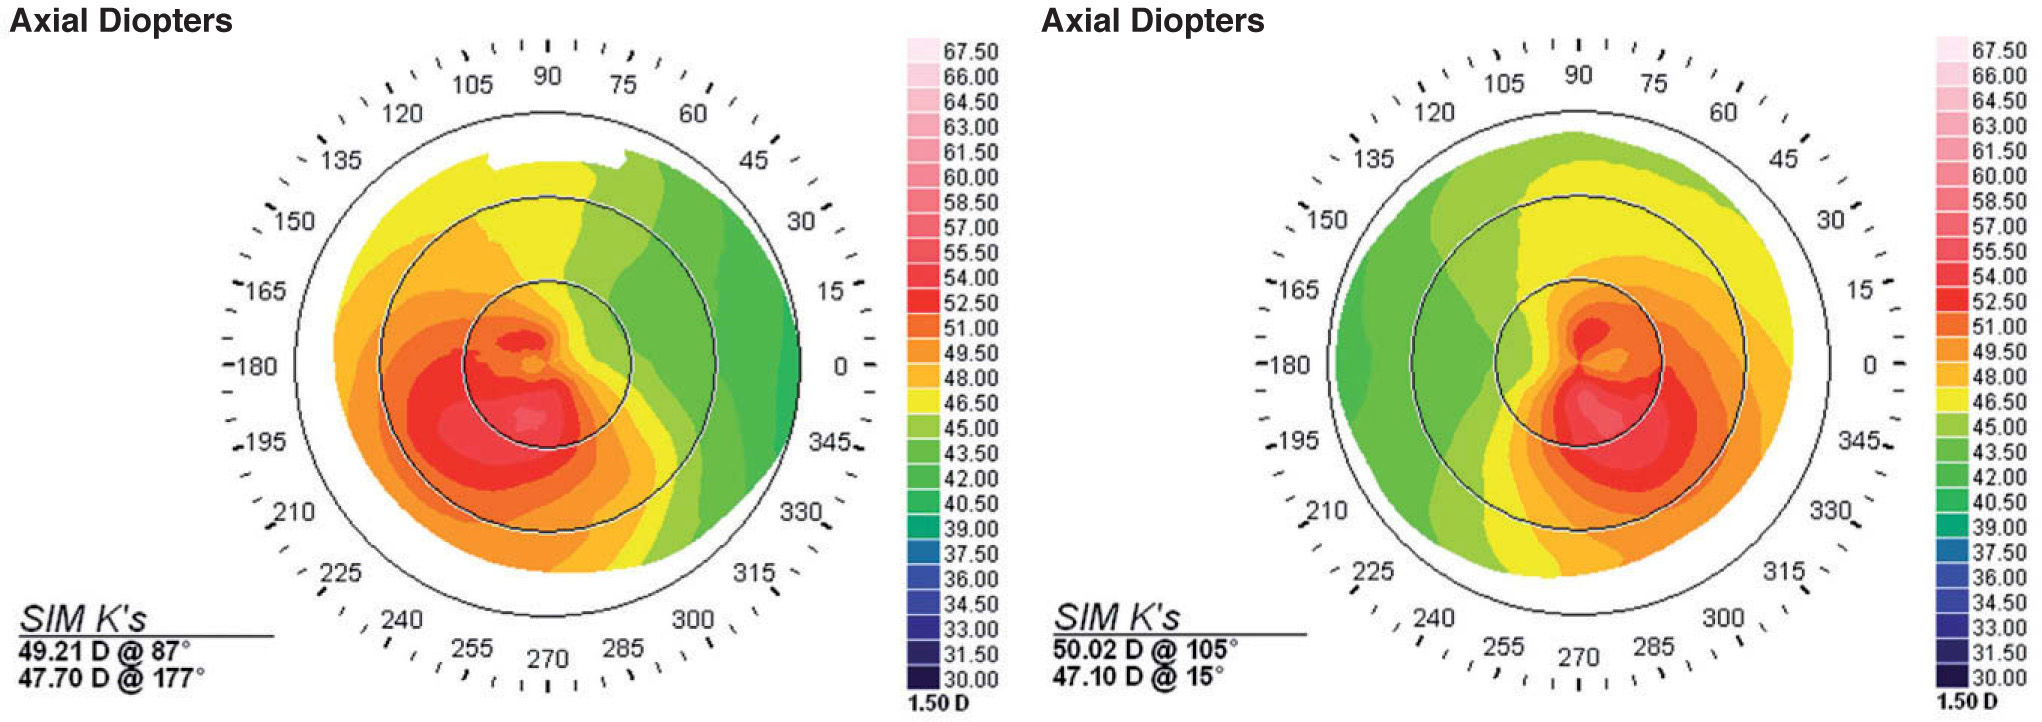
For all the subjects within the normal group, the resulting slope values were very high (>100). This was to be expected, as the mirror-image symmetry of fellow normal corneas has been demonstrated previously.3 A characteristic example of normal fellow corneas is shown in figure 3. The value of the slope for this example was 161.9. All the pairs of eyes within this category were characterized by visually apparent mirror-image symmetry, which also became evident during the analysis of the data. Conversely, the AST group had slopes that presented a significant variance, although the visually apparent mirror-image symmetry of the astigmatic axis was prominent for all the subjects within this group4. The variance of the resulting slope within this group may be attributed to wider range, in terms of morphology, of the corneal topographies of the fellow eyes, even though this is not readily noticed just by means of visual inspection. A characteristic example of corneal astigmatism is shown in figure 4. The value of the slope for this example was 61.8.

Corneal topographies of the two fellow eyes of a subject included in the normal group. The mirror-image symmetry between the two eyes becomes obvious. For the subjects in this group, the slope of the cumulative percent distribution curve reached high values; in this example, this slope was equal to 161.9.

Corneal topographies of the two fellow eyes of a subject included in the astigmatism group. Although the mirror-image symmetry between the two eyes is rather obvious, there are some small differences in the morphology of the topographies. These differences are also revealed in the data analysis, which showed variations in the values of the slope of the cumulative percent distribution plot. In this example, the value of the slope was equal to 61.8.
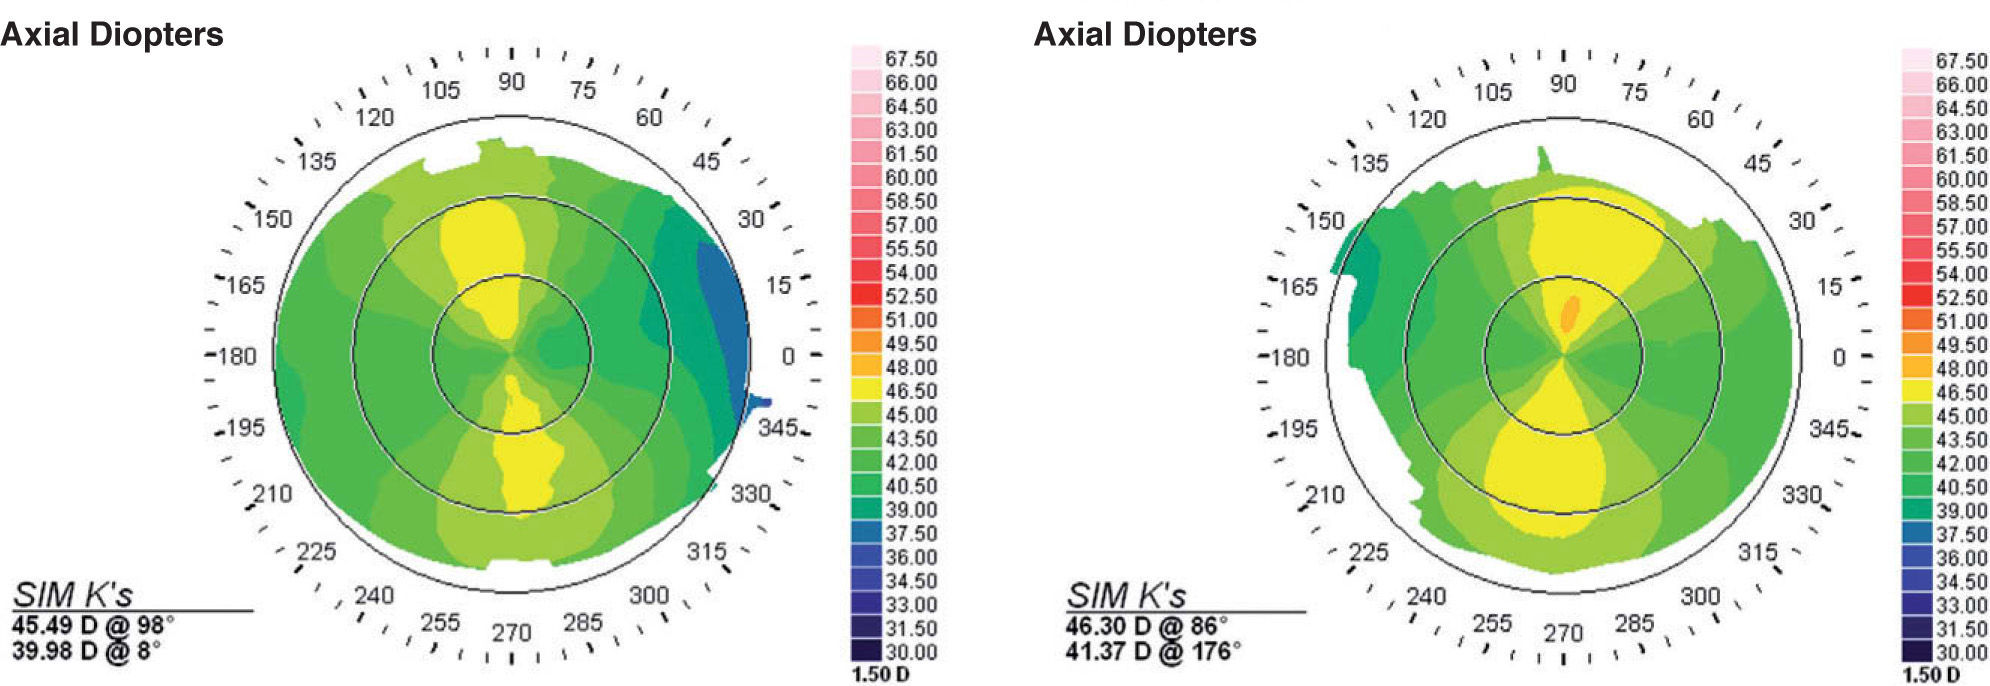
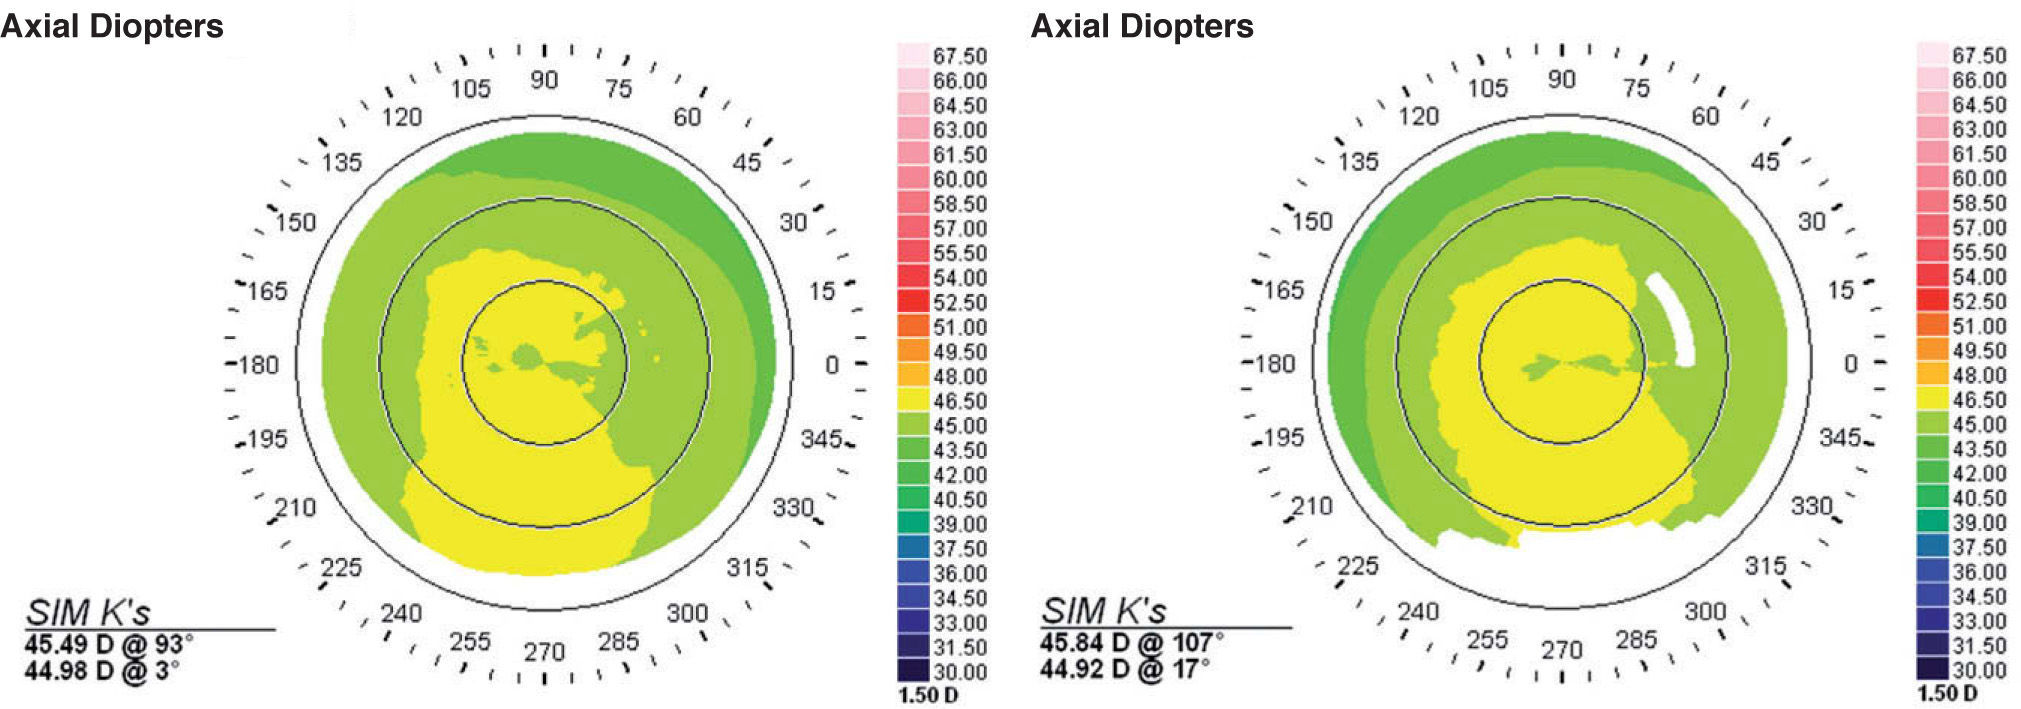
The results from the CLW group revealed a significant bilateral asymmetry. For 13 out of the 15 pairs of eyes within this group, the values of the slope were below 100, which were in agreement with the qualitative visual assessment of the corneal topographies, which already indicated a significant bilateral asymmetry. This suggests that the distortion of the cornea from contact lens usage causes, in most cases, a significant bilateral asymmetry. In figure 5, an example of bilateral asymmetry taken from this group is shown. The value of the slope, for this example, was 55.5. In this same group there were also two pairs of eyes that presented bilateral mirror-image symmetry. The value of the slope for these 2 pairs of eyes was above 100. The corneal topographies for one of these pairs of eyes, having a high value of slope (158), are shown in figure 6.

Corneal topographies of the two fellow eyes of a subject included in the contact-lens-induced corneal warpage group. There is a high degree of bilateral asymmetry, a feature that is also observed for 13 of the 15 pairs of eyes in this group. This was also revealed in the data analysis which, for the subjects in this group, produced low values of the slope of the cumulative percentage distribution plot. For this particular example, the value of the slope was equal to 55.5.

Corneal topographies of the two fellow eyes of a subject included in the contact-lens-induced corneal warpage group. This is one of the two pairs of eyes in this group that showed bilateral mirror-image symmetry. This also became evident in the data analysis: the cumulative percentage distribution plot for those 2 subjects had high slope values; in particular, for this example the slope was equal to 107.
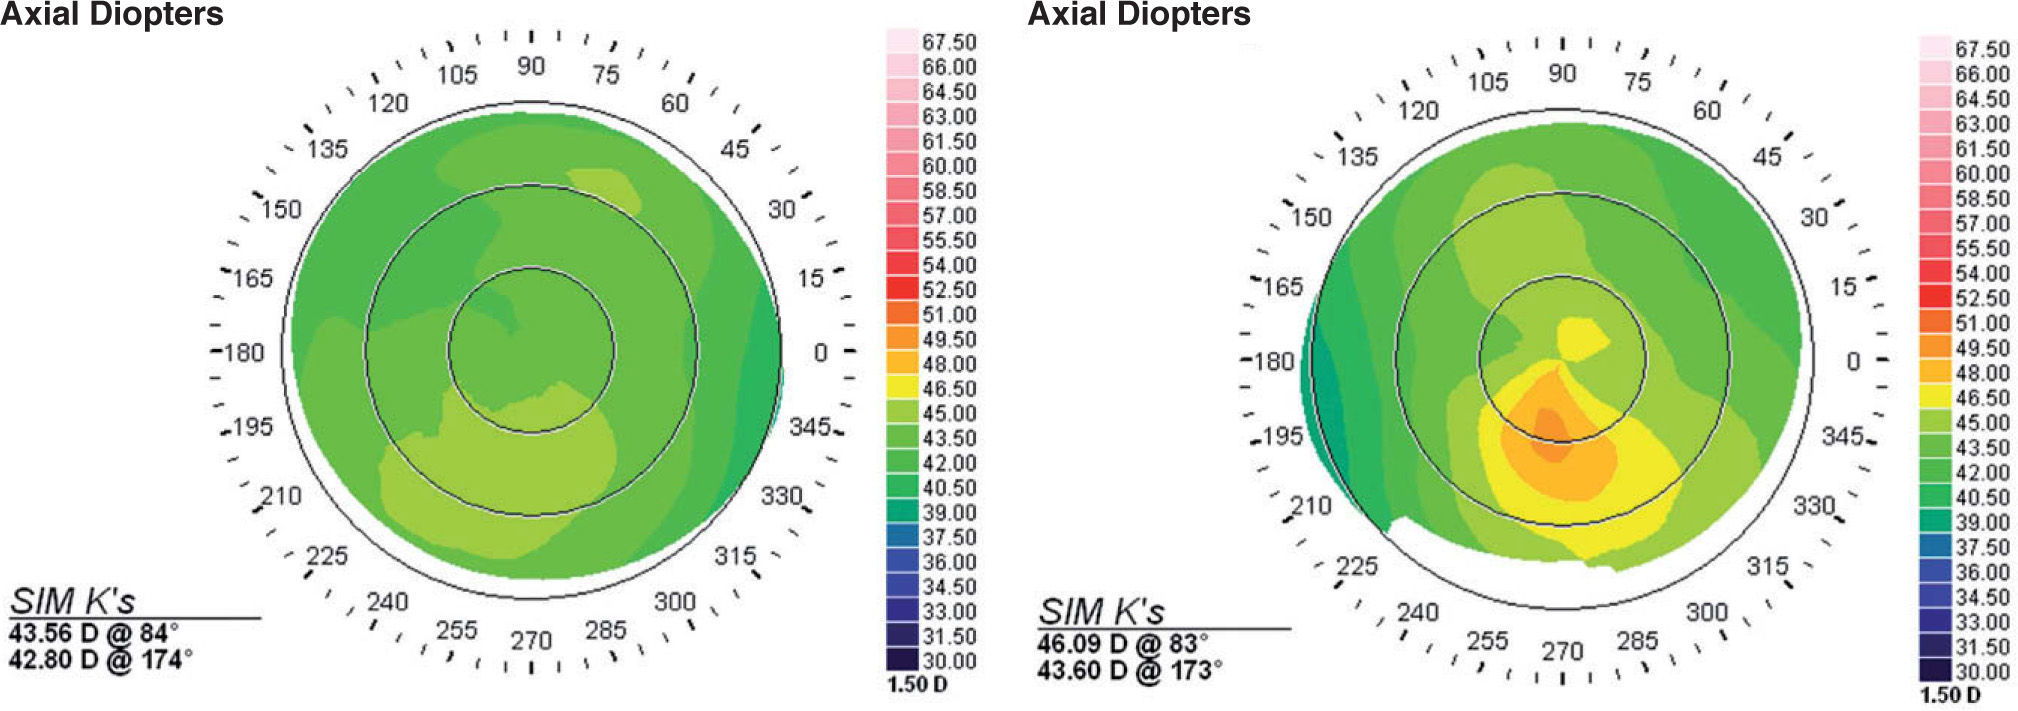
The KCS group also showed a moderately high variability in terms of slope of each pair of eyes, while the mean slope was low. Most subjects presented bilateral asymmetry and the slope, in most cases, did not exceed 100. A characteristic example of bilateral asymmetry in KCS is shown in figure 7; in this particular case, the slope was 23.48. There were some cases that, despite a visually apparent abnormal morphology in both eyes, the bilateral asymmetry turned out to be very low and, as a result, the corresponding slope value was high. An example of such a case is shown in figure 8; the slope in this case was 122.6.

Corneal topographies of the two fellow eyes of a subject included in the keratoconus-suspects group. There is a high degree of bilateral asymmetry, but there is also a high degree of unilateral asymmetry, especially in the left eye, which shows an inferior steepening; this is a characteristic pattern of keratoconus suspects. The data analysis of such cases revealed low values for the slope of the cumulative percentage distribution plot; in the present example, that slope was equal to 23.48.
 the degree of bilateral asymmetry is very low, as revealed by the data analysis carried out for such cases: the slope of the cumulative percentage distribution plot reaches high values; in particular, for the present example the slope value was equal to 122.6.")
Corneal topographies of the two fellow eyes of a subject included in the keratoconus-suspects group. Although there is a high degree of unilateral asymmetry in each eye (asymmetric bow-tie pattern) the degree of bilateral asymmetry is very low, as revealed by the data analysis carried out for such cases: the slope of the cumulative percentage distribution plot reaches high values; in particular, for the present example the slope value was equal to 122.6.
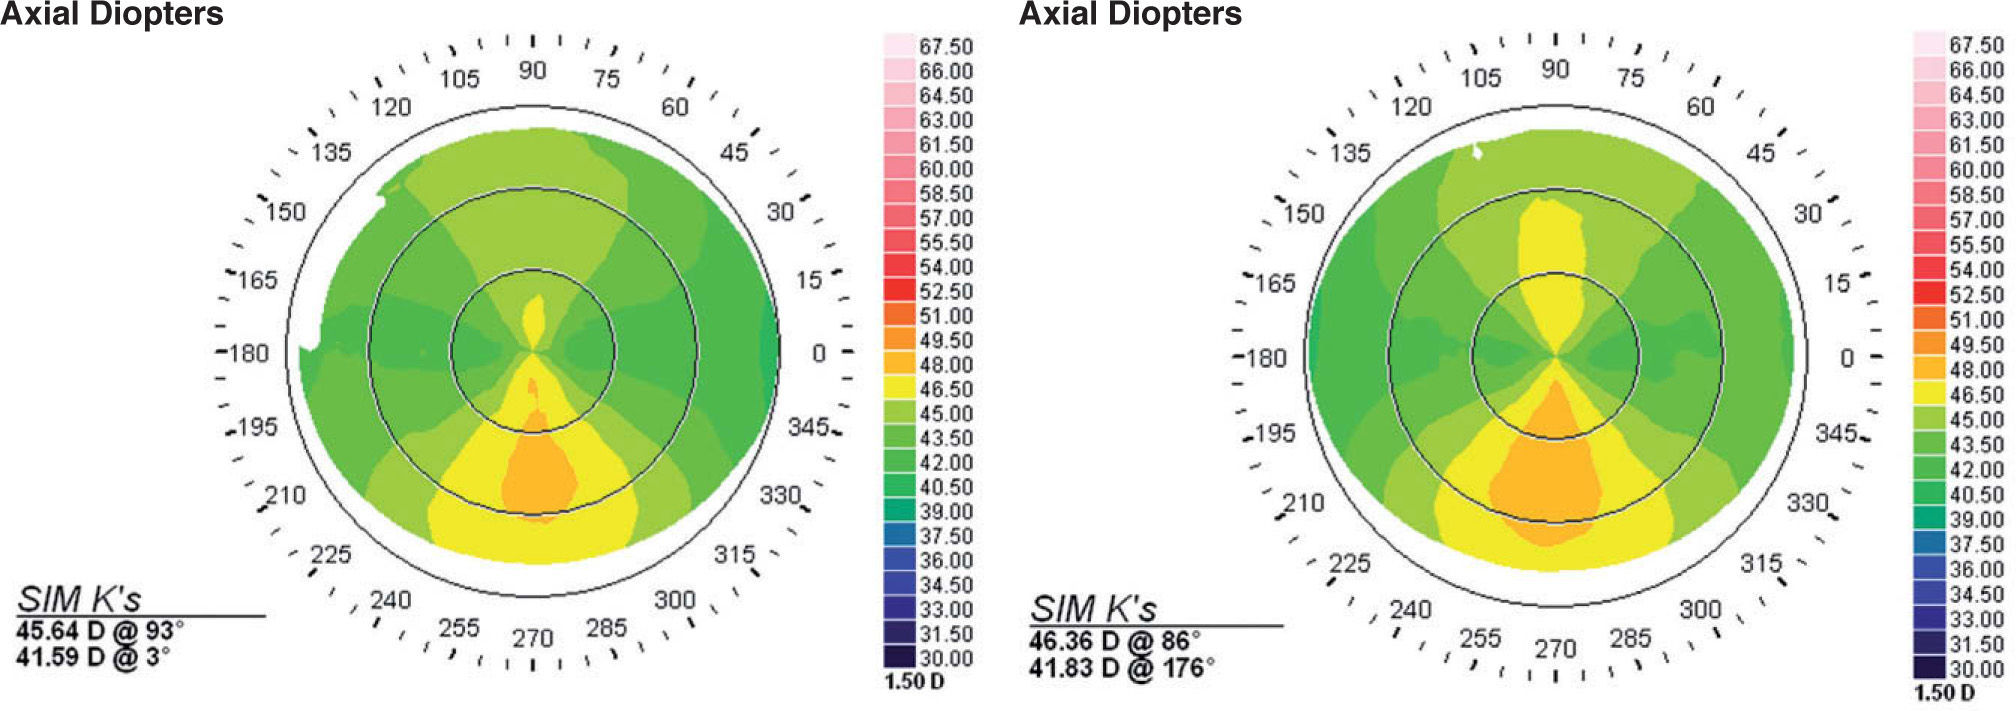
The KC group showed the lowest slope values of all groups. When the disease was in a different stage in one eye in relative to its fellow eye, then the value of the slope was even lower than when the disease was in the same stage in both eyes. An example of a bilateral case of KC showing different stages of the disease in each fellow eye is shown in figure 9. The presence of asymmetry is prominent, and it is sufficiently represented by the very low value of the slope for each pair of eyes (13.1). Figure 10 depicts another case of bilateral keratoconus, where the stage of the disease is the same in both eyes. The degree of asymmetry is lower than in the previous example (seeFigure 9); however, the value of the slope is still significantly low (57.5).

Corneal topographies for the two fellow eyes of a subject included in the keratoconus group. In this case, the disease is in a different stage in each eye. This was also demonstrated by means of the data analysis, which yielded the lowest values for the slope of the cumulative percentage distribution plot among all the corneal categories under analysis. The value of the slope, for this particular example, was equal to 13.1.

Corneal topographies for the two fellow eyes of a subject included in the keratoconus group. In this case, the disease was in the same stage in both eyes. For this subgroup of keratoconus eyes, the values of the slope of the cumulative percentage distribution plots were low, but higher than in the cases where the stage of the disease was different in each eye. For this particular example, the value of the slope was equal to 57.5.
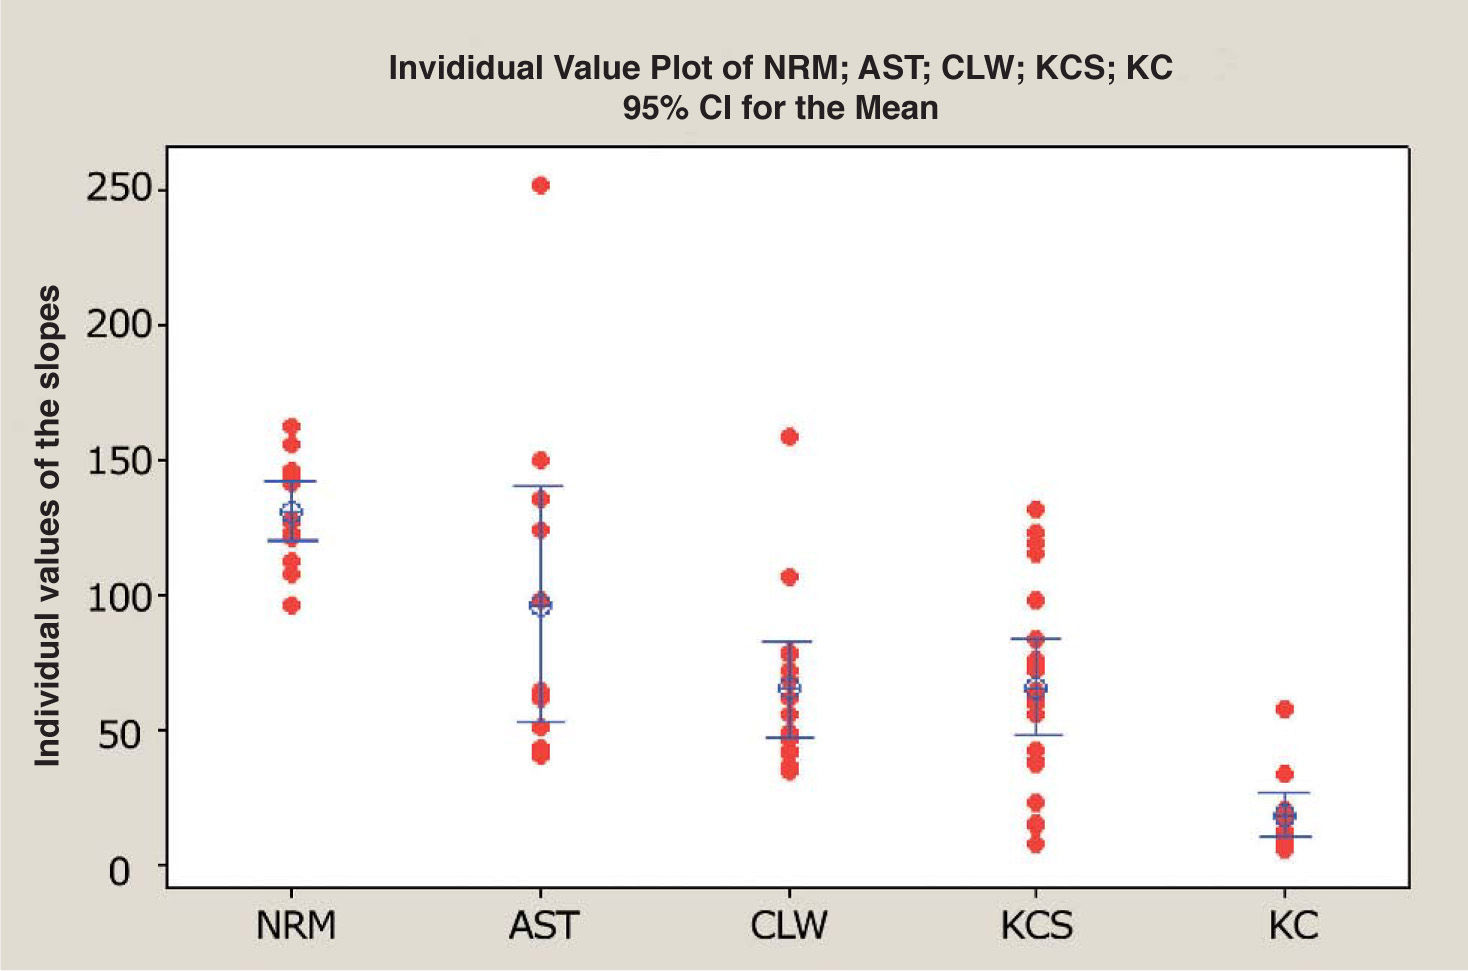
Statistically, the KC group was well differentiated from all the other groups; its high degree of bilateral asymmetry characterizes this disease. Regarding the other corneal categories, the KCS and the CLW groups are statistically different from the normal group, but not from each other. This indicates that in both groups exists bilateral asymmetry but, unfortunately, it is not possible to differentiate between them with this method alone. Furthermore, it is worth noting that given the 95% confidence interval for the mean of the slope of the normal group, 18 out of the 20 KCS and all the bilateral KC cases would be classified as non-normal with this method. Figure 11 contains a plot that represents the individual slope values for each pair of eyes in each group and it also includes interval bars that indicate the 95% confidence interval for the mean of the slope value within each category. However, given the limited size of the sample, the interpretation of these results should be made with particular caution.

Plot depicting the individual values of the slope of the regression lines for the cumulative percentage distribution plots for of each pair of eyes. The interval bars represent a 95% confidence interval above and below the mean value of the slope, for each of the 5 different corneal categories.
In this study we have presented a quantitative method that describes bilateral asymmetry in different corneal categories. This method was designed to work with any corneal topography system that returns axial-curvature values in diopters. It does not use proprietary indices specific to one system. The method was highly effective to differentiate normal and astigmatic corneas from abnormal conditions related to ectasia and corneal warpage. However, it wasn’t able to differentiate CLW from KCS. Nevertheless, the method may prove useful to detect when a warped cornea returns to its normal state. This method can be complementary to all the screening procedures that are used nowadays based on the description of the characteristics of the cornea. It provides additional information that will help to detect diseases, like KC, when they are still in its early stages. Moreover, it will contribute towards a more efficient screening of refractive surgery candidates, because it evaluates both corneas, rather than evaluating each cornea separately.
Supported by Research to Prevent Blindness, Inc. A quantitative method for the analysis of bilateral corneal asymmetry in different corneal categories. This research was supported by a research grant NIH R01EY14162 (MKS).
Financial disclosure: The authors have no commercial or financial interest in the products or methods described in this manuscript.


