

To describe longitudinal changes in corneal curvature (CC) and axial length (AL) over 14 years, and to explore the relationship between AL and CC, and the axial length/corneal radius (AL/CR) ratio.
MethodsIn total 469, 6 to <12-year-old, children were enrolled in COMET. Measurements of refractive error, CC (D), CR (mm), and ocular component dimensions including AL were gathered annually. Linear mixed models were used to evaluate longitudinal changes adjusting for covariates (gender, ethnicity, lens type, baseline age and baseline refraction). The Pearson correlation coefficient between AL and CC was computed at each visit.
ResultsThere was a slight but significant (p<0.0001) flattening in CC over 14 years. At all visits females had significantly steeper CC than males (overall difference=0.53D, p<0.0001). Caucasians had the steepest CC, and Hispanics the flattest (p=0.001). The correlation between AL and CC was −0.70 (p<0.0001) at baseline (mean age=9.3 years) and decreased to −0.53 (p<0.0001) at the 14-year visit (mean age=24.1 years). The average AL/CR ratio was 3.15 at baseline and increased to 3.31 at the 14-year visit. The correlation between the magnitude of myopia and AL/CR ratio was significantly higher (p<0.0001) at each visit than the correlation between myopia and AL alone.
ConclusionsDifferences in average corneal curvature by age, gender, and ethnicity observed in early childhood remain consistent as myopia progresses and stabilizes. This study also demonstrates increases in the AL/CR ratio as myopia progresses and then stabilizes, supporting observations from previous cross-sectional data.
Describir los cambios longitudinales en la curvatura de la córnea (CC) y la longitud axial (LA) durante un periodo de catorce años, y explorar la relación entre dichos valores y el ratio longitud axial/radio de la córnea (LA/RC).
MétodosSe incluyó en el estudio COMET a cuatrocientos sesenta y nueve niños, de edades comprendidas entre 6 y <12 años. Se realizaron anualmente las mediciones del error refractivo, CC (D), RC (mm), y las dimensiones de los componentes oculares. Se utilizaron modelos lineales mixtos para evaluar los cambios longitudinales, ajustando las covariables (sexo, etnia, tipo de lente, edad inicial y refracción inicial). Se calculó el coeficiente de correlación de Pearson entre LA y CC en cada visita.
ResultadosSe observó un aplanamiento ligero, aunque significativo (p<0,0001) de la CC a lo largo de los 14 años. En todas las visitas, las mujeres reflejaron una CC considerablemente más curva que los varones (diferencia general = 0,53 D, p<0,0001). La raza caucásica reflejó una CC más cerrada, y la hispana reflejó un aplanamiento superior (p=0,001). La correlación entre LA y CC fue de -0,70 (p<0,0001) en la visita inicial (edad media = 9,3 años), descendiendo a -0,53 (p<0,0001) transcurridos catorce años (edad media= 24,1 años). El ratio medio LA/RC fue de 3,15 en la visita inicial, incrementándose a 3,31 transcurridos catorce años. En cada visita, la correlación entre la magnitud de la miopía y el ratio LA/RC fue considerablemente superior (p <0,0001) que la correlación entre miopía y LA, únicamente.
ConclusionesLas diferencias en la curvatura media de la córnea por edad, sexo y etnia, observadas en la infancia, son consistentes a medida que la miopía va progresando y estabilizándose. Este estudio demuestra también los incrementos en el ratio LA/RC a medida que la miopía progresa y se estabiliza, lo que respalda las observaciones de los datos transversales previos.
The results of both human and laboratory animal studies show that emmetropization is actively regulated by visual feedback,1 and change in the amount of axial growth appears to be the most influential factor.2,3 However, despite the consensus that AL is the main factor that determines the degree of refractive error, it is not yet clear how the other ocular components such as corneal curvature affect myopia progression and stabilization.3
Researchers3–6 suggest that there may be a range of axial lengths over which the cornea can exert an emmetropizing effect to prevent myopia. However, as axial length continues to increase, the cornea may be incapable of further flattening. Instead, with increasing axial length the cornea may actually steepen, perhaps because of mechanical stretching of the globe.3 In a large, retrospective chart review of 15,488 adult patients, Hoffmann and Hütz6 found a strong statistical correlation between axial length and mean corneal radius, but this correlation was not present with extremely short or long eyes. A number of cross-sectional studies have investigated the correlation between corneal power and myopia in juvenile and young adult myopia, with most studies finding no relationship between axial length and corneal curvature in any category of myopia.7–10 However, Goss and Erickson11 found a lack of a correlation in juvenile myopia, but a significant correlation in young adult myopia.
Previous studies have explored the relationship between corneal curvature, gender, and ethnicity. Twelker et al.12 presented cross-sectional, ocular component data for the entire Collaborative Longitudinal Evaluation of Ethnicity and Refractive Error (CLEERE) Study cohort by age, gender, and ethnicity. They found that corneal curvature varied significantly by gender with females showing a greater mean corneal curvature in both meridians when compared with males. In the horizontal meridian the ethnic differences in corneal power were marked, with Native Americans and Hispanics having both a statistically significant and clinically meaningful (≥0.50D) flatter horizontal meridian than Whites.12 Statistically significant differences between ethnic groups were observed in the vertical meridian, although these differences were not large enough to be clinically significant. In a population-based study of 11–15 year old Australian children, Ip et al.13 found the mean corneal curvature was steeper in children of European Caucasian ethnicity and South Asian ethnicity than in children of other ethnic groups, although differences were not clinically meaningful. They did not report differences separately for horizontal and vertical meridians.
Researchers have also investigated the AL/CR ratio as a method of exploring the role of the cornea in the development of refractive error.14,15 Based on an analysis of data from 194 adult eyes, Grosvenor and Scott16 suggested that the emmetropic eye would be expected to have an AL/CR ratio close to 3/1 (24.0/8.0). Studies of non-myopic eyes have reported mean values of the AL/CR ratio between 2.9 and 3.1.17–21 Grosvenor and Scott16 found that with increasing amounts of myopia, the axial lengths were longer and the corneal radii tended to be shorter resulting in larger AL/CR ratios. Not surprising, at baseline 95% of the AL/CR ratios from the COMET study of 469 myopic children, the study on which the current results are based, were higher than 3.0.22 Ip et al.10 found a significant overlap in the distribution of axial length between myopia, hyperopia, and emmetropia in their sample of 12-year old children, and the AL/CR ratio correlated better with spherical equivalent refractive error (SER) than axial length with SER alone. They concluded that the AL/CR ratio is a more useful marker of progress toward myopia than axial length alone. In the Baoshan Eye Study in Shanghai, He et al.15 also found that the AL/CR ratio explained the total variance in SER better than AL alone.
In recent years genetic loci influencing refractive error development have been identified23 and new information about the genetic contribution to the scaling of AL and CR has become available.24,25 For example, specific genetic variants have been discovered that influence CR and AL,24 but not refractive error, or that influence AL and refractive error but not CR.25
The literature regarding the role of the cornea, its relationship to axial length, AL/CR ratio, and myopia development and progression, is limited by small sample sizes, use of cross-sectional data, use of adult subjects, and study samples that were not ethnically diverse. The COMET data set provides an opportunity to examine patterns of change in CR, AL and AL/CR over a 14-year timeframe by ethnicity and gender that should add to our understanding of myopia.
MethodsAll study protocols conformed to the Declaration of Helsinki and the institutional review boards at each participating center approved the research protocols. Written informed consent was obtained from all parents and written assent from all children, after a written and verbal explanation of the clinical procedures. Participants turning 18 years of age were re-consented as adults.
COMET was a prospective randomized clinical trial designed to evaluate the effect of two spectacle lens treatments (single vision lenses (SVLs) and progressive addition lenses (PALs)) on the progression of juvenile-onset myopia. At four clinical centers (Birmingham, AL; Boston, MA; Houston, TX and Philadelphia, PA) COMET recruited an ethnically diverse cohort of 469 children with myopic spherical equivalent between −1.25 and −4.50D and astigmatism of 1.50D or less. Children wore either SVLs or PALs for 5 years, and a statistically but not clinically significant treatment effect of 0.20D was reported after 3 years. The clinical trial ended after 5 years, and in consultation with the study optometrist, subjects were able to choose either spectacle lens design or contact lenses, at which point COMET became a natural history of myopia study, specifically looking at factors associated with progression and stabilization over 14 years. In the current analyses, data are combined for the two lens treatment groups. The study design and main outcome have been published elsewhere.22,26,27 Refractive error (cycloplegic autorefraction), corneal curvature (auto-keratometry), and ocular component dimensions (A-scan ultrasound) were measured annually. For cycloplegic autorefraction, five consecutive reliable measurements of sphere, cylinder, and axis were taken with the Nidek ARK 700A autorefractor about 30min after instillation of two drops of 1% Tropicamide, spaced 4–6min apart. The Nidek ARK 700A autorefractor was also used to evaluate corneal curvature. Three to five reliable axial length measures were taken, after dilation, using the Sonamed A2500 ultrasound.
In this paper we refer to corneal curvature in diopters, the units that are most relevant clinically. However, when referring to the axial length/corneal radius (AL/CR) ratio, we use corneal radius in millimeters, which are the units needed for calculation of the ratio.
Statistical analysis planThe statistical analysis software SAS version 9.3 (SAS Inc., Cary, NC) was used for data analyses in this study. Only right eye data were used as the correlations in axial length and corneal curvature/radius between the two eyes were high (r>0.95).
Only subjects with at least four visits were included (n=462). Corneal curvature including the steepest and flattest meridians was plotted by visit, as well as by gender, ethnicity and baseline age group across all visits. Linear mixed models (LMM) were used to evaluate longitudinal changes of corneal curvature and compare across subcategories based on all available data adjusting for covariates (gender, ethnicity, lens type, baseline age and baseline refraction). The relationship between AL and corneal curvature was evaluated at baseline, 3, 6, 9, 12 and 14 year visits using Pearson correlation coefficients (PCC). At each selected visit, PCCs were compared between two subcategories (e.g. males vs. females) using Fisher's transformation. To compare PCCs across five ethnic groups, chi-square tests of the Fisher transformed correlations were applied. PCCs between myopia and AL were compared to PCCs between myopia and AL/CR ratio using Meng's macro28 (comparing correlated correlations) at each selected visit. p-Values for the comparisons of correlation coefficients at each visit were adjusted for multiple comparisons using the Bonferroni correction. To test for a linear trend in PCCs across the visits, the AL and corneal curvature measurements were standardized at each visit and then the differences in slopes across the visits were tested using linear mixed models, since the standardized regression coefficients were very close to the PCCs.
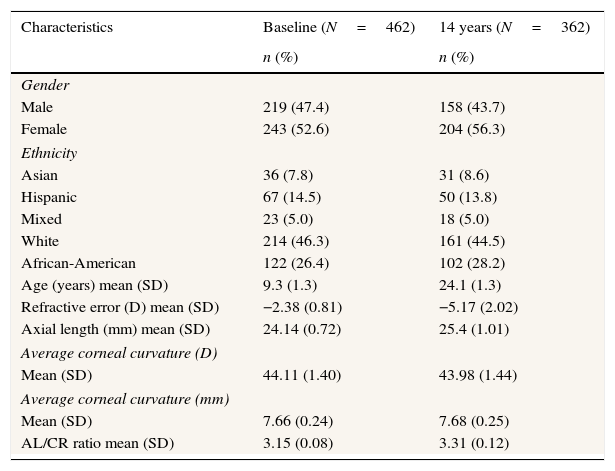
ResultsCharacteristics at baseline and the 14-year visitThe baseline characteristics of the COMET cohort in Table 1 illustrate that the sample was ethnically diverse, with an average age of 9.3 years and low to moderate myopia. The mean axial length was 24.14mm, with an average corneal curvature of 44.11D and an AL/CR ratio of 3.15. At 14 years the mean axial length increased to 25.40mm, the average corneal curvature decreased to 43.98D, and the AL/CR ratio increased to 3.31. The mean amount of myopia increased from −2.38D at baseline to −5.17D at 14 years.
Characteristics of COMET myopes at baseline and the 14 year visit.
| Characteristics | Baseline (N=462) | 14 years (N=362) |
|---|---|---|
| n (%) | n (%) | |
| Gender | ||
| Male | 219 (47.4) | 158 (43.7) |
| Female | 243 (52.6) | 204 (56.3) |
| Ethnicity | ||
| Asian | 36 (7.8) | 31 (8.6) |
| Hispanic | 67 (14.5) | 50 (13.8) |
| Mixed | 23 (5.0) | 18 (5.0) |
| White | 214 (46.3) | 161 (44.5) |
| African-American | 122 (26.4) | 102 (28.2) |
| Age (years) mean (SD) | 9.3 (1.3) | 24.1 (1.3) |
| Refractive error (D) mean (SD) | −2.38 (0.81) | −5.17 (2.02) |
| Axial length (mm) mean (SD) | 24.14 (0.72) | 25.4 (1.01) |
| Average corneal curvature (D) | ||
| Mean (SD) | 44.11 (1.40) | 43.98 (1.44) |
| Average corneal curvature (mm) | ||
| Mean (SD) | 7.66 (0.24) | 7.68 (0.25) |
| AL/CR ratio mean (SD) | 3.15 (0.08) | 3.31 (0.12) |
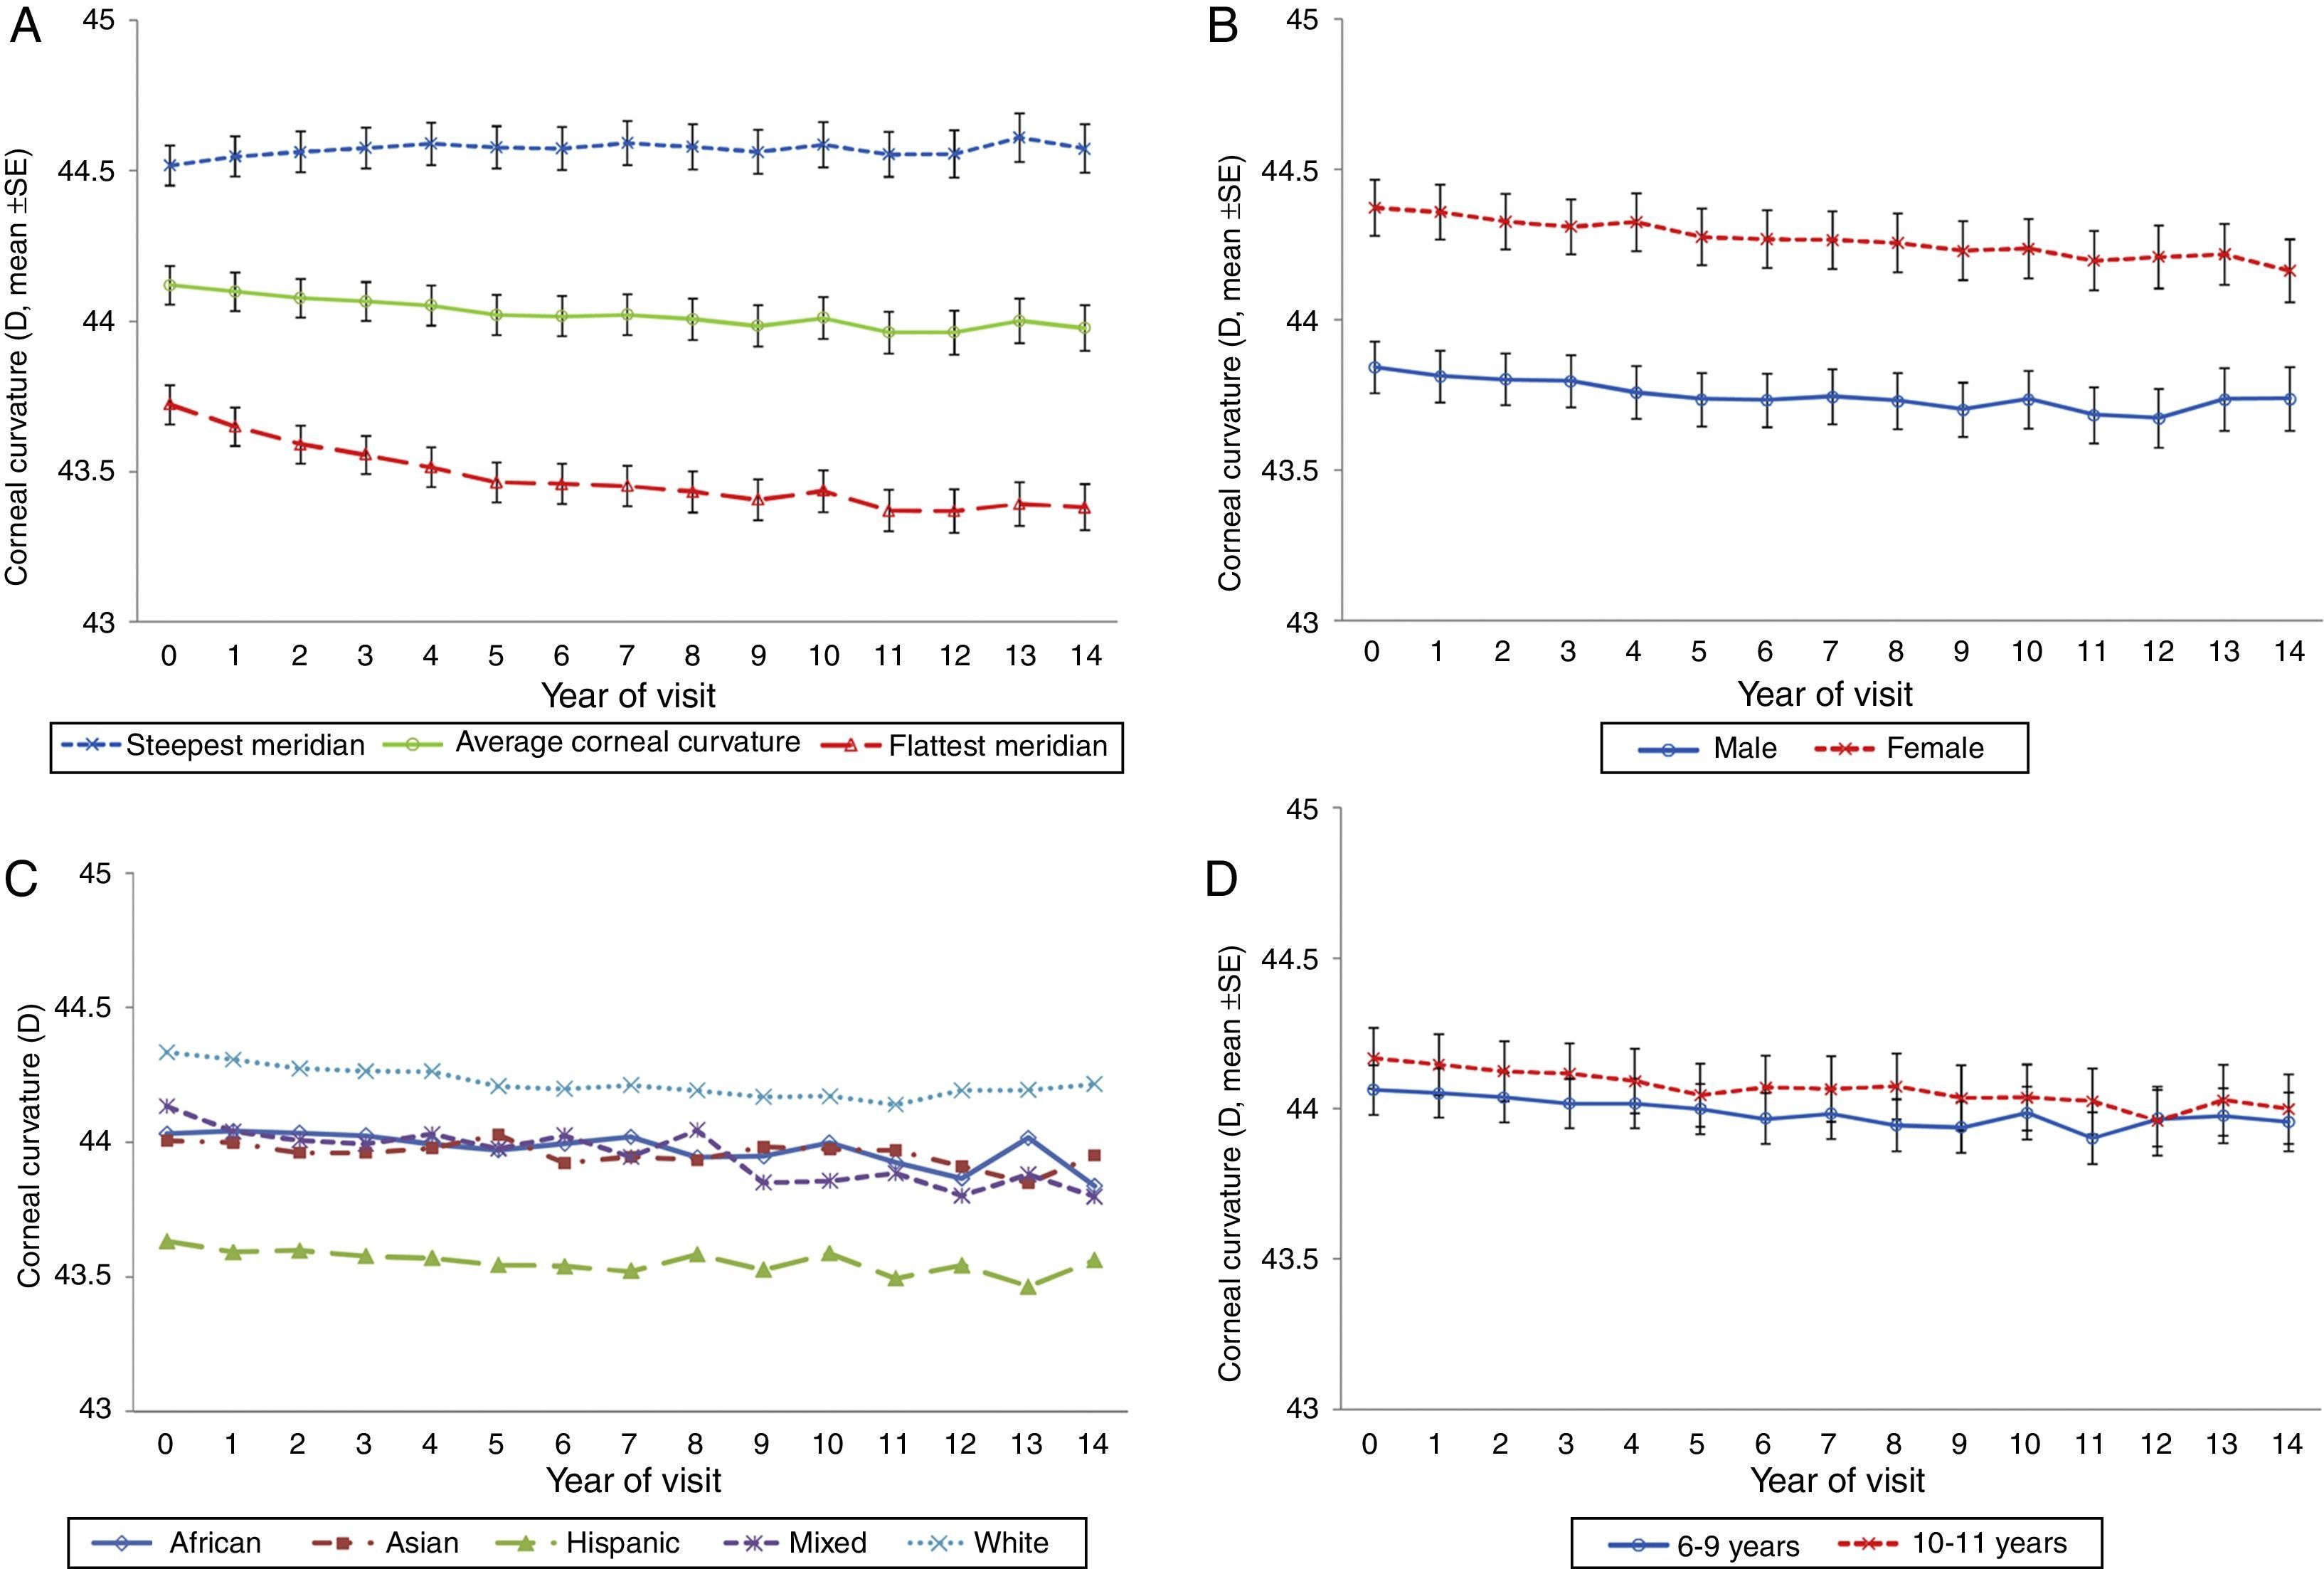
The overall trend in corneal curvature over the 14-year period was a slight flattening of the average of the steepest and flattest corneal meridians (adjusted slope=−0.01D/year, p<0.0001, Fig. 1A). The most significant change in corneal curvature occurred in the flattest meridian during the first 5 years of the study (43.72D to 43.46D, adjusted slope=−0.05D/year, p<0.0001). From study year 6–14, even though there was very little additional flattening of the flattest meridian, the change in slope was statistically significant (43.46D to 43.38D, adjusted slope=−0.01D/year, p<0.0001). The steepest meridian became slightly steeper over the 14 years of the study, a change that did not reach statistical significance (44.51D to 44.57D, adjusted slope=0.002D/year, p=0.33).
Gender differences Corneal curvature, steepest meridian and flattest meridian by visit. Corneal curvature is the mean of two meridians. (B) Corneal curvature by visit and gender. (C) Corneal curvature by visit and ethnicity. (D) Corneal curvature by visit and baseline age.")
Fig. 1B illustrates changes in average corneal curvature by gender over the 14 years and shows that at each visit females consistently had significantly steeper corneal curvature than males (p<0.0001). The rate of change observed in males (−0.0099D/year) and females (−0.0114D/year) was similar (interaction between gender and time, p=0.44).
Ethnicity differencesIn regard to ethnicity there were statistically significant differences (p=0.006) in average corneal curvature among the five groups (Fig. 1C). The Hispanic group had the flattest average corneal curvature at each visit from baseline to the 14-year final examination and the White sample the steepest average corneal curvature at each visit (Hispanic vs. White, p=0.001). The average corneal curvature was similar for the other three ethnic groups (African–American, Asian, and mixed) at all visits, with values between the Hispanics and the Whites.
Differences related to baseline ageFig. 1D illustrates the changes in average corneal curvature by baseline age group over the 14 years of the study. There was no difference between the children who were 6–9 years old at baseline compared to those who were 10 to <12 years of age (p=0.31).
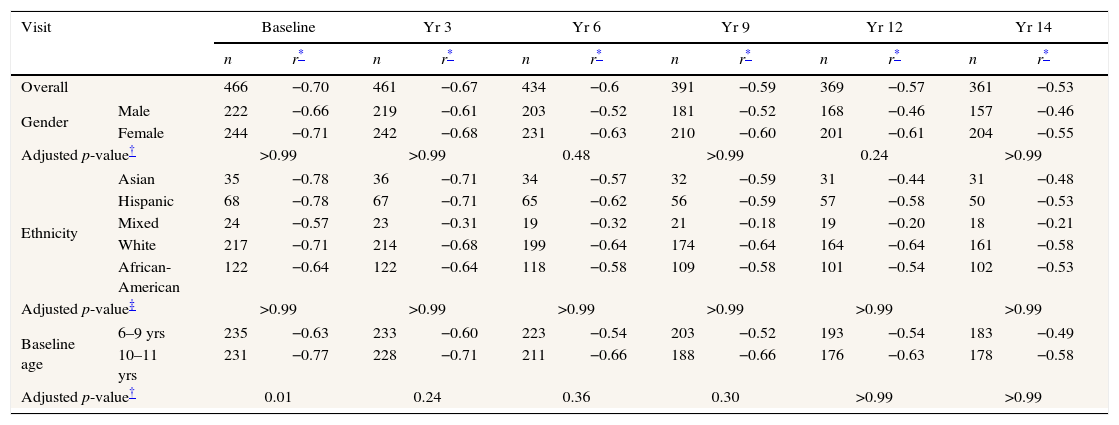
Correlations between axial length and corneal curvature at selected visitsOverall cohortUsing all available data at baseline and at the 3-year, 6-year, 9-year, 12-year, and 14-year visits, we evaluated the correlations between axial length and corneal curvature overall and by ethnicity, gender, and baseline age. Table 2 shows that the overall correlation between axial length and corneal curvature at baseline was −0.70 (p<0.0001) i.e., longer eyes were associated with less corneal curvature at baseline and the correlation decreased monotonically over time to −0.53 at the 14-year visit (test for linear trend, p=0.0004).
Correlations (Pearson's correlation coefficients) between corneal curvature and axial length by visit and gender, ethnicity, baseline age.
| Visit | Baseline | Yr 3 | Yr 6 | Yr 9 | Yr 12 | Yr 14 | |||||||
|---|---|---|---|---|---|---|---|---|---|---|---|---|---|
| n | r* | n | r* | n | r* | n | r* | n | r* | n | r* | ||
| Overall | 466 | −0.70 | 461 | −0.67 | 434 | −0.6 | 391 | −0.59 | 369 | −0.57 | 361 | −0.53 | |
| Gender | Male | 222 | −0.66 | 219 | −0.61 | 203 | −0.52 | 181 | −0.52 | 168 | −0.46 | 157 | −0.46 |
| Female | 244 | −0.71 | 242 | −0.68 | 231 | −0.63 | 210 | −0.60 | 201 | −0.61 | 204 | −0.55 | |
| Adjusted p-value† | >0.99 | >0.99 | 0.48 | >0.99 | 0.24 | >0.99 | |||||||
| Ethnicity | Asian | 35 | −0.78 | 36 | −0.71 | 34 | −0.57 | 32 | −0.59 | 31 | −0.44 | 31 | −0.48 |
| Hispanic | 68 | −0.78 | 67 | −0.71 | 65 | −0.62 | 56 | −0.59 | 57 | −0.58 | 50 | −0.53 | |
| Mixed | 24 | −0.57 | 23 | −0.31 | 19 | −0.32 | 21 | −0.18 | 19 | −0.20 | 18 | −0.21 | |
| White | 217 | −0.71 | 214 | −0.68 | 199 | −0.64 | 174 | −0.64 | 164 | −0.64 | 161 | −0.58 | |
| African-American | 122 | −0.64 | 122 | −0.64 | 118 | −0.58 | 109 | −0.58 | 101 | −0.54 | 102 | −0.53 | |
| Adjusted p-value‡ | >0.99 | >0.99 | >0.99 | >0.99 | >0.99 | >0.99 | |||||||
| Baseline age | 6–9 yrs | 235 | −0.63 | 233 | −0.60 | 223 | −0.54 | 203 | −0.52 | 193 | −0.54 | 183 | −0.49 |
| 10–11 yrs | 231 | −0.77 | 228 | −0.71 | 211 | −0.66 | 188 | −0.66 | 176 | −0.63 | 178 | −0.58 | |
| Adjusted p-value† | 0.01 | 0.24 | 0.36 | 0.30 | >0.99 | >0.99 | |||||||
r is correlation coefficient. All correlations are significantly different from 0 (all p-values≤0.01), except the mixed ethnic group from visit year 3 onwards (p≥0.15).
The correlations between axial length and corneal curvature were slightly higher in females than males, but none of the gender differences were statistically significant (all p≥0.24 with Bonferroni correction; Table 2). In addition, the correlations decreased similarly over time for both males and females.
EthnicityTable 2 also presents the AL vs. corneal curvature correlations for the five ethnic groups identified in the study. The correlations do not differ significantly by ethnicity at any visit. All ethnic groups demonstrated the same trend over time, with the correlations decreasing from baseline to the 14-year visit, becoming more similar at the last visit. The smallest change in correlations over time is in the African-Americans (r=−0.64 at baseline to r=−0.53 at the 14-year visit), and the largest is in the mixed (r=−0.57 at baseline and −0.20 at the 14-year visit), though the sample size is small.
Baseline ageChildren in the 6–9 year old age group at baseline had a significantly lower correlation between axial length and corneal curvature (r=−0.63) than children in the 10–11 year old group (r=−0.77, adjusted p=0.01). However, at all other points in time there were no significant differences by age.
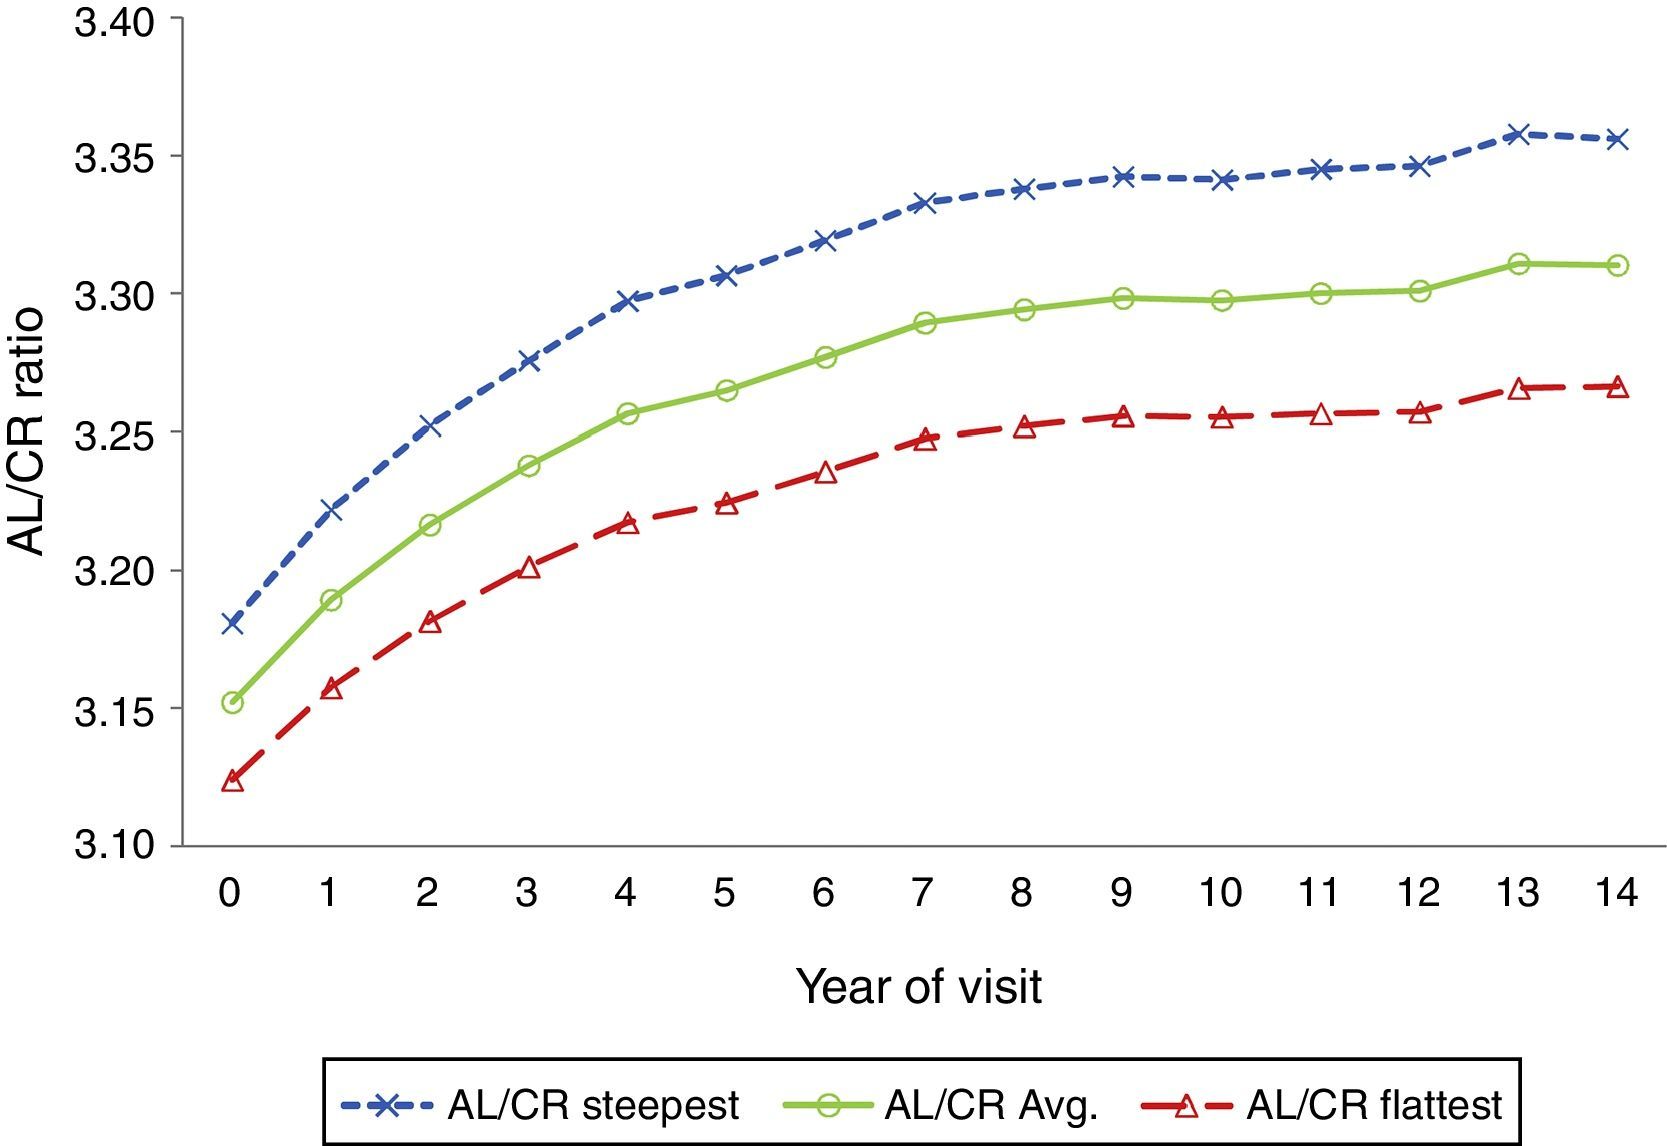
Mean AL/CR ratio by visit over 14 yearsThe average axial length to corneal radius ratio (AL/CR) was 3.15 at baseline and increased to 3.31 at the 14-year visit. Fig. 2 shows that the AL/CR ratio was higher for the steepest than the flattest meridian and that the largest changes occurred during the first 5 years of the study (p<0.0001).
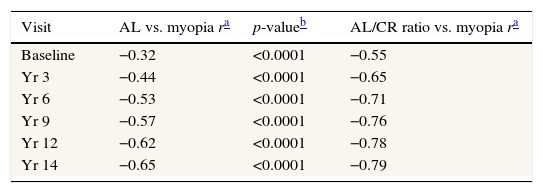
Correlations between magnitude of myopia and AL vs. magnitude of myopia and AL/CR ratio at selected visits
Table 3 compares correlations between the magnitude of spherical equivalent myopia and AL vs. the magnitude of myopia and AL/CR ratio. All correlations were lower at baseline (−0.32 AL alone, −0.55 AL/CR ratio) and in the early years than in the later years and at the 14-year visit (−0.65 AL alone, −0.79 AL/CR ratio).
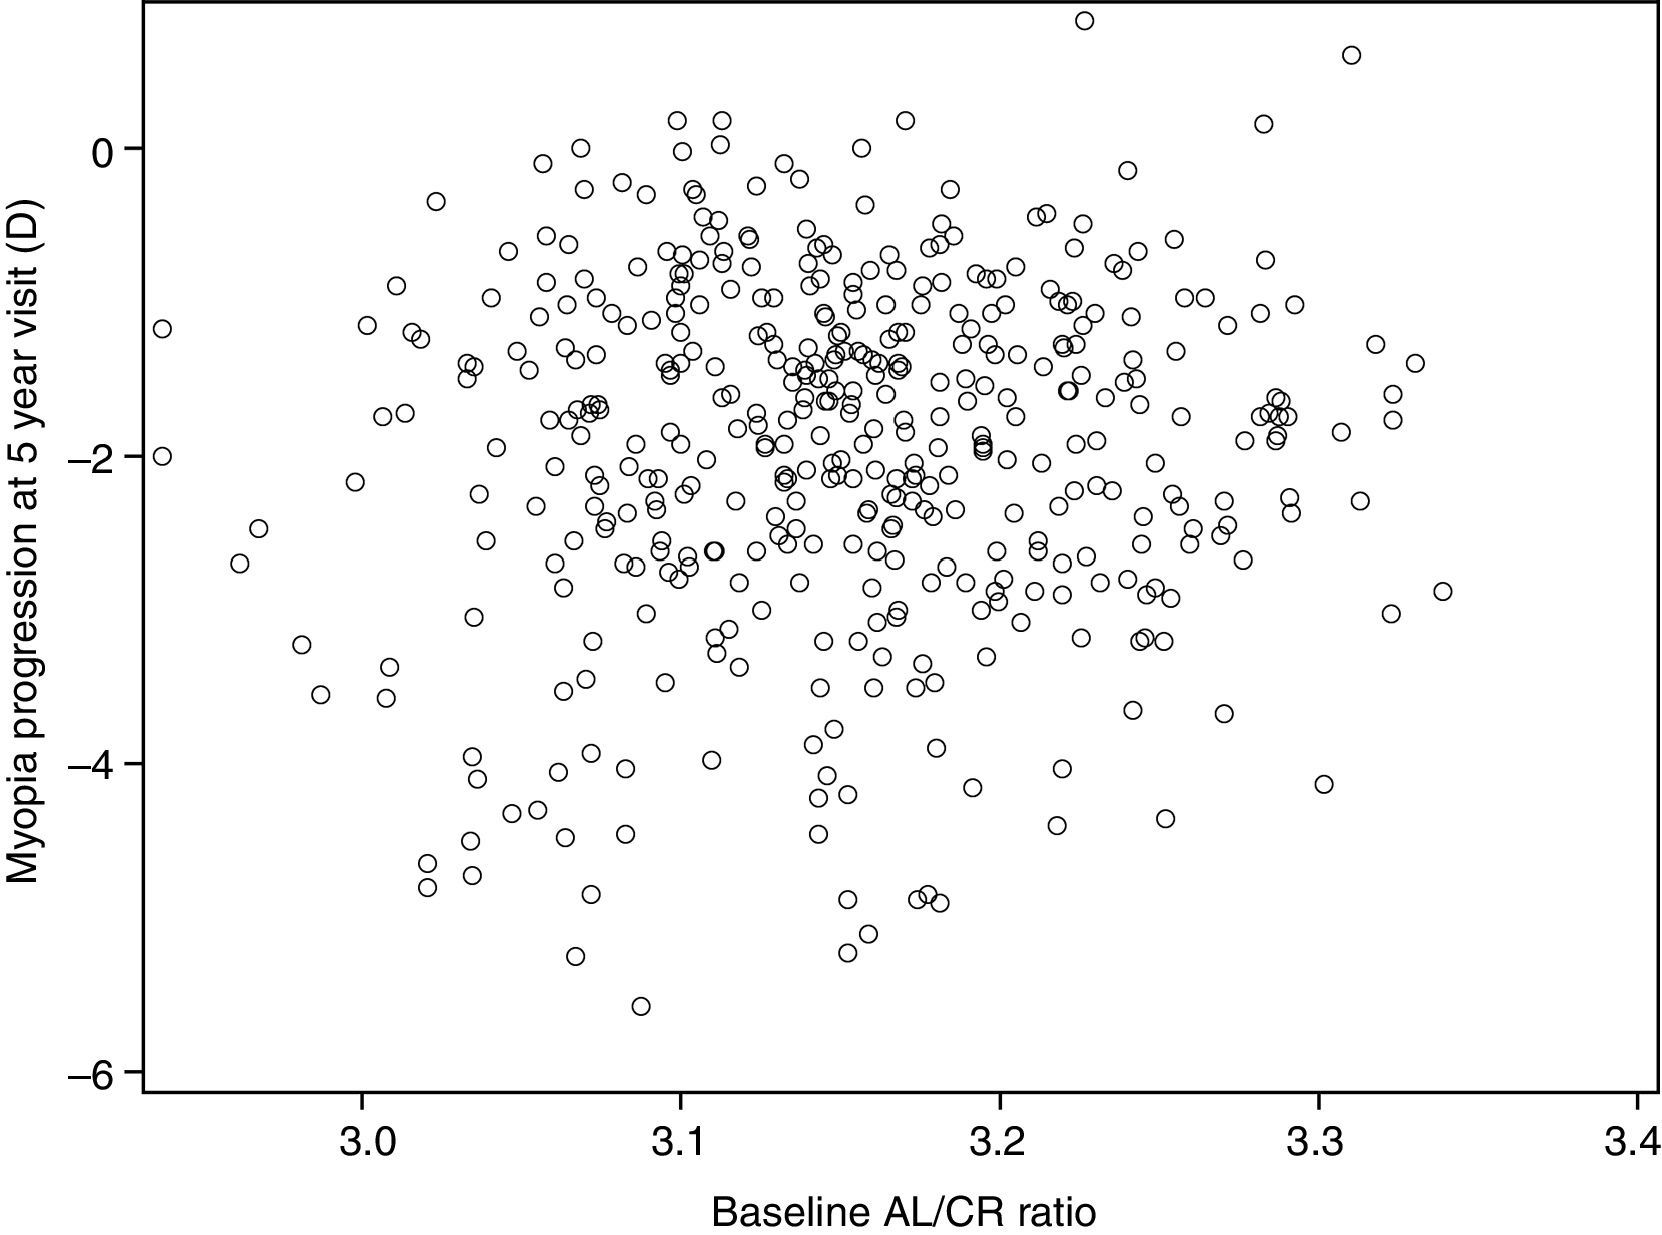
AL/CR ratio and myopia progressionFig. 3 compares the baseline AL/CR ratio to myopia progression after 5 years. We chose 5 years for this comparison because the randomized clinical trial ended at this point and most of the progression occurred by the end of year 5. As shown in the figure, there was no significant relationship between the AL/CR ratio and myopia progression (r=0.07, p=0.17).
AL/CR ratio: effect of switching to contact lenses from original treatment assignment
We completed an analysis of all subjects who switched to contact lenses at the end of the clinical trial to determine if there were any effects of contact lens wear on the AL/CR ratio. This analysis showed that there was no difference among those who remained in the original treatment assignment compared to those that switched to contact lenses (data not shown).
DiscussionSummaryThe results of this study represent the first long-term (14 years), longitudinal data evaluating changes in corneal curvature, its relationship to axial length, and the AL/CR ratio over time in a cohort consisting exclusively of children/adolescents with myopia. We found that the average corneal curvature in the COMET cohort was relatively stable over 14 years of observation, although there were significant differences between the flattest and steepest meridians as well as significant gender and ethnicity differences in average corneal curvature over this time period. In addition, our findings show a high correlation between corneal curvature and axial length during the early years of myopia progression, but a gradual decrease in this correlation with slowed progression and eventual stabilization of myopia. We also evaluated the relationship between corneal curvature and axial length using the AL/CR ratio and found a high ratio at baseline, which increased significantly over the first 5 years of the study when myopia progressed most and then showed minimal change through year 14. In addition, the magnitude of myopia was better correlated with the AL/CR ratio than with AL alone.
Changes in corneal curvatureThe small and differential changes in the flattest and steepest meridians found in this study are consistent with data from the 3-year longitudinal SCORM study in Singapore. In that study the authors suggested that corneal power appears to have a minor role in the progression of myopia,29 and that suggestion is supported by our data. The flattest corneal meridian (horizontal) became significantly flatter (p<0.0001) over the first 5 years of the study, while the steepest meridian did not change significantly. This differential change would suggest an increase in with-the-rule astigmatism as myopia progresses and agrees with previous reports showing this trend.30–32
Gender and ethnicity differences in corneal curvatureWe also found gender and ethnicity differences in corneal curvature. Beginning at baseline, females had significantly steeper corneal curvature than males, along with correspondingly shorter axial lengths with the same amount of myopia at all visits, an observation that did not change over time (or as the cohort became young adults). Steeper corneal curvature in females has also been reported by previous authors in young adult myopes,3,33 and in studies of children in the CLEERE study34 and the Sydney Myopia Study.13,35 Even though in CLEERE and the Sydney Myopia Study only 10–12% of the subjects were myopic and the authors did not provide data separately by refraction, the results from these two studies and COMET are consistent with respect to gender differences in corneal curvature in children.
In regard to ethnicity, our longitudinal dataset showed that (1) the pattern of slight cornea flattening over the 14 years of follow up was similar across all ethnicity groups, and (2) at all visits the average corneal curvature in Hispanic children was the flattest of all ethnic groups, and that compared to the White group, who had the steepest corneas, there was a clinically meaningful12,36 difference of ≥0.50D. We are not aware of any other longitudinal studies with an ethnically diverse, myopic only population, for comparison. However, the CLEERE study (using cross-sectional data) included corneal curvature data by ethnic group and the ethnic groups studied were similar to the groups studied in COMET. CLEERE investigators reported that of all ethnicities Whites had the steepest corneas in the horizontal meridian, an observation similar to our finding, and Native Americans had the flattest in both the horizontal and vertical meridians.12
We found that the mean corneal curvature was steeper than what was reported in two other clinical trials in myopic Asian children,37,38 which may be because half of COMET's participants are White, and Whites have the steepest corneas; also Asian children represent only a small percentage (9%) of the COMET cohort. The mean baseline corneal curvature of Asian children in COMET was 44.00D, still slightly steeper than in the two studies. In a 2-year trial in Hong Kong of progressive addition lenses to slow the progression of myopia in children 9–12 years old, Leung and Brown37 reported a mean corneal curvature of approximately 43.30D in three lens groups. In another trial of progressive lenses, Hasebe et al.38 found a mean corneal curvature of 43.60D at baseline in 95 myopic, Japanese children ages 6–12 years old.
Correlation of corneal curvature and axial lengthWe evaluated correlations between corneal curvature and axial length by visit and found a high correlation during the early years of the study, when the range of axial lengths was relatively small, and a gradual decrease in this correlation as myopia continued to progress and the eyes grew longer. These data lend support to the findings of Hoffmann and Hütz6 who reported that the correlation between axial length and corneal curvature decreased significantly with longer eyes. Guggenheim et al.24 also reported that corneal curvature and axial length were correlated (r=0.54) in a group of European teenagers with a range of refractions, a correlation similar to that found in the current study of only myopes (r=0.57). They concluded that the coordinated scaling of corneal curvature and axial length is determined by many common genetic variants, and that environmental factors may play a role in changing the coordinated growth of these components in ametropic eyes.
AL/CR ratioOur study is the first to provide longitudinal correlations over 14 years from the same subjects for AL/CR ratio vs. magnitude of myopia and for AL vs. magnitude of myopia. The same pattern was found at all visits, even as the correlations grew larger as the eyes grew longer and myopia progressed. Others have reported that the AL/CR ratio is more highly correlated than AL alone with spherical refractive error.10,15,16,39 In an early report of the AL/CR ratio, Stenstrom39 studied 1000 young adult patients and found a correlation of −0.76 for refractive error and AL compared to −0.84 for refractive error and AL/CR ratio. Grosvenor and Scott16 also reported a high correlation between AL/CR ratio and refractive error (−0.92) compared to −0.76 between refractive error and AL alone, and found that 84% of the variance in refractive error could be accounted for by variance in the AL/CR ratio. Ip et al.10 stated that although greater AL was associated with a greater likelihood of myopia in their sample of schoolchildren, myopic refractions were also found in shorter eyes. They proposed that the AL/CR ratio provides a rough measure of the degree of matching between AL and corneal power and, therefore, represents a more useful marker than AL alone of progress toward myopia. He et al.15 suggested that the AL/CR ratio may be a better method for screening for children with myopia than the traditional uncorrected visual acuity method used in most screenings.
While previous studies have evaluated the AL/CR ratio as a predictor for myopia development, the longitudinal nature of this study allowed us to evaluate the possibility that the AL/CR ratio may also be predictive of myopia progression. Data from the 5-year follow-up of the COMET cohort did not support such a relationship (Fig. 3).
An important strength of this study is the availability of 14-year longitudinal data from an ethnically diverse cohort with excellent long-term retention (93% at the 5-year and 78% at the 14-year visit). Unlike many earlier reports on corneal curvature and axial length, the COMET used a standard protocol with data collected by trained and certified optometrists at four clinical centers and analyzed at a central coordinating center. A limitation of this study is that all subjects were myopic at enrollment so changes in AL, CC or AL/CR that might be associated with the onset of myopia cannot be addressed.
ConclusionsThe importance of the analyses presented in this paper is the availability of 14 years of longitudinal data indicating that the significant gender and ethnicity differences in average corneal curvature observed in early childhood remain consistent as myopia progresses and stabilizes. The decrease in the correlation between CC and AL over time in COMET suggests that regardless of gender or ethnicity, as the eyes become more myopic, environmental factors may play a role in changing the coordinated growth of these components, affecting AL to a greater extent than CC. This study also demonstrates an increase in the AL/CR ratio as myopia progresses and then a slower rate of increase in the ratio as the myopia progression slows and then stabilizes, confirming reports from previous cross-sectional data.
Conflicts of interestThe authors have no conflicts of interest to declare.
This research was supported by NEI/NIH grants EY11752, EY11756, EY11805, EY11740, EY11754, EY11755 and EY023263.


