


The purpose of this study was to extend the knowledge of peripheral biometric component and its relationship to refractive status in healthy individuals by determining the correlation between peripheral ocular length to peripheral corneal radius ratio and the refractive error.
MethodsThis prospective study was conducted on thirty-three healthy adult participants. Refractive error was assessed objectively and subjectively and recorded as the mean spherical equivalent. Central and peripheral ocular lengths at 30° were assessed using partial coherence interferometry under dilation with 1% tropicamide. Central and peripheral corneal radius of curvature was assessed using Scheimpflug topography. Peripheral ocular lengths at 30° were paired with peripheral corneal curvatures at the incident points of the IOLMaster beam (3.8mm away from corneal apex) superiorly, inferiorly, temporally and nasally to calculate the peripheral ocular length-peripheral corneal radius ratio. Descriptive statistics were used to describe the distribution and spread of the data. Pearson’s correlation analysis was used to present the association between biometric and refractive variables.
ResultsRefractive error was negatively correlated with the axial length-central corneal radius ratio (r=−0.91; p<0.001) and with 30° peripheral ocular length-peripheral corneal radius ratio in all four meridians (r≤−0.76; p<0.001). The strength of the correlation was considerably lower when only axial length or peripheral ocular lengths were used.
ConclusionUsing the ratios of peripheral ocular length-peripheral corneal radius to predict refractive error is more effective than using peripheral corneal radius or peripheral ocular length alone.
Ocular components that contribute to determine the refractive status of the eye include the cornea, anterior chamber, crystalline lens, vitreous chamber and axial length.1–3 Investigations have revealed different degrees of correlation between refractive error, that mainly caused by spherical ametropia, and ocular refractive components. Strong and significant correlation has been reported between refractive error and; vitreous chamber depth and axial length.4–6
Some authors reported significant correlations (p<0.01) between refractive error and; central corneal radius of curvature,4,7,8 anterior chamber depth,4,8 lens thickness4,8 and lens power.4 However, those correlations were weak, with coefficient of determination values (R2) less than 0.2.
Axial length is not the sole determinant of refractive status. Emmetropic eyes can be big or small. Linking axial length to corneal radius gives better prediction to the refractive status of the eye. Research has shown that the refractive status of the eye can be predicted effectively by calculating axial length to central corneal radius ratio (AL/CCR) rather than axial length alone.2,7–9 The AL/CCR ratio is a useful indicator of the refractive status of the eye even in hyperopic eyes.7 All those studies2,7–9 reported that the eye is more likely to be close to emmetropic status when the AL/CCR ratio is around 3.00. If the AL/CCR ratio is greater than 3.00, the eye is more likely to be myopic. If it is less than 3.00, the eye is more likely to be hyperopic.
The AL/CCR ratio suggests that the cornea has a significant role in determining the refractive status of the eye when linking it to the axial length despite the comparatively poor correlation between central corneal radius and refractive error when viewed in isolation.4,5 Furthermore, recent studies revealed other roles of AL/CCR ratio.10,11 Increases in AL/CCR ratio might be a risk factor for the development of corneal astigmatism.10 The high AL/CCR ratio was significantly associated with a lower presence of diabetic retinopathy among diabetic patients.11
While most of ocular biometric literature concentrated on central ocular profile such as central corneal radius and axial length, fewer studies have been conducted on peripheral ocular profile. In the last two decades, and because of the development of biometric investigation techniques such as Scheimpflug-based systems and high-precision axial biometry by partial coherence interferometry or low coherence optical reflectometry, investigation of peripheral ocular length12–16 as well as peripheral corneal profile17,18 became the area of interest for many studies.
However, prior studies have not discussed the peripheral ocular length and peripheral corneal radius of curvature in relation to refractive error. Thus, the association between the peripheral ocular profile (peripheral ocular length combined with peripheral corneal radius) and refractive error is not clear yet. To the best of the authors’ knowledge, no study has been conducted to assess the association between peripheral ocular length to peripheral corneal radius ratio (POL/PCR) and refractive error. Therefore, the aim of this study was to determine the correlation between the POL/PCR ratio and the refractive status of the eye.
Material and methodsEthical approvalEthics approval was obtained from the Life Sciences ethics committee at Glasgow Caledonian University. All participants who agreed to take part in this study provided written informed consent before participating. A brief information sheet about the research was provided to all participants.
SubjectsSixty-one participants were recruited from students and staff members at Glasgow Caledonian University. All participants were contacted personally or by E-mail. Twelve were excluded because they did not meet the inclusion criteria. Sixteen did not complete all measurements as they changed their mind not to continue. Thus, the number of included participants was thirty-three; 16 females and 17 males aged from 18 to 45 years (25.50±5.66 years). The following inclusion criteria were adopted; astigmatism of no more than 2.50 D to minimize corneal effects in refraction, corrected visual acuity of 0.00 logMAR or better and intraocular pressure of less than 20mmHg. Participants with; amblyopia, keratoconus, ocular disease, history of refractive surgery, any systemic disease influences the eye, or any other serious systemic diseases were excluded. Participants who used soft contact lenses were asked to remove them at least 24h prior to participating in the study to avoid any artificial changes due to contact lens wear.
Biometric measurementsAll clinical measurements were performed by one optometrist, the correspondence author, in Vision Centre at Glasgow Caledonian University. Refractive error was assessed objectively using auto-refraction (NIDEK TONOREF II). Following objective assessment of refractive status, subjective refraction was performed to obtain the best corrected visual acuity with the least minus lens power.
Corneal curvature measurements were obtained using Pentacam (Oculus GmbH, Wetzlar, Germany). Pentacam is a non-contact optical instrument with a Scheimpflug camera that rotates 360 degrees around the visual axis and scans the anterior segment of the eye within two seconds.19 Pentacam has shown good repeatability and reliability for central and peripheral corneal measurements.20,21
Ocular lengthAll participants were dilated with one drop of 1% w/v tropicamide (Bausch & Lomb, Laboratoire Chauvin, Z.I. RipotierHaut, 07200 Aubenas – France) prior to ocular length measurements. A dilated pupil was necessary to allow measurement 30° off-axis ocular lengths.
Ocular length measurements were obtained using IOLMaster (Carl Zeiss, Jena, Germany). The IOLMaster is also a non-contact optical instrument which uses partial coherence interferometry with an infrared diode laser of a 780-nm wavelength.22 It compares optical lengths of two beams; one is reflected from the cornea and the other is reflected from one of the surfaces of the eye.22 IOLMaster is used mainly to measure the axial length for calculation of intraocular lens power in cataract surgery, and it can also assess the corneal power and anterior chamber depth. The repeatability of IOLMaster has been reported to be high and reliable through several studies.23–26
In order to investigate the peripheral ocular length more accurately, Mallen and Kashyap developed and deployed a custom-made attachment for the IOLMaster to enable more accurate off-axis fixation.12 They reported high repeatability and reliability of off-axis ocular length when using this device. This was also confirmed by several subsequent studies.13,24–26
In this study, a similar custom peripheral apparatus was used (built and fitted by the second co-author). It comprised a 50% reflection/50% transmission beam splitter (Edmund Optics), a Badal optometer to correct spherical refractive error, a high contrast Maltese cross target, a goniometer to rotate the beam splitter at different peripheral positions and three linear slides to control the position of the beam splitter in three axes (vertically and horizontally with respect to the pupil center, and forwards/backwards with respect to the corneal plane). A supportive external frame was attached to the IOLMaster instrument via chinrest frame and the instrument table to enable holding and moving the peripheral apparatus smoothly (see Fig. A1).
To ensure accuracy, the peripheral ocular length was assessed three times at each location; 30° off-axis superiorly, inferiorly, temporally and nasally on each eye. The three values were then averaged and recorded. The obtained value was the length between peripheral anterior cornea to peripheral anterior retina. For instance, if the peripheral target was up and the participant looked up, the obtained measurement was the length between inferior cornea to superior retina (Fig. 1).
 Participant fixates his eye at his nasal side. The obtained measurement will be the length from his temporal cornea to his nasal retina. (B) Participant fixates his eye at his superior side. The obtained measurement will be the length from his inferior cornea to his superior retina.")
Illustration of the obtained peripheral ocular length. (A) Participant fixates his eye at his nasal side. The obtained measurement will be the length from his temporal cornea to his nasal retina. (B) Participant fixates his eye at his superior side. The obtained measurement will be the length from his inferior cornea to his superior retina.
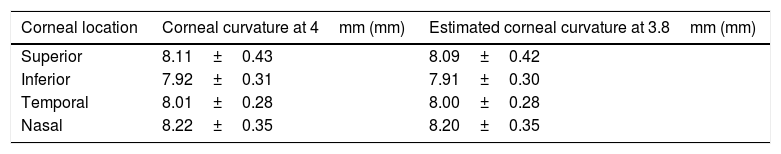
The Pentacam generates a number of detailed color maps which describe the anterior eye measurements. Corneal curvature values were extracted from the sagittal curvature map. The map reveals corneal curvature values in 1mm steps across the cornea from the apex across a 10mm zone (see Fig. 2 for illustration). Corneal coordinates, which indicate the distance between the corneal center and the incident point of the IOLMaster measurement beam, was considered as 3.8mm based on a previous technical report that used same procedure.12 The corneal coordinates were determined in two stages. In the first stage, corneal curvature values were extracted from the nearest location to the corneal coordinate at 4mm on the sagittal map. The difference between the intended (ideal) corneal location at 3.8mm from center and the applied location at 4mm from center leaves a small difference of 0.2mm (or 5% in relative terms). At stage 2, the extracted corneal curvature values were then adapted by applying a linear corneal model by the following formula:
Where CR3.8 is the estimated corneal curvature at 3.8mm, CR4 is the extracted corneal curvature at 4mm and CCR is the central corneal radius of curvature. Table 1 shows corneal curvature values before and after applying the linear model for each meridian..")
An example of the generated corneal radius of curvature map by the Pentacam. The black circle indicates the geometrical corneal center. The black squares indicate the extracted off-center peripheral corneal radii (at 4mm away from the center of the sagittal map, before application of the stage 2 noted above).
Corneal curvature values before and after applying the linear model to estimate the corneal curvature at 3.8mm (n=33).
| Corneal location | Corneal curvature at 4mm (mm) | Estimated corneal curvature at 3.8mm (mm) |
|---|---|---|
| Superior | 8.11±0.43 | 8.09±0.42 |
| Inferior | 7.92±0.31 | 7.91±0.30 |
| Temporal | 8.01±0.28 | 8.00±0.28 |
| Nasal | 8.22±0.35 | 8.20±0.35 |
While the change in radius from central to 4mm peripheral cornea will not be linear in nature, using a linear fit approach is unlikely to produce much of an error in the measure especially when the 3.8mm point is close to the known 4mm measure.
The AL/CCR ratio was calculated by taking the result of the axial length value in millimeters divided by the central corneal radius of curvature value in millimeters. A similar formula combining the 30° off-axis ocular lengths with the related corneal curvatures (at the corneal coordinate) was calculated. This means that POL/PCR ratio was calculated by dividing peripheral ocular length at the defined locations by the peripheral corneal radius at the corneal coordinate for those locations. For instance, the 30° superior ocular length was divided by the coincident peripheral corneal radius which is at 3.8mm away from corneal center inferiorly to calculate the superior POL/PCR ratio. This approach allows for a best-possible alignment of the corneal and retinal locations and ensures a more realistic set of data than the simple application of corneal measurements from the 4mm location.
Statistical analysisStatistical analysis was performed using Microsoft Excel 2016 and SPSS version 22 for Microsoft Windows computers. The main analysis was performed on left eye data. The peripheral ocular length data from right eye was only used to investigate the bilateral symmetry of the peripheral ocular length. Mean and standard deviation of all measurements were calculated. Normality of distribution was checked using the Shapiro–Wilk test. Paired samples t-test was performed to compare differences in means along the vertical and horizontal measurements in myopic eyes. Scatter plots were generated along with the related trend lines to show the association between refractive error and biometric measurements. Pearson correlation was performed. Statistical significance was considered when the p-value was less than 0.05 within 95% confidence interval.
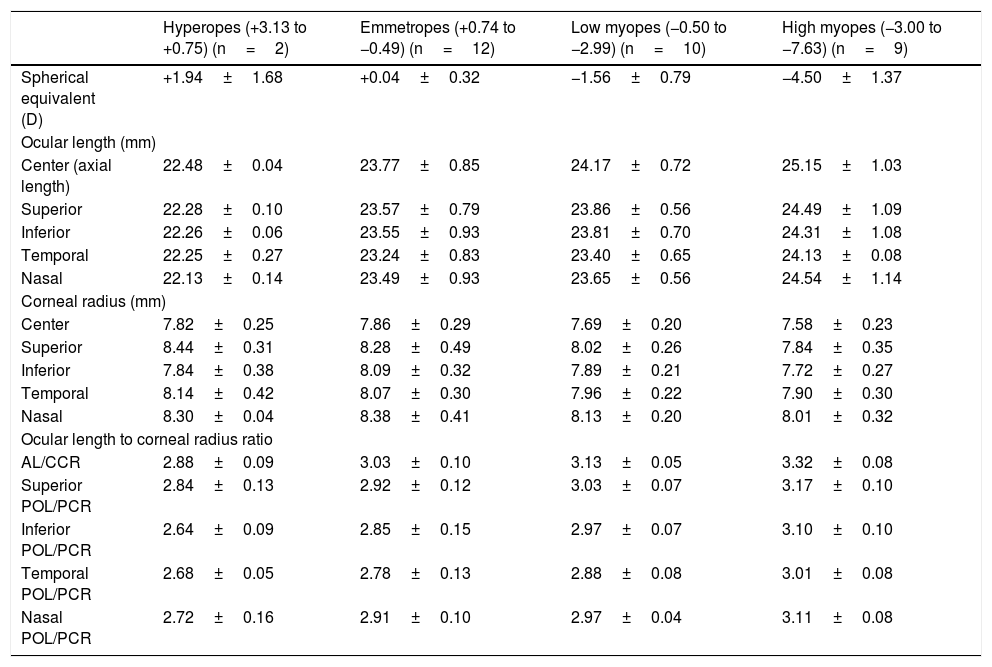
ResultsAll biometric measurements are shown in Table 2. Spherical equivalent of refractive error ranged from +3.13 D to −7.63 D (−1.57±2.22 D) with 2 hyperopic eyes, 12 emmetropic eyes and 19 myopic eyes (n=33). Ocular length measurements ranged from 21.87mm to 26.85mm. Corneal radius of curvature values ranged from 7.13mm to 9.30mm. The frequency distribution of refractive error, ocular length and corneal radius of curvature were normally distributed at all meridians (p=0.06, p≥0.24, p≥0.28 respectively).
Mean and standard deviation of biometric measurements.
| Hyperopes (+3.13 to +0.75) (n=2) | Emmetropes (+0.74 to −0.49) (n=12) | Low myopes (−0.50 to −2.99) (n=10) | High myopes (−3.00 to −7.63) (n=9) | |
|---|---|---|---|---|
| Spherical equivalent (D) | +1.94±1.68 | +0.04±0.32 | −1.56±0.79 | −4.50±1.37 |
| Ocular length (mm) | ||||
| Center (axial length) | 22.48±0.04 | 23.77±0.85 | 24.17±0.72 | 25.15±1.03 |
| Superior | 22.28±0.10 | 23.57±0.79 | 23.86±0.56 | 24.49±1.09 |
| Inferior | 22.26±0.06 | 23.55±0.93 | 23.81±0.70 | 24.31±1.08 |
| Temporal | 22.25±0.27 | 23.24±0.83 | 23.40±0.65 | 24.13±0.08 |
| Nasal | 22.13±0.14 | 23.49±0.93 | 23.65±0.56 | 24.54±1.14 |
| Corneal radius (mm) | ||||
| Center | 7.82±0.25 | 7.86±0.29 | 7.69±0.20 | 7.58±0.23 |
| Superior | 8.44±0.31 | 8.28±0.49 | 8.02±0.26 | 7.84±0.35 |
| Inferior | 7.84±0.38 | 8.09±0.32 | 7.89±0.21 | 7.72±0.27 |
| Temporal | 8.14±0.42 | 8.07±0.30 | 7.96±0.22 | 7.90±0.30 |
| Nasal | 8.30±0.04 | 8.38±0.41 | 8.13±0.20 | 8.01±0.32 |
| Ocular length to corneal radius ratio | ||||
| AL/CCR | 2.88±0.09 | 3.03±0.10 | 3.13±0.05 | 3.32±0.08 |
| Superior POL/PCR | 2.84±0.13 | 2.92±0.12 | 3.03±0.07 | 3.17±0.10 |
| Inferior POL/PCR | 2.64±0.09 | 2.85±0.15 | 2.97±0.07 | 3.10±0.10 |
| Temporal POL/PCR | 2.68±0.05 | 2.78±0.13 | 2.88±0.08 | 3.01±0.08 |
| Nasal POL/PCR | 2.72±0.16 | 2.91±0.10 | 2.97±0.04 | 3.11±0.08 |
The mean axial length value in highly myopic eyes was longer than that of hyperopic, emmetropic and low myopic eyes. Peripheral ocular length measurements (at all locations) were lower than axial length in all refractive groups. The peripheral ocular length data in myopic eyes displayed a degree of asymmetry along the horizontal and vertical meridians. Nasal and superior ocular lengths were longer than temporal and inferior ocular lengths respectively. However, the asymmetry was only significant between temporal and nasal ocular length (paired difference=0.33±0.48, p<0.01). The vertical asymmetry did not reach statistical significance (paired difference=0.11±0.26, p=0.09). Hence, myopic eye revealed an axial elongation with a slight tendency to expand nasally and superiorly (see Table 2).
Interestingly, the same pattern was observed in the fellow eye (right eye) among myopes. The asymmetry of peripheral ocular length was significant along horizontal meridian towards nasal side (paired difference=0.25±0.45, p=0.04) and not significant along vertical meridian (paired difference=0.11±0.26, p=0.09).
AL/CCR and POL/PCR ratiosValues of AL/CCR ratio in hyperopic, emmetropic and myopic eyes ranged from 2.82 to 2.94, 2.93 to 3.24, and 3.11 to 3.46 respectively. Values of POL/PCR ratio in all four meridians were slightly lower than values of the central AL/CCR ratio. Throughout the four meridians, superior POL/PCR ratio was the highest in all refractive groups. Temporal POL/PCR ratio was the lowest in all refractive groups (see Table 2).
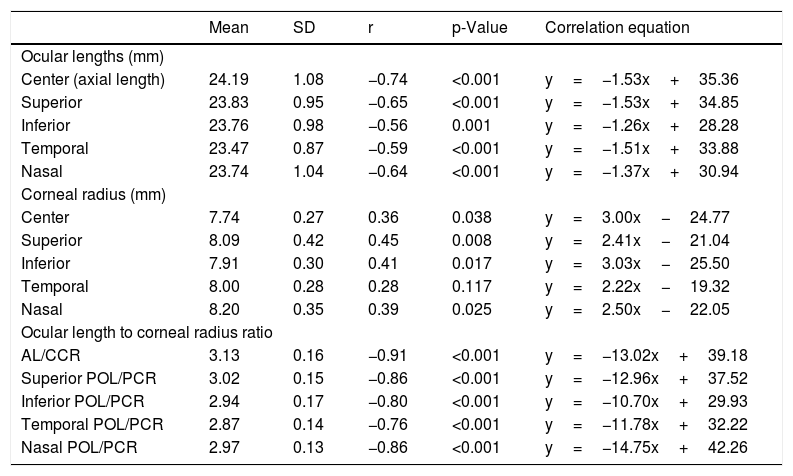
Relationship between refractive error and biometric measurementsCorrelation findings between refractive error and all biometric measurements are given in Table 3. The on-axis correlations with some examples of the off-axis correlations are illustrated in Fig. 3. The negative correlation between refractive error and ocular length at all locations was not that strong (R2≤0.55), though it was statistically significant (p<0.001, Table 3, Fig. 3A). Weak correlations were found between refractive error and corneal radii of curvature (R2≤0.20), however, they demonstrated significant positive correlations (p<0.05) at all corneal locations except the temporal corneal radius (p=0.117, Table 3, Fig. 3B).
Correlation findings between spherical equivalent (D) and biometric variables at central and peripheral locations (n=33).
| Mean | SD | r | p-Value | Correlation equation | |
|---|---|---|---|---|---|
| Ocular lengths (mm) | |||||
| Center (axial length) | 24.19 | 1.08 | −0.74 | <0.001 | y=−1.53x+35.36 |
| Superior | 23.83 | 0.95 | −0.65 | <0.001 | y=−1.53x+34.85 |
| Inferior | 23.76 | 0.98 | −0.56 | 0.001 | y=−1.26x+28.28 |
| Temporal | 23.47 | 0.87 | −0.59 | <0.001 | y=−1.51x+33.88 |
| Nasal | 23.74 | 1.04 | −0.64 | <0.001 | y=−1.37x+30.94 |
| Corneal radius (mm) | |||||
| Center | 7.74 | 0.27 | 0.36 | 0.038 | y=3.00x−24.77 |
| Superior | 8.09 | 0.42 | 0.45 | 0.008 | y=2.41x−21.04 |
| Inferior | 7.91 | 0.30 | 0.41 | 0.017 | y=3.03x−25.50 |
| Temporal | 8.00 | 0.28 | 0.28 | 0.117 | y=2.22x−19.32 |
| Nasal | 8.20 | 0.35 | 0.39 | 0.025 | y=2.50x−22.05 |
| Ocular length to corneal radius ratio | |||||
| AL/CCR | 3.13 | 0.16 | −0.91 | <0.001 | y=−13.02x+39.18 |
| Superior POL/PCR | 3.02 | 0.15 | −0.86 | <0.001 | y=−12.96x+37.52 |
| Inferior POL/PCR | 2.94 | 0.17 | −0.80 | <0.001 | y=−10.70x+29.93 |
| Temporal POL/PCR | 2.87 | 0.14 | −0.76 | <0.001 | y=−11.78x+32.22 |
| Nasal POL/PCR | 2.97 | 0.13 | −0.86 | <0.001 | y=−14.75x+42.26 |
 Axial and nasal ocular length (B) Central and temporal corneal radius of curvature (C) AL/CCR and Nasal POL/PCR ratios.")
There was a significant and strong negative correlation between refractive error and AL/CCR ratio (R2=0.83, p<0.001). Likewise, between refractive error and off-axis 30° POL/PCR ratio superiorly (R2=0.74, p<0.001), inferiorly (R2=0.64, p<0.001), temporally (R2=0.58, p<0.001) and nasally (R2=0.74, p<0.001) (Table 3, Fig. 3C).
DiscussionThe results of this study show a strong correlation between refractive error and central AL/CCR ratio as well as the peripheral POL/PCR ratio. The correlation between refractive error and the POL/PCR ratio was significant in all four meridians. As can be indicated from correlation findings, the POL/PCR ratio has a role similar to that of the AL/CCR ratio in determining the refractive status of the eye, with similar correlation coefficients. To the best of the authors’ knowledge, no such data have been reported before.
Another interesting finding is that the coefficients of determination values of the POL/PCR ratio were higher than those of the peripheral ocular lengths in correlation with refractive error. The highest R2 value was 0.83 for the correlation between refractive error and AL/CCR ratio. The R2 values of the off-axis 30° POL/PCR ratio were slightly lower than that but also higher than the R2 of the correlation between refractive error and axial length. This means that the POL/PCR ratio is a stronger predictive factor of refractive error than the axial length or peripheral ocular length alone.
The correlation between refractive error and biometric measurements has been reported in different refractive ranges.2,7–9 Findings from this study are in accord with previous research and extend the earlier work by providing peripheral length and corneal data. Those studies2,7–9 reported a strong correlation between refractive error and AL/CCR ratio with R2 ranging from 0.61 to 0.84. This R2 was the highest among the other correlations; refractive error versus axial length (R2 ranged from 0.35 to 0.61) and versus central corneal radius (R2 ranged from 0.01 to 0.13).2,7–9 The differences in R2 values between previous work and this study can be attributed to the differences in population sizes and refractive ranges.
The ocular length data have revealed temporal-nasal intra-ocular asymmetry in myopic eyes. Similar asymmetry has been reported previously,13,14,27 using different techniques to assess the ocular length such as peripheral refraction and magnetic resonance imaging (MRI). Ehsaei et al.13 measured peripheral ocular length along vertical and horizontal meridians by the same technique to that described here but at extra retinal locations; 0, 10°, 20°, 30°. They reported significant intra-ocular asymmetry between temporal and nasal ocular length only at 30° in myopes.13 This suggests that the myopic eye expands symmetrically in the center up to 20° and asymmetrically in the periphery. Given this, the myopic eye appears to have a prolate retinal shape combined with flattening away from the central pole. In addition, the nasal retina was flatter than the temporal retina, especially in the low myopic eyes group. This myopic prolate shape has been widely reported in earlier investigations.12–14,26–29
A similar pattern of asymmetry was found in the fellow eye in the myopic group; a result consistent with the bilateral symmetry of retinal shape found by Gilmartin et al.27 This finding led them to suggest that myopic growth is co-ordinated binocularly by processes that operate after the optic chiasm,27 however, the anisometropic nature of many of the myopic participants in this study means that the results provide only limited support to this suggestion.
The two hyperopes that participated in the study displayed a different pattern with the nasal retina steeper than the temporal retina. A larger data set would be required to determine whether this is pattern of results is typical in hyperopia.
The results of this study contribute to widening the knowledge base of the understanding of myopia development. Studying the role of peripheral as well as central ocular refractive components may help to better understand the processes leading to a mismatch in refractive and structural components of the developing eye and hence the refractive error. The strong association between refractive error and peripheral POL/PCR ratio confirms a finding from a previous investigation26 which concluded that peripheral dimensions of the eye are more likely to be related to the central refractive error, not merely peripheral optics.
In the same context, Mutti et al.29 assessed the changes in axial length along with peripheral refractive error before and after the onset of myopia. They found that relative peripheral hyperopia in myopes, was increasing rapidly just before the onset year of myopia in parallel with the increasing of the axial length.29 The peripheral POL/PCR ratio in the current study was slightly lower than the central AL/CCR ratio which refers to the presence of the relative hyperopia in periphery as has been identified.29 Furthermore, data from earlier literature have reported the increases of the AL/CCR ratio related to myopia onset and myopia progression.30,31 The earlier findings along with the current data suggest that the POL/PCR ratio might have a role in the development of refractive error, but this needs to be investigated, ideally by a longitudinal study tracking the peripheral ocular changes over time.
The work presented here may be relevant to the field of myopia management. Encouraging data have been presented from studies where modification of the peripheral refraction has been used to significantly slow the progression of myopia.32–34 It is hoped that the methods described here will have utility in the refinement of myopia management strategies, for example by determining the most appropriate degree of peripheral refraction modification in a given individual to maximize ocular elongation control.
This study is not without limitations, one being the relatively small sample size. However, collecting peripheral data meticulously to minimize unwanted and avoidable variability makes data collection time consuming and tests participants’ patience. In this study, data collection took a minimum of 60min per participant. Refinements of the technique, perhaps assisted by a degree of automation, may increase the clinical utility for wider data collection. The linear model used to estimate values of corneal curvature produced some minor differences between the real and the calculated curvatures. More complex modeling could be applied but the difference between the non-linear approach and the approximation achieved by using the linear model is likely to be small and unlikely to influence the findings of the study.
ConclusionIn conclusion, there is a strong and significant correlation between the refractive status of the eye and the POL/PCR ratio as well as the central AL/CCR ratio. Using the POL/PCR ratio to predict refractive error is more effective than using axial length or peripheral ocular length alone. Further work is required to study the role of POL/PCR ratio in the development of refractive error and potentially in myopia management strategies.
Conflicts of interestThe authors have no proprietary interests or conflicts of interest.
This work was supported by College of Optometrists Research Fellowship award, United Kingdom. The authors thank all participants in this study and all staff in Vision Centre at Glasgow Caledonian University for their help and support.
 Zeiss IOLMaster. (2) Beam splitter. (3) The peripheral Maltese cross target. (4) Goniometer to rotate the target around the rotation center of the eye. (5) Three knobs to control the position of the peripheral target and move it superiorly, inferiorly, temporally, nasally, internally and externally. (6) Two knobs to release and attach the entire apparatus. (7) Supportive frame to hold the peripheral apparatus.")
(1) Zeiss IOLMaster. (2) Beam splitter. (3) The peripheral Maltese cross target. (4) Goniometer to rotate the target around the rotation center of the eye. (5) Three knobs to control the position of the peripheral target and move it superiorly, inferiorly, temporally, nasally, internally and externally. (6) Two knobs to release and attach the entire apparatus. (7) Supportive frame to hold the peripheral apparatus.


