


This study compared visual performance and optical properties of three filters.
MethodTwo groups of twenty adults were recruited: wearers of progressive addition lenses (PAL, 46–73 years) and wearers of single vision lenses (SVL, 26–55 years). Three spectacle filters (Hoya, Japan) were compared: clear control, Standard Drive (STD), and Professional Drive (PRO) lenses. Optical transmittance was measured by a Jasco V-650 spectrophotometer. Best corrected visual acuity (BCVA) was measured in photopic (BCVAphotopic) and mesopic (BCVAmesopic) conditions and under glare (BCVAglare). Photopic contrast sensitivity (CS) was also measured.
ResultsThe three longpass filters show cutoff at 426±2nm (STD/PRO) and 405±2nm (clear lens). BCVAglare improved with Drive filters compared to the clear one (p<0.05) from 0.03 to -0.02 (STD) and to -0.01 (PRO) for PAL and from -0.08 to -0.12 (STD and PRO) for SVL. For PAL, BCVAmesopic improved from 0.15 to 0.12 (STD, p<0.05) and 0.13 (PRO), while no substantial difference was observed for SVL. CS showed some improvements with Drive lenses at some angular frequencies between 6 and 18 cycles/deg, mainly for the PAL group. No BCVAphotopic differences were found. After testing all filters, each for two weeks, 79% (PAL) and 60% (SVL) of participants preferred Drive lenses.
ConclusionsDrive lenses are found to maintain or improve some visual functions compared to the clear lens. The improvement of mesopic visual acuity, visual acuity under glare, and contrast sensitivity is mainly attributed to the reduction of intraocular light scattering as a consequence of the total light attenuation in the spectral range below the cutoff.
Este estudio comparó el desempeño visual y las propiedades ópticas de tres filtros.
MétodoSe reclutaron dos grupos de veinte adultos: los que utilizaban lentes de adición progresiva (PAL,de 46 a 73 años), y los que utilizaban lentes monofocales (SVL, de 26 a 55 años). Se compararon tres filtros de gafas (Hoya, Japón): control claro, Standard Drive (STD), y Professional Drive (PRO). La transmitancia óptica se midió con un espectrofotómetro Jasco V-650. Se midió la agudeza visual mejor corregida (BCVA) en condiciones fotópicas (BCVAphotopic) y mesópicas (BCVAmesopic) y con deslumbramiento (BCVAglare). También se midió la sensibilidad al contraste fotópico (CS).
ResultadosLos tres filtros de amplio espectro reflejaron un punto de corte de 426±2nm (STD/PRO) y 405±2nm (lentes claras). BCVAglare mejoró con los filtros Drive en comparación con los filtros claros (p<0,05) de 0,03 a -0,02 (STD) y -0,01 (PRO) para PAL, y de -0,08 a -0,12 (STD y PRO) para SVL. Para PAL, BCVAmesopic mejoró de 0,15 a 0,12 (STD, p<0,05) y 0,13 (PRO), no encontrándose diferencia sustancial para SVL. CS reflejó algunas mejoras con las lentes Drive a ciertas frecuencias angulares entre 6 y 18 ciclos/deg, principalmente para el grupo PAL. No se encontraron diferencias para BCVAphotopic. Tras probar todos los filtros, cada uno de ellos durante dos semanas, el 79% (PAL) y el 60% (SVL) de los participantes prefirieron las lentes Drive.
ConclusionesSe ha encontrado que las lentes Drive mantienen o mejoran ciertas funciones visuales en comparación con otras lentes claras. La mejora de la agudeza visual mesópica, la agudeza visual con sensibilidad de deslumbramiento y contraste se atribuye principalmente a la reducción de la dispersión de la luz intraocular, como consecuencia de la atenuación total de la luz en el rango espectral inferior al punto de corte.
Blue-light filtering spectacle lenses have received increased attention in recent years because of their potential to reduce the effects of light scatter and chromatic aberrations, and the possible protection they offer against photo-oxidative effects induced by photons of relatively high energy.1–4 Indeed, the accumulation of the retinoid fluorophore N-retinylidene-N-retinylethanolamine within the retinal pigment epithelium is expected to increase the vulnerability of the retina to high-energy blue radiation.3–6 Spectacles, contact lenses, and intraocular lenses have all been proposed for filtering blue light. However, finding the balance between effectively reducing blue-light hazards and maintaining or improving visual functions remains a challenge, and one debate in the literature.6–18 Some authors,6–8,10,18 found visual acuity improvement and/or contrast sensitivity improvement when using filters which filter blue light both in normal subjects and in subjects affected by cataract, age-related macular degeneration, or other retinal diseases. Remarkably, some authors did not find any correlation between the CS improvement and the subjective preferences for the filters.7 Mahjoob et al.9 recently discussed the effect of a yellow filter on visual acuity and contrast sensitivity under glare for various ages, though the improvement was only significant in older subjects aged 51–60 years. Other papers reported neutral or negative effects of tinted lenses and filters on visual performances.11–16 In general, there is little objective and conclusive evidence that tinted lenses or filters improve visual function, and it is unclear whether lenses with specific spectral characteristics are better than any others. The only consistent reported effect is an improvement in dark adaptation,17 which would be expected intuitively since filters reduce the intensity of the incident light during exposure. In this context, blue-filtering Drive lenses (Hoya, Japan) were recently proposed as anti-glare filters for car drivers, with the main aim of reducing distracting glare from the dashboard, streetlights, and oncoming traffic when driving at night. At the same time, these lenses are expected to show an improvement of contrast and brightness perception, even in poor light and bad weather.
To gain further information on this issue, we performed a comparison between two Drive lenses and a clear lens, whose optical properties were also preliminary characterized. We used pshychophysical measurements to evaluate whether spectacle lenses incorporating these filters offered any real benefit.
MethodsParticipantsGlare is expected to be related to intraocular light scatter.19–21 Therefore, two separate groups of participants were recruited: older adults wearing progressive addition lenses (PAL group), who typically exhibit a higher level of intraocular light scatter, as well as younger adults wearing single vision lenses (SVL group), who typically have reduced intraocular light scatter.19–21 In order to ensure against a two-sided type 1 error of 0.05, and to detect a unitary minimum difference between the different types of lenses with a power of 0.80, 20 participants were recruited for each group. The inclusion criteria were the absence of any ocular pathology, having a binocular best corrected visual acuity (BCVA) of at least logMAR=0.1 (logarithms of the minimum angle of resolution), having good binocular vision (no anomalies in ocular motility, heterophorias at distance and near and fusional reserves at distance within the limit of the expected values,22 no suppression, and a stereoscopic acuity of at least 60 arcsec), and being regular wearers of either progressive addition lenses (to be included in the PAL group) or regular wearers of single vision lenses (to be included in the SVL group). The latter criteria enabled each participant to wear the test lenses as normal, and therefore be fully exposed to the conditions of the experiment. One participant in the PAL group dropped out the study during the second phase (Fig. 1). The study was approved by the Ethics Committee of the University of Milano Bicocca (prot. Int. 0059770/17, classif. II.18, C.IPA unimib C.AOO:AMMU06, C. reg. prot.: RP01). Before being enrolled in the study each subject expressed his/her informed consent and gave the researchers permission to collect and treat personal and optometric data. The subjects took part in the project spontaneously and for free.
Visual assessment
A preliminary eye and visual examination was performed to determine whether each subject was eligible in respect to the inclusion criteria and to find the best ophthalmic correction (preliminary visual assessment in Fig. 1). Ophthalmoscopy and slit-lamp examination were carried out to detect any ocular anomaly. The presence of an anomaly in ocular motility was investigated by the H pattern test that is considered reasonable for the purpose and easier to perform in a clinical setting than other techniques.23–25 Non-cycloplegic subjective refraction at distance was carried out by a phoropter procedure. The mean spherical equivalent was calculated for each eye as the algebraic sum of the value of the sphere and half of the cylindrical value and reported separately for the two groups. The addition for near in PAL group was firstly determined according to the expected age and then adjusted subjectively.25 Best corrected visual acuity (BCVA) was measured with the optical correction at far distance arranged in a trial frame at a distance of 4m using high-contrast (97%) ETDRS chart displayed on an LCD optotype system (Vision Chart CSO, Florence, Italy). The visual acuity threshold was determined in logarithm of the minimum angle of resolution (logMAR) using a letter-by-letter criterion.26 Dissociated heterophorias either at distance and near, were measured through an alternating cover test and prism bar. Fusional reserves at distance were measured with prism bar. A possible suppression was evaluated by the Worth 4-Dot test at distance, and stereoscopic acuity was measured the circles subtest (Wirt rings) of the Stereo Fly Test (Stereo Optical Co.) at a distance of 40cm with the optical correction at near distance arranged for both eyes in a trial frame.
After the enrolment in the study, each participant was asked to choose a frame among a limited set of frames. Three pairs of glasses with the same chosen frame and the optical prescription determined in the preliminary visual examination were dispensed for each subject with the three different lenses studied, whose properties are reported in the Materials paragraph below. Several psychophysical measurements were collected both on the first day (when glasses were dispensed) and after fifteen days of wear for each type of lens (three phases in Fig. 1). All the measurements were taken with the dispensed glasses. Particular attention was placed on maintaining appropriate primary position of gaze through PAL spectacles when assessing visual performances in PAL group. During these experimental phases, both photopic BCVA (BCVAphotopic) and mesopic BCVA (BCVAmesopic) were measured binocularly through a paper ETDRS chart at 4m. In the photopic condition, the illumination in the room was 450±50lx, while BCVAmesopic was measured in dimming room lighting (8±2lx), after an adaptation period of five minutes in dark room conditions. Different versions of ETDRS charts were used for the measurements of BCVAphotopic and BCVAmesopic in order to avoid a potential learning of the letter array. BCVA under glare (BCVAglare) was measured binocularly at 3m through an high-contrast ETDRS optotype set on an LCD monitor while the subjects were dazzled by two white LED lamps (C.O.I., Italy, mod. 50.041.00) located laterally on the sides of the LCD. The emission spectrum of these LED sources is reported in the inset of Fig. 2, as measured by a spectrophotometer Hamamatsu C10082CAH. Finally, binocular photopic contrast sensitivity (CS) was detected through Functional Acuity Contrast Test (background luminance of 60.0±3.3cd/m2) at 3-meter observation distance and the threshold measured as logarithm of the contrast sensitivity (logCS). The investigated angular frequencies were 1.5, 3.0, 6.0, 12.0, 18.0 cycles/deg.
 and spectrum of human macular pigment taken from the optical density (OD) reported in Werner et al.29 (transmittance=10−OD). Inset: Measured emission spectrum of the white LED lamps used as glare source to measure BCVAglare.")
Transmittance spectrum of the three types of filters (plano lenses) and spectrum of human macular pigment taken from the optical density (OD) reported in Werner et al.29 (transmittance=10−OD). Inset: Measured emission spectrum of the white LED lamps used as glare source to measure BCVAglare.
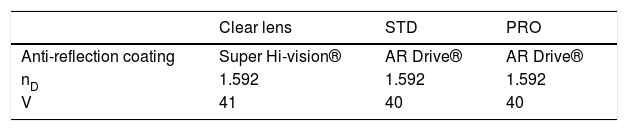
The two types of Drive lenses under investigation were the Standard Drive (STD) and the Professional Drive (PRO) (Hoya, Japan) and the control was a clear lens made with a material (Eyas®, Hoya, Japan) with the same refractive index nD at the wavelength of the Fraunhofer D spectral line (589.3nm). In addition to nD, some other properties of the three filters are reported in Table 2, where V is the Abbe number. The optical transmittance spectra of the three lenses were measured using a Jasco V-650 spectrophotometer. The single vision control lenses were front aspherical standard single vision lenses (Nulux®, Hoya, Japan), the single vision STD and the PRO were both power by power aspherical optimized on back side atoric lenses optimized for a standard position of wear. The progressive additional control lenses were made with a front design approach, 14mm corridor length and power-based variable inset. The STD and the PRO were both FreeForm integrated double surface design with 15mm corridor length, individual inset based on power, individual monocular pupil distance, and working distance that is calculated at standard of 40cm for STD version and at 60cm (dashboard) for PRO version. A precalibration was included to better fit the frame chosen by the single participant.
Study designA diagram showing the study procedure is reported in Fig. 1. A single blind crossover study was performed. Although a double-masked randomised control paradigm is considered by many researchers to be the gold standard in experimental design, the slight yellow appearance of the lenses was easily identifiable by the optometrists involved in data collection. To the best of our knowledge, however, participants were unaware of possible benefits and expected differences between the three lenses under investigation. The study was stratified for type of lens with a balanced randomisation (1:1). In the first phase of the study, each subject received a pair of spectacles with clear lenses to wear for two weeks. In the second phase, half of each group were randomly selected to receive STD lenses, while the other half received PRO lenses, again to wear for two weeks. In the third phase of the study participants were given whichever lens they had not yet worn. Participants were masked to the randomisation scheme, but investigators were not. During these three periods, participants were instructed to wear the spectacles for as long as possible each day. The optometric tests were performed binocularly at the time of the dispensing of each pair (baseline time) and again after each of the two-week periods of wear (post-treatment time). No further visual assessment was carried out during the two weeks of wear. Adaptation or learning effects were controlled by repeating and confirming the measurements with clear lenses at the end of the study (after the third phase). Finally, once the subjects had worn all three lenses, they were asked to make a subjective choice about which lenses they wanted to keep at the end of the study.
Statistical analysisDescriptive statistics was produced for the measurements collected during patients' visits. Numerosity (N) and relative percentage values (%) have been reported for each level of the categorical variables, while for the numerical ones mean, standard deviation (SD), minimum and maximum have been calculated. Analyses were performed for all subjects and separately for SVL and PAL groups, differences between these groups were evaluated using chi-square and t-tests for independent samples (p-value <.05).
For each type of lens (clear, STD, and PRO) a comparison was carried out by t-test to identify similarities between the data collected at baseline and the data collected in the post-treatment phase after fifteen days. A raw comparison between STD drive and PRO drive versus Clear lens was carried out by paired t-test, separately for SVL and PAL group.
Concerning the data collected at the end of the second week of wear, a linear mixed model (recommended for 2×2 crossover trials with baseline measurements27,28) was implemented to compare the 2 lenses (STD DRIVE and PRO DRIVE). In this model, post-treatment measurements of all three investigated types of lenses (Standard, STD DRIVE and PRO DRIVE) have been evaluated. Since measurements with the three filters were performed on the same subject, correlation within the subject was taken into consideration and the single subject was considered in the random effects of the model. In the mixed model, the measurement collected with clear lenses; the sequence of delivery of spectacles and the period were included as fixed covariates. The type of Drive lens (STD or PRO) was also included with the aim to evaluate the differences in the performance between measures of PRO and STD lenses, conditioned to the value observed with the clear lens.28
All analyses were performed using the Statistical Analysis System Software (version 9.4; SAS Institute, Cary, NC, USA). Statistical significance was set at 0.05 level. All p-values were two-sided.
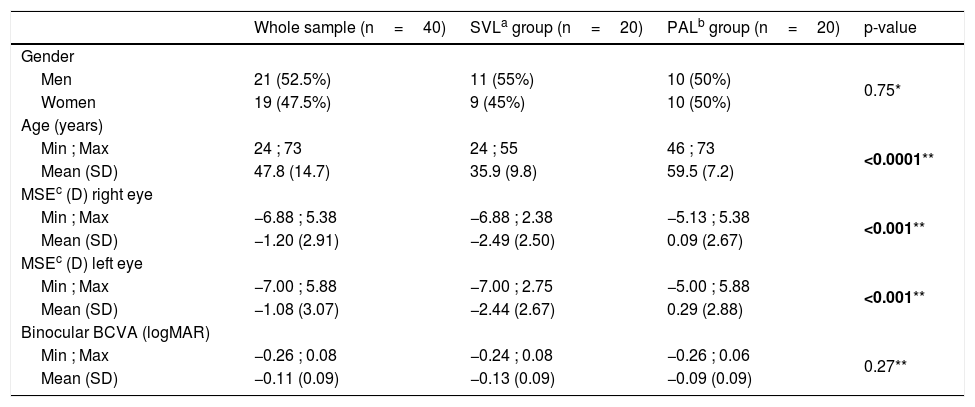
ResultsIn SVL group, 11 males and 9 females (age range: 24–55 years; mean±std dev: 47.8±14.7 years) were enrolled. In PAL group, 10 males and 10 females (age range: 46–73 years; mean±std dev: 59.5±7.2 years) were enrolled. Demographic characteristics of the whole sample, and the two groups separately, are reported in Table 1.
Demographic characteristics and Mean Spherical Equivalent values of the 20 participants to the study, considered as a whole and separately for SVL or PAL lens group.
| Whole sample (n=40) | SVLa group (n=20) | PALb group (n=20) | p-value | |
|---|---|---|---|---|
| Gender | ||||
| Men | 21 (52.5%) | 11 (55%) | 10 (50%) | 0.75* |
| Women | 19 (47.5%) | 9 (45%) | 10 (50%) | |
| Age (years) | ||||
| Min ; Max | 24 ; 73 | 24 ; 55 | 46 ; 73 | <0.0001** |
| Mean (SD) | 47.8 (14.7) | 35.9 (9.8) | 59.5 (7.2) | |
| MSEc (D) right eye | ||||
| Min ; Max | −6.88 ; 5.38 | −6.88 ; 2.38 | −5.13 ; 5.38 | <0.001** |
| Mean (SD) | −1.20 (2.91) | −2.49 (2.50) | 0.09 (2.67) | |
| MSEc (D) left eye | ||||
| Min ; Max | −7.00 ; 5.88 | −7.00 ; 2.75 | −5.00 ; 5.88 | <0.001** |
| Mean (SD) | −1.08 (3.07) | −2.44 (2.67) | 0.29 (2.88) | |
| Binocular BCVA (logMAR) | ||||
| Min ; Max | −0.26 ; 0.08 | −0.24 ; 0.08 | −0.26 ; 0.06 | 0.27** |
| Mean (SD) | −0.11 (0.09) | −0.13 (0.09) | −0.09 (0.09) |
The optical transmittance spectra of three plano lenses (clear, STD, and PRO) are reported in Fig. 2. A cutoff wavelength can be defined as the wavelength corresponding to 50% transmittance. For the clear lens the cutoff is found at (405±2) nm, while the cutoff of STD and PRO is shifted to longer wavelength and it is found at (426±2) nm. Both the STD lens and the PRO lens have a transmittance that does not substantially depend on the thickness of the lens and, therefore, on the optical power. Indeed, the longpass character of these lenses with cutoff at (426±2) nm is due to a bulk internal layer of fixed thickness that the manufacturer has called “high-definition treatment”. In Fig. 2, the spectrum of human macular pigment is also shown as taken from the optical density reported in Werner et al.28 It will be commented in the discussion section.
For each type of lens (clear, STD, and PRO), the comparison between the data collected at baseline (1st day) and the corresponding data collected post-treatment (15th day) showed no significant differences for each condition. Since the measurements did not statistically change during the two weeks of wear, in the further analyses of the data only the values measured at the end of the second week were taken into consideration for each condition (results not showed). Since all the participants received the clear lens as the first lens (Fig. 1), after the third phase the visual analyses were repeated with the clear lens. As no differences were found between the data obtained with the clear lens during the first phase and the data obtained at the end of the project, only the results of the first phase were taken into consideration in the following. Fig. 3 shows the mean values of measured BCVAphotopic, BCVAmesopic, and BCVAglare in the three experimental conditions both for the PAL group (Fig. 3a) and the SVL group (Fig. 3b). No substantial differences were found in BCVAphotopic between Drive lenses (STD and PRO) and clear lenses for either the PAL group or the SVL group. The BCVAmesopic improved significantly only for STD lenses in the PAL group (from 0.15 to 0.12, p<0.05), while no substantial difference was observed for SVL group. Finally, BCVAglare improved with Drive filters compared to the clear one (p<0.05) from 0.03 to -0.02 (STD) and to -0.01 (PRO) for PAL and from -0.08 to -0.12 (STD and PRO) for SVL. Means of measured data of CS are reported in Fig. 4a (PAL group) and b (SVL group) as a function of the angular frequency. CS showed statistically significant improvements with the PRO lens respect to the clear lens only at 6 cycles/deg for the PAL group and at 1.5 cycles/deg for the SVL group (p<0.05). Conversely, the difference between STD and clear lenses become evident and statistically significant at 6, 12, and 18 cycles/deg in the PAL group (p<0.05) but only at 12 cycles/deg in the SVL group.
 and in SVL group (b). Asterisks indicate that the observed difference compared to clear lens is statistically significant (p<0.05, grey asterisks for STD compared to clear lenses, black asterisks for PRO compared to clear lenses).")
Mean values of measured binocular BCVAphotopic, BCVAmesopic, and BCVAglare for the three types of lenses in PAL group (a) and in SVL group (b). Asterisks indicate that the observed difference compared to clear lens is statistically significant (p<0.05, grey asterisks for STD compared to clear lenses, black asterisks for PRO compared to clear lenses).
 and in SVL group (b). Asterisks indicate that the observed difference compared to clear lens is statistically significant (p<0.05, grey asterisks for STD compared to clear lenses, black asterisks for PRO compared to clear lenses).")
Mean values of binocular contrast sensitivity for the three types in PAL group (a) and in SVL group (b). Asterisks indicate that the observed difference compared to clear lens is statistically significant (p<0.05, grey asterisks for STD compared to clear lenses, black asterisks for PRO compared to clear lenses).
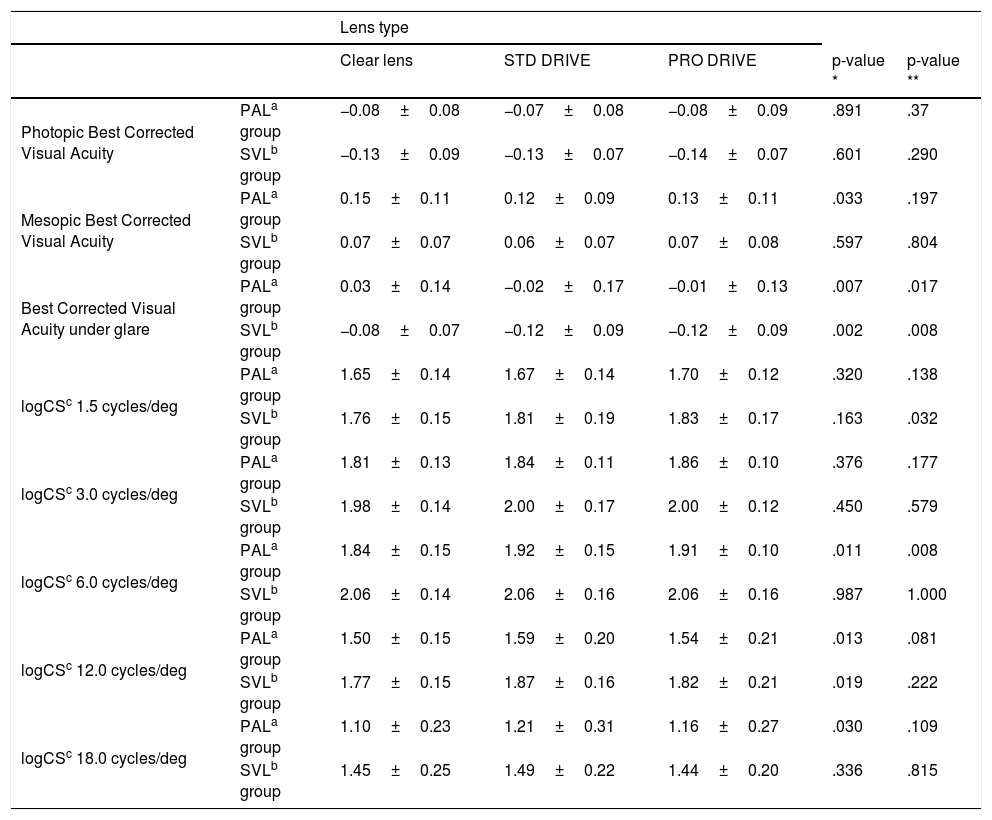
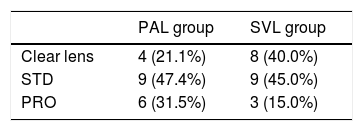
Table 3 shows the corresponding data for each type of lens, including also standard deviations and p-values. Concerning the comparison between the two types of Drive lenses (STD and PRO), both for PAL wearers and for SVL wearers, the 95% confidence interval of the differences was evaluated for each measured variable (conditioned to the value observed with the clear lens). The estimated differences were found to show a 95% confidence interval which contains the null value. The results of the particpants’ subjective choice are reported in Table 4. Most participants in the PAL group chose Drive lenses (15 subjects out of 19, 79%) with only four subjects electing to keep the clear PAL lenses. Drive lenses were also the first choice of participants in the SVL group (12 subjects out of 20, 60%). The difference in the frequency distribution between PAL group and SVL group was not significant (χ2=2.31; n.s.).
Mean, and standard deviation (SD) of the measured values for each variable and each type of lens.
| Lens type | ||||||
|---|---|---|---|---|---|---|
| Clear lens | STD DRIVE | PRO DRIVE | p-value * | p-value ** | ||
| Photopic Best Corrected Visual Acuity | PALa group | −0.08±0.08 | −0.07±0.08 | −0.08±0.09 | .891 | .37 |
| SVLb group | −0.13±0.09 | −0.13±0.07 | −0.14±0.07 | .601 | .290 | |
| Mesopic Best Corrected Visual Acuity | PALa group | 0.15±0.11 | 0.12±0.09 | 0.13±0.11 | .033 | .197 |
| SVLb group | 0.07±0.07 | 0.06±0.07 | 0.07±0.08 | .597 | .804 | |
| Best Corrected Visual Acuity under glare | PALa group | 0.03±0.14 | −0.02±0.17 | −0.01±0.13 | .007 | .017 |
| SVLb group | −0.08±0.07 | −0.12±0.09 | −0.12±0.09 | .002 | .008 | |
| logCSc 1.5 cycles/deg | PALa group | 1.65±0.14 | 1.67±0.14 | 1.70±0.12 | .320 | .138 |
| SVLb group | 1.76±0.15 | 1.81±0.19 | 1.83±0.17 | .163 | .032 | |
| logCSc 3.0 cycles/deg | PALa group | 1.81±0.13 | 1.84±0.11 | 1.86±0.10 | .376 | .177 |
| SVLb group | 1.98±0.14 | 2.00±0.17 | 2.00±0.12 | .450 | .579 | |
| logCSc 6.0 cycles/deg | PALa group | 1.84±0.15 | 1.92±0.15 | 1.91±0.10 | .011 | .008 |
| SVLb group | 2.06±0.14 | 2.06±0.16 | 2.06±0.16 | .987 | 1.000 | |
| logCSc 12.0 cycles/deg | PALa group | 1.50±0.15 | 1.59±0.20 | 1.54±0.21 | .013 | .081 |
| SVLb group | 1.77±0.15 | 1.87±0.16 | 1.82±0.21 | .019 | .222 | |
| logCSc 18.0 cycles/deg | PALa group | 1.10±0.23 | 1.21±0.31 | 1.16±0.27 | .030 | .109 |
| SVLb group | 1.45±0.25 | 1.49±0.22 | 1.44±0.20 | .336 | .815 | |
The first part of this discussion concerns the comparison between the optical properties of the Drive lenses and the clear lens. Three main aspects are discussed: (i) the lower number of transmitted photons in the visible range by the Drive lenses, (ii) the lower chromatic aberration of the Drive lenses and, mostly, the decrease of the chromatic aberration of the eye, and (iii) the decrease of intraocular scattering. Concering the number of transmitted photons in the visible range, a quantitative evaluation depends both on the shape of the transmittance spectrum of the filter under investigation and also on the spectral distribution of the emission of the light source. For Drive filters, this reduction of transmitted light compared to the clear lens can be evaluated as follows. If S(λ) is the emission spectrum of a light source (given in number of photons as a function of wavelength λ), the ratios
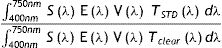
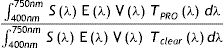
andrepresent the percentage of the total number of photons in the visible range transmitted by the Drive filters compared to the clear lens, where Tclear(λ), TSTD(λ), and TPRO(λ) are the transmittance spectra of the three types of filters (Fig. 2). For example, for the typical emission spectrum S(λ) of a white LED, these ratios were calculated to be 96.0% (STD) and 93.6% (PRO). By assuming a different light source, namely solar radiation, they were calculated equal to 92.9% (STD) and 91.3% (PRO). The calculated values indicate that the attenuation of the total number of photons in the visible range compared to the clear lens is very similar for the two Drive lenses and it is in the range of some percentage points. If radiant energy is converted into luminous energy by taking into consideration the spectral luminous efficiency function V(λ) of the human eye in photopic condition,30 the ratiosandrepresent the percentage of the luminous energy transmitted by the Drive filters compared to the clear lens, where E(λ) is the energy of one photon of wavelength λ (in vacuum). For the typical emission spectrum S(λ) of a white LED, these ratios were calculated to be 95.20% (STD) and 94.4% (PRO). By assuming a different light source, namely solar radiation, they were calculated equal to 95.1% (STD) and 94.4% (PRO).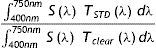

Concering chromatic aberration, the shift of the cutoff from (405±2) nm to (426±2) nm is expected to reduce the chromatic aberration of the human eye. Longitudinal chromatic aberration of the eye is reported by many authors to be of the order of about 2 diopters when considering the whole visible range.31–35 Based on these data reported in the literature, longitudinal chromatic aberration is reduced of about 0.3 diopters when reducing the spectral range form 405–750nm (range of transmission of the clear lens) to 426–750nm (range of transmission of the Drive lenses). Concerning the aberration of the lens itself, the longitudianal chromatic aberration of the clear lens and that of the Drive lenses can be evaluated taking into consideration their Abbe number V and their refractive index at a specific wavelength (Table 1). The difference between clear and Drive lenses was found to be more than one order of magnitude lower than the reduction (∼0.3 diopters) of the longitudinal chromatic aberration of the eye.
Intraocular light scattering can be generated by different components of the eye and it can show different characteristics.19–21,36,37 For example, backward light scattering in the crystalline lens was found to vary with wavelength λ into the nucleus as the reciprocal of the fourth power (λ−4) as predicted by the Rayleigh model.37 Conversely, in the superior layers and for forward directions in the nucleus, light scattering was found to be less dependent on wavelength.37 Intraocular scattering was also found to depend strongly on pigmentation of the eye and age, scattering showing nearly perfect λ−4 dependence only in young and well-pigmented eyes.21 Even if the overall dependence on wavelength can deviate from the perfect λ−4 law, intraocular light scattering is known to typically increase at the shortest wavelengths in the visible range. The effects begin to manifest at the lowest wavelengths in the age period corresponding approximately to the SVL group of this work and then extend to longer wavelength with age. Therefore the Drive lenses, which attenuate light below (426±2) nm, are expected to play a role in reducing intraocular scattering, mainly in the PAL group, but eventually also in the SVL group. The PRO lenses show a weak additional optical band centred at 450nm (Fig. 2), which does not appear in the STD spectrum. This band is due to a surface treatment that differs from the STD lens. Interestingly, this band is very close to the maximum of absorption of the macular pigment of the human eye (also reported in Fig. 2 for comparison), which peaks at about 460nm.28,37,38 Although the function of macular pigment remains uncertain, it is suspected of acting as a natural optical filter, absorbing part of the blue light, thus partially reducing chromatic aberration and intraocular scattering.39–43 In the spectral range of absorption of the macular pigment, between about 430nm and 500nm, it appears that the eye naturally protects itself from scattering and aberration, at least for young and healthy subjects. However, it could be interesting to investigate whether the PRO filter, with its additional band at about 450nm, has positive effects in case of a possibe decrease of macular pigment density in elderly or pathological subjects.
The optometric findings are now discussed. A first result of this study shows that no substantial differences were found in BCVAphotopic between Drive lenses (STD and PRO) and clear lenses for either the PAL group or the SVL group (see Fig. 3 and Table 3). A comparison with data of visual acuity on healthy subjects reported in the literature is not trivial because the optical characteristics of the filters discussed in the literature are different. For example, Zigman et al.6 found visual acuity improvement in healthy subjects when using a filter with absorption below the cutoff of 480mm. The filters under investigation in this work, which are found to produce no substantial visual acuity improvement, show a cutoff at much shorter wavelength than 480nm (426±2nm, Fig. 2). However, this should not lead to the conclusion that the improvement occurs when the cutoff increases. Indeed, Barron and Waiss11 measured visual acuity differences using a Corning CPF527 filter and a clear lens. Notwithstanding the relatively long cutoff wavelength, no significant differences were observed by these authors in average visual acuity compared to clear lenses. They concluded that a possible subjective impression of better vision was not equivalent to the conventional definition of visual acuity as measured with a high contrast chart. Other studies concern cataract or low-vision subjects. Also in these cases, different types of filters were studied, mixed results can be found in the literature, and there is little conclusive evidence that blue-filtering lenses improve visual acuity.6,7,10,11 Concering the Drive lenses under investigation in this work, the reduction of chromatic aberration and intraocular scattering due to the shift of the cutoff (discussed above) are not accompanied by a significant improvement in BCVAphotopic. Also the additional band at 450nm of the PRO lens does not seem to produce detectable effects in BCVAphotopic.
The other optometric analysis carried out in photopic condition is the CS assessment. The first point concerning CS is the comparison between clear lens (black diamonds in Fig. 4) and STD (gray circles and gray asterisks in Fig. 4). In general, as can also be observed in Table 3, all mean data of CS taken with STD type are equal or better compared to the corresponding value for the clear lens. No statistically significant improvement at the lowest angular frequencies is found in both groups (PAL and SVL). In the PAL group the differences become evident and statistically significant at 6, 12, and 18 cycles/deg (p<0.05; Fig. 4a and Table 3). In the SVL group the difference between STD and clear lens is significant only at 12 cycles/deg (Fig. 4b). Data for the other Drive lens (PRO) show that all mean data of CS taken with PRO type are equal or better compared to the corresponding value for the clear lens (Table 3, Fig. 4). CS is statistically better than CS with clear lenses at 6 cycles/deg in the PAL group (black asterisk in Fig. 4a), and at 1.5 cycles/deg in SVL group (black asterisk in Fig. 4b). In the literature, mixed results are reported. For example, Zigman found that a yellow filter improved significantly CS of subjects with healthy eyes in the 3–12 cycles/deg range of spatial frequency.8 On the contrary, blue-light filtering spectacle lenses did not significantly affect the contrast sensitivity in a recent study of Leung et al.16 In the present work, a certain degree of improvement of photopic CS by Drive lenses can be inferred compared to the clear lens. Compared to BCVAphotopic, the measurement of CS is a more complete assessment of visual performance,44,45 thus making the effects due to the shift of the cutoff detectable, at least at some angular frequency. This improvement can be mainly attributed to a reduction of intraocular scattering, which is known to play a major role in CS reduction.46,47 On the other hand, the reduction (about 0.3 diopters) of the eye chromatic aberration with the Drive lenses is not expected to play a role in improvimng CS. Indeed, the spectral luminous efficiency of the human eye in photopic condition is relatively low at the shortest wavelengths in the visible range.30 Experimental evidence was provided by Kruger et al.,33 who found no differences when measuring CS with or without a neutralizing lens in place. The neutralizing lens was designed to focus all wavelengths approximately in the same plane in the eye so that there was no longitudinal chromatic aberration. As the effect on CS is absent by neutralizing the aberration, it is expected to be absent even chromatic aberration is partially reduced (∼0.3 diopters), as in the case of Drives lenses. As can be observed for the PAL group in Fig. 4a, it happened at several angular frequencies that the STD lens was better than the clear lens (three grey asterisks in Fig. 4a) compared to how many times it happened with the PRO lens (one black asterisk in Fig. 4a). However, the direct comparison between the two lenses did not support any significant difference between STD and PRO. Indeed, when comparing the two Drive lenses, based on 95% confidence interval for CS data, there was no statistical evidence of difference between them. Therefore, the possible positive effects of the additional band at 450nm is not sufficiently marked to generate, on average, a detectable variation in SC tests, even in the older subjects of the PAL group.
In addition to BCVAphotopic, BCVAmesopic has been studied in this work and, although clinically small, a statistically significant improvement compared to the clear lens was observed. BCVAmesopic changed in PAL group from 0.15 logMAR to 0.12 logMAR in the case of STD (p<0.05) and to 0.13 logMAR in the case of PRO. No substantial differences were observed between the three lenses for BCVAmesopic in the case of SVL group. It is well known that the curve of the spectral efficiency of the human eye depends on the environmental conditions. In mesopic condition, the maximum of the curve shifts toward the blue compared to the maximum in photopic condition (Purkinje shift). For this reason, intraocular scattering of blue light, especially in older subjects, acquires more relevance in mesopic conditions. This might explain the positive role of the Drive lenses in improving BCVAmesopic of the PAL group. Although it is expected both a reduction of the intraocular scattering and a reduction of the chromatic aberration of the eye with the Drive lenses, it is reasonable to assume that the improvement of BCVAmesopic is mainly attributable to the reduction of the scattering.
In this work, the main improvement was found under glare conditions. Both STD and PRO showed better BCVAglare performances than clear lenses and the improvement was statistically significant, about 0.05 logMAR, for both PAL group and SVL group. Concerning the direct comparison between the two Drive lenses, no statistical evidence of differences in BCVAglare was found both in PAL group and SVL group. A reasonable explanation for the improvement of BCVAglare by a blue-filtering lens is again the attenuation of intraocular scattering, which is known to play a relevant role under glare.19–21,48 It is known that intraocular scattering increases gradually with age.19–21 As already discussed, the effects begin to manifest at the lowest wavelengths in the age period corresponding approximately to the SVL group. In older subjects, the effect at the lowest wavelengths increases and it also extends to longer wavelengths. The zero transmittance of the Drive lenses in the blue region up to (426±2) nm attenuates intraocular scattering. Since this spectral range corresponds to a rerion of scattering even in the age range between about 30 and 50 years, the Drive lenses are also effective in reducing intraocular scattering in the SVL group, not only in the the PAL group. Also Mahjoob et al.9 recently reported the positive effect of a yellow filter on visual acuity under glare, though the improvement was only significant in subjects aged 51–60 years. However, the only information available about the spectral characteristics of this yellow filter is the total light transmission (80%). It is not specified whether the reduction in transmittance is due to the presence of a specific absorption band centred somewhere in the blue spectral region or to the shift of the cutoff as occurs in longpass filters.
The subjective preference of the participants (Table 4) confirms, in some way, the visual performance outcomes. Most participants chose Drive lenses (STD: 18, PRO: 9), in agreement with the psychophysical tests where the Drive lenses actually produced overall better results compared to the clear lens. One could argue that this preference may be affected by a sort of recency effect i.e. the tendency for people to be most influenced by what they have last experienced. It is worth mentioning that only 6 out of 18 who chose STD lenses and 5 out of 9 subjects who chose the PRO lens had used these lenses in the third phase. Notwithstanding this, it cannot be excluded that only a minority chose the clear lens because of the order in which the three filters were worn. As shown in Fig. 1, in fact, all the participants wore the clear lens for the first fifteen days. The optometric data were acquired again at the end of the project with the clear lens and there were no differences with respect to phase 1, but the order may have influenced the subjective choice.
ConclusionsThe effects of colored filters on visual performance is dependent on the balance between the possible reduction of chromatic aberration and intraocular light scattering vs. the undesirable though unavoidable reduction of transmitted light intensity. STD and PRO Drive lenses are longpass transmittance filters with cutoff at (426±2) nm, shifted to longer wavelength of about 20nm compared to a clear control lens. The only difference between STD and PRO is an additional band centred at about 450nm in the PRO spectrum, in the same spectral region of the absorption of the human macular pigment.
Both Drive lenses are found to maintain or improve some visual functions compared to the clear lens. The improvement of photopic contrast sensitivity at some angular frequencies, mesopic visual acuity, and visual acuity under glare is mainly attributed to the reduction of intraocular light scattering as a consequence of the total light attenuation in the blue spectral range below the cutoff. The improvement is observed in older subjects (age range: 46–73 years, PAL group). For younger subjects (age range: 26–55 years, SVL group), it is detectable for all but mesopic visual acuity.
Conflicts of interestHoya Corporation Vision Care (Tokyo) partly funded this study. Natalia Vlasak and Silvano Larcher are fully employed in Hoya Vision Care. All the other authors report no conflicts of interest and have no proprietary interest in any of the materials mentioned in this article.
This was a collaborative research supported by HOYA Corporation, Tokyo, Japan. The authors thank the employees of Hoya who participated in the calculation, ordering, and manufacturing of the lenses. Co-authors Natalia Vlasak and Silvano Larcher provided spectacles and the employee of Hoya.


