


This study aims to compare the results of the Finger Count Test (FCT) for “Counting fingers” (CF) and “Hand movement” (HM) with the visual acuity (VA) obtained from the Berkeley Rudimentary Vision Test (BRVT) in low vision patients with different pathologies.
MethodsUncorrected visual acuity was estimated using BRVT and using the corresponding CF or HM in 38 low vision patients (VA range between 1.40 and 3.50 logMAR). Detailed ocular pathologies were recorded for each patient. Patients were categorized into two groups: one with severe visual field defects (constrictions of the central visual field or central scotomas) due to any cause and a general group which included all other ocular pathologies.
ResultsThe mean age was 67 years, with an age range from 26 to 92 years. The General group revealed a median VA of 2.00 logMAR for CF and 2.60 logMAR for HM (p < 0.001). This study showed a large variation of VA from BRVT in the Visual field group and considerable overlap with the VA results for CF and HM; with a median VA of 2.10 logMAR for CF and 2.30 logMAR for HM (p = 0.824).
ConclusionThe VA found in this study for CF confirmed values from earlier studies, while VA for HM was found to be slightly worse. These findings allow a translation of older VA data of CF and HM to logMAR for proper statistical analysis. Patients with central visual field defects showed a large variation of measured VA with BRVT.
Visual Acuity (VA) is one of the most important parameters for diagnosing patients with low vision and quantifying the extent of their visual impairment, along with their visual field. This parameter also helps determine the progression of pathologies associated with low vision. Standard VA charts like ETDRS or LCD screen systems like VistaVision, used in our clinic, allow quantification of VA down to 1.60 logMAR.1
Until recent years, there were not standardized tests to assess VA in low vision patients. The classic method was the so-called Finger Count Test (FCT), which includes counting fingers (CF) and hand movement (HM).2,3 This semi-quantitative clinical scale was widely used worldwide and is easy to perform in any optometric or ophthalmology clinic. However, it comes with inherent variations, depending on finger and hand size, and the distance between the tested eyes and the person conducting the test. The method of CF and HM is not an accurate and its use should be discouraged.4
The ETDRS test (Early Treatment of Diabetic Retinopathy Study) follows the design principles of the Bailey-Lovie chart, it is well standardized and was originally used in clinical trials. The protocol of this optotype requires carrying out the test at 4 m (VA range from −0.30 to 1.00 logMAR), and it can be reduced to 1 meter (VA range from 1.10 to 1.60 logMAR).1 In cases of low vision, the discrimination of very large letters or tests at short distances requires the patient to scan through a relatively large area. This can make it difficult for the patient and the optometrist obtaining VA, especially in cases of visual field involvement, with the presence of central scotomas, or with corneal pathologies such as central leucoma or a corneal decompensation due to a loss of endothelial cells. It usually makes patients lose track of the row, and it can also cause fatigue and demoralization, which hinders both the patient and the optometrist in measuring VA. In these cases, grating can be a good alternative. The best-known grating test is the Teller Test, or preferential vision test, which is commonly used in paediatric patients and based on primary reflexes that manifest from fixation to a cognitive age of 3 years.5,6
A newly developed test is the Berkeley Rudimentary Vision Test (BRVT), which is made up of a set of cards that have been developed for patients with severe low vision. These 25 × 25 cm cards are three pairs of sheets which show the tests on both sides. The first pair of cards contains an optotype with the letter E in four different sizes, which can be evaluated at two specific distances, 1 meter or 25 cm, which provides eight different VA measures from 1.40 to 2.60 logMAR. The second pair of cards contains four gratings with different frequencies covering an even lower VA range from 2.30 to 2.90 logMAR. The last pair of cards comprises two sheets for partial white-black discrimination.7
There are other tests designed to measure VA in low vision, such as the Freiburg Vision Test (FrACT). This is a computerized test that features a large Landolt Type C optotype. It is free software and available for the usual operating systems that requires a computer with a 17-inch monitor. Its VA range is −0.30 to 1.70 logMAR at 4 m, 0.10 to 1.30 logMAR at 1 meter, and 0.40 to 2.40 logMAR at 0.5 m. It uses an algorithm that performs an estimation of the parameters by sequential testing, which allows estimating the VA and presenting more optotypes close to the patient's VA threshold. This algorithm, combined with a smoothing effect of Landolt's C contours and test smearing, provides automatic assessment of VA, contrast sensitivity, and vernier sharpness.8,9
A comparison showed that the BRVT was faster to conduct (median 7 min) compared to FrACT (median 9 min), but FrACT was able to quantify vision numerically in a greater proportion of eyes.10 Our hospital decided to replace the Finger Count Test with BRVT because it is simple to explain the procedure to the patient, yet quantitative and reproducible. It is easy to perform without the need for a computer with a specific monitor. Furthermore, it allows to measure VA down to 2.90 logMAR.
Our aim was to find a translation of earlier VA notations of CF and HM to current BRVT results in logMAR. This is especially important for evaluating the clinical results of interventions which require life-long follow-up, like for instance keratoprosthesis. This means a lot of VA data with CF and HM from the past decades. Statistical analysis of such data can only be done if all VA data during follow-up can be translated into logMAR.
To our knowledge, an equivalent of CF and HM in logMAR has only been theoretically estimated by Holladay11 and measured with one apparatus (FrACT) by one research group (Bach).9,12 They found a considerable overlap between CF and HM, probably caused by the variety of underlying pathologies. Therefore, we decided to record details of the patients' ocular pathologies and evaluate patients with central visual field defects separately in order to check possible effects on the desired CF/HM quantification.
Material and methodsRetrospective data was collected from 38 patients who have been visited between January 2020 and May 2021. The tenets of the Declaration of Helsinki and of the World Medical Association were followed. The standard test for normal vision patients at our center is VistaVision (DMD, Italy). This is displayed at a TFT LCD screen (24-inch screen, 1920 × 1080 pixel, 250 cd/m2) at 4 m using numbers. It covers a VA range from −0.20 to 1.60 logMAR. Before performing any of the low vision tests, we made sure that the patient did not see the largest optotypes of the VistaVision screen at 4 m, corresponding to 1.60 logMAR. This was the inclusion criterion. The exclusion criterion was vision worse than “Hand movement”.
First, all tests were performed without correction to estimate Uncorrected Visual Acuity (UCVA). Then, Best Corrected Visual Acuity (BCVA) was estimated with the necessary refraction. If BCVA was better than 1.60 logMAR, the assessment would include tests with VistaVision at 4 m. All patients were measured first using the Berkeley Rudimentary Vision Test (BRVT) and thereafter assessed with the Finger Count Test (FCT) method. For the present evaluation, data from subjects examined by the same optometrist was collected. The examination room was illuminated properly with an illuminance of 275 lx at the central desk. All tests were performed monocularly, with a trial frame and the unmeasured eye covered by an occluder and an additional tissue to ensure that the untested eye was well covered. To avoid statistical bias, we evaluated only one eye per patient, the eye with worst VA. Details of BRVT and FCT as well as the specific procedures are given in the Appendix.
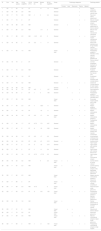
Basic information about the patients is given in Table 1: eye side, sex, age, UCVA, cylinder refraction, spherical refraction, BCVA and ocular pathologies. Patients were categorized according to their pathologies into five pathology categories:
- 1)
Corneal pathologies, including those that produce opacities or leukomas that hinder vision, corneal deformations that cause high aberrations in the quality of vision, or alterations in the different layers of the cornea.
- 2)
Patients with alterations in the crystalline lens, including opacities, cataracts, aphakia and any disorder that affects the transparency of the crystalline lens.
- 3)
Patients with glaucoma, closely related to visual field impairments, presenting scotomas and reductions in visual field, as well as optic nerve impairment due to increased intraocular pressure.
- 4)
Pathologies that affect the different structures of the retina, such as detachments, membranes, scars and atrophies with affectations in any of the different layers of the retina.
- 5)
Pathologies derived from their high myopia, which in most cases causes deterioration of the retina and its structures, with posterior staphyloma and chorioretinal atrophy being the most common.
Patient characteristics and results.
These pathology categories were only used for descriptive analysis, because the majority of patients have multiple pathologies. Statistical analysis was done for a general group and a visual field group (Table 1).
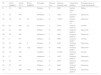
The "Visual field" group included all patients who had central visual field defects, regardless of whether if it was caused by scotomas, corneal leukoma, glaucoma, myopia, damage to the retina or optic nerve. Perimetry was done with correction for BCVA. The used apparatus, stimulus size and intensity are given in Table 2. Patients whose visual field extent was 15° or less were part of this group. Patients with central scotoma were also included, and the severity in this case was characterized on a scale from 1 to 5, where 1 indicated the least involvement or a smaller scotoma, and 5 indicated that the scotoma occupied practically the entire central field, considering the 30° as a reference (Table 2). The “General group” included all other patients with various ocular pathologies (Table 1).
Visual filed related specifications and results.
Out of the total 38 patients studied, 66 % were women, and 34 % were men. The mean age was 67 years, with a range from 26 to 92 years (Table 1). Most of the patients presented multiple pathologies. The most frequent were retinal disorders, which affected 31 patients (82 %). This was followed by pathologies related to high myopia, with 18 patients (47 %), and glaucoma, with 11 patients (29 %). Additionally, 6 patients (16 %) presented alterations related to the crystalline lens, and 8 patients (21 %) had corneal disorders. Individual pathologies for each patient are indicated in Table 1 as well. Overall, 24 patients were assigned to the “General” evaluation group (63 %), 14 patients in the “Visual field” group (37 %),
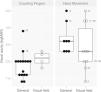
Patients with VA of “Counting fingers” revealed a median of 2.00 logMAR in the “General” group and 2.10 logMAR in the “Visual field” group. Patients with VA of “Hand movement” revealed a median of 2.60 logMAR in the “General” group and 2.30 logMAR in the “Visual field” group (Fig. 1 and Table 3).
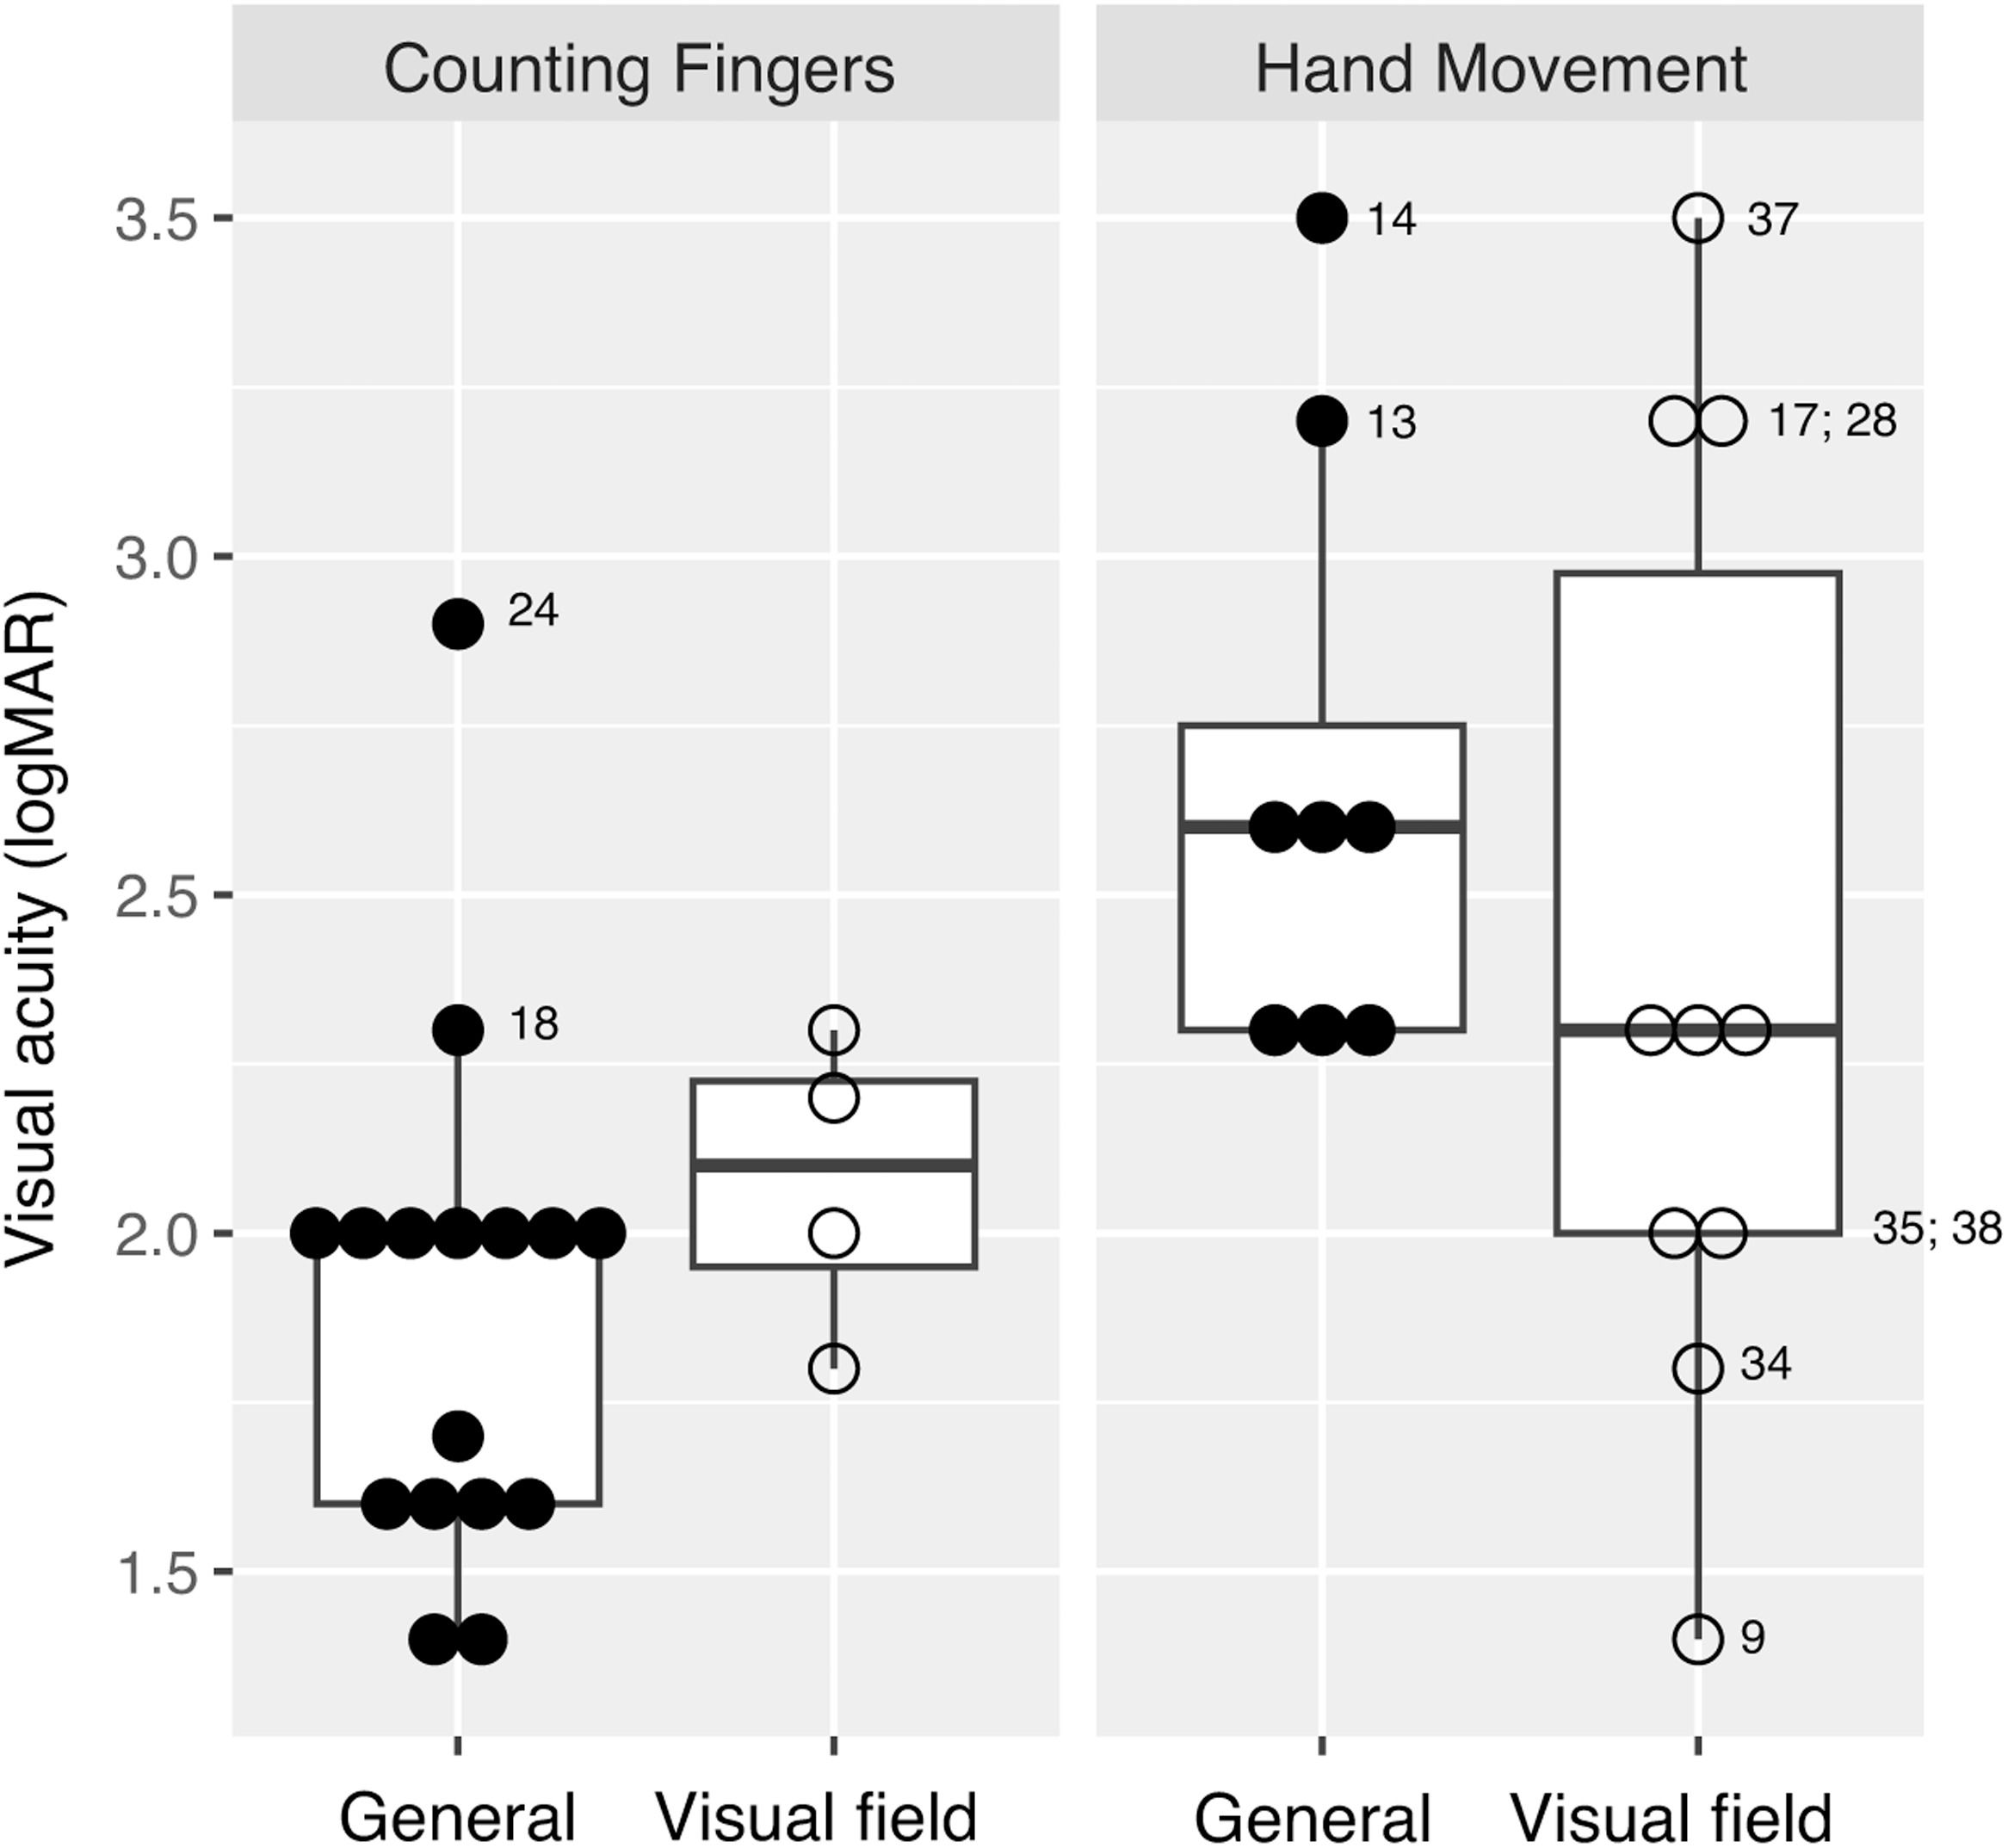
Visual acuity estimated with Berkeley Rudimentary Vision Test in logMAR for Counting fingers and Hand movement subdivided by patient groups. Boxplots with median and interquartile range. Patients with unexpected values or extreme VA results are shown with ID number corresponding to Table 1. Filled circles represent cases from the General group and the open circles from the Visual field group.
Results.
VA, visual acuity; IQR, interquartile range; n, number of cases.
p-value from Mann-Whitney U test; Counting fingers versus Hand movement.
Patients in the Visual field group with “Counting fingers” VA showed a median of 2.10 logMAR, and a median of 2.30 logMAR with “Hand movement” VA, which was not a statistically significant different (Mann-Whitney U test with p = 0.824). Furthermore, the individual VA results for the HM cases ranged from 1.40 to 3.50 logMAR in the visual field group, with considerable overlap between CF and HM (Fig. 1). The difference between CF and HM in the General group was significant (Mann-Whitney U test with p < 0.001) (Table 3).
Patient 24 showed considerably worse VA obtained with BRVT compared to the other cases with CF. This was the only patient with keratoconus, and one of the three patients with a spherical refraction of more than −17 diopters. This patient had a flat SimK of 38.9 D, a steep SimK of 44.8 D, a total root mean square wavefront error of 5.85 micrometer, a central corneal thickness of 500 micrometer, and the thinnest point of the cornea was 456 micrometer (obtained with Galilei G4).
Patients 13, 14, 17, 28 and 37 showed very compromised VA between 3.20 and 3.50 logMAR when it was measured using BRVT, and all cases presented HM results with FCT. Three of them had severe optical opacities (cataract and/or corneal opacity) (ID 13, 14, 28). Furthermore, three had visual field defects (ID 17, 28, 37). All of them had a combination of different anterior and posterior ocular pathologies.
Patients 9. 34, 35 and 38 obtained VA results using BRVT that should have corresponded to CF. However, they presented HM results with FCT. All of them had visual field defects, as well as a combination of different anterior and posterior ocular pathologies. Three of them had corneal or lens opacities (9, 34, 35).
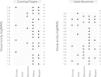
VA results using BRVT were sorted in decreasing order and shown for each pathology category, split for CF and HM (Figure 2). Most patients had multiple pathologies; more pronounced in patients measured with HM. All patients with (severe) lens pathologies were found with HM. All cases better than 2.3 logMAR among HM had visual field problems. No clear pattern of VA obtained with BRVT and ocular pathologies was visible.
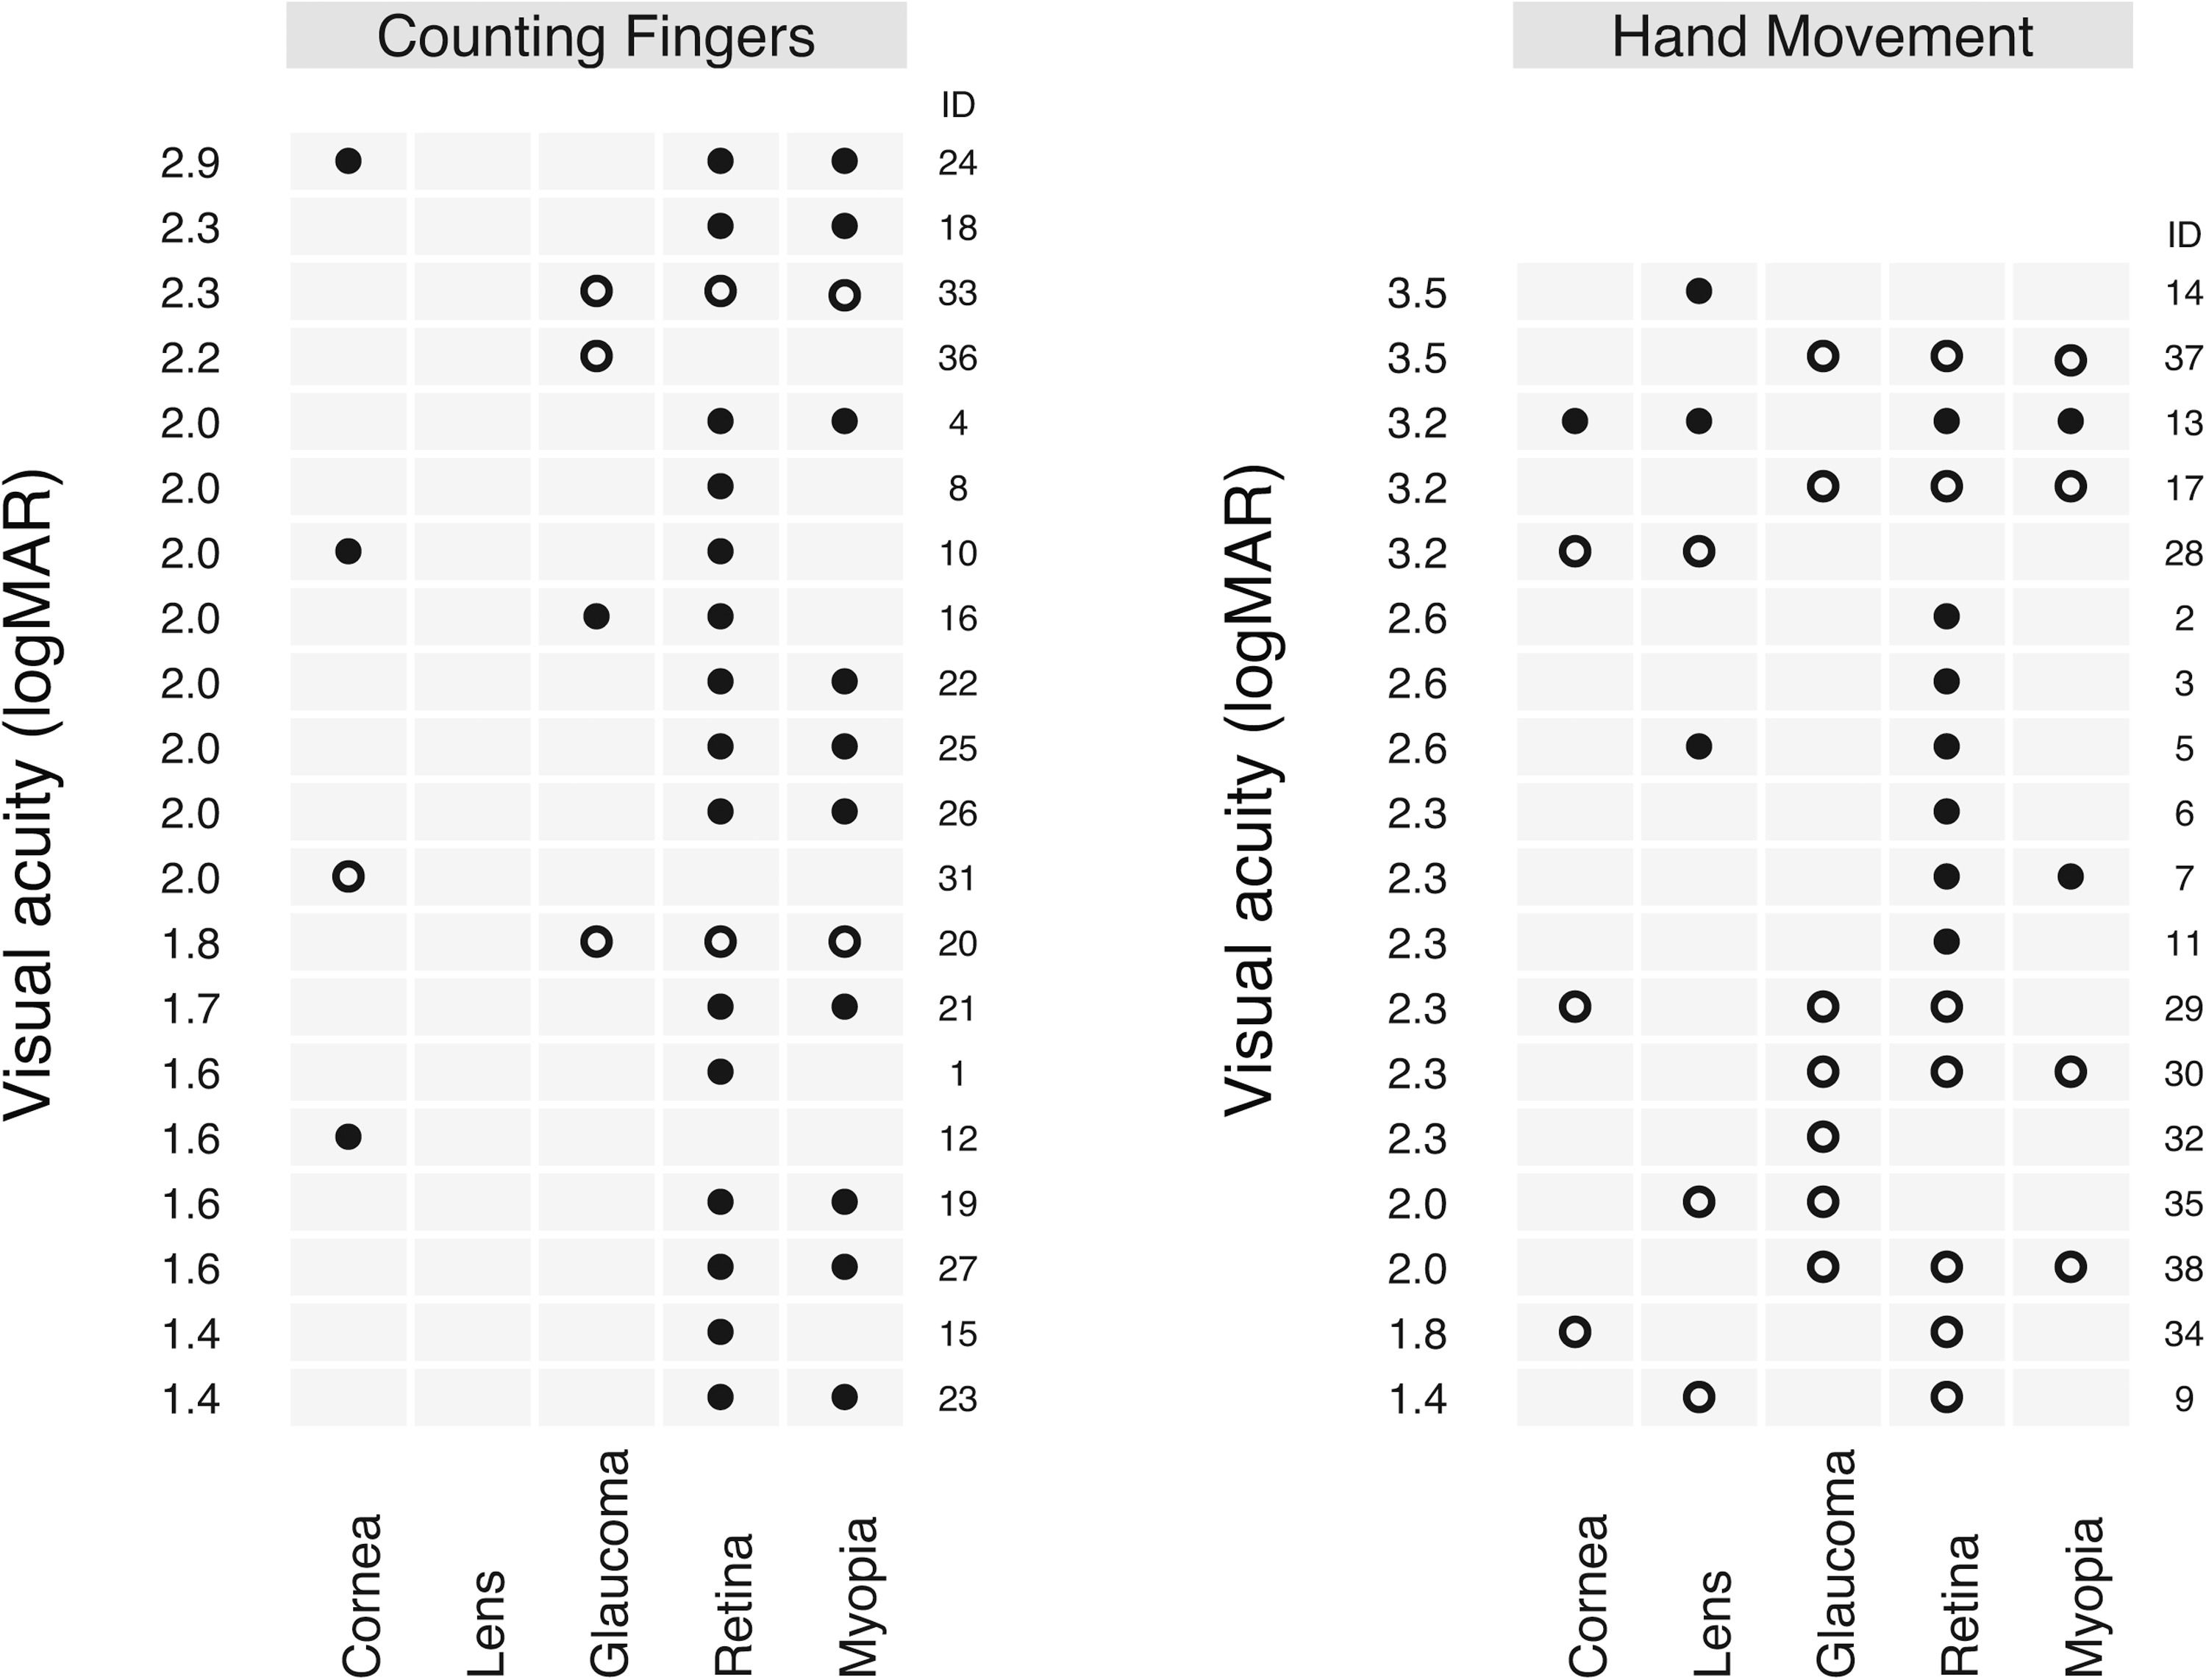
Visual acuity estimated with Berkeley Rudimentary Vision Test in logMAR for Counting fingers and Hand movement subdivided by pathology groups (Cornea, Lens, Glaucoma, Retina, Myopia). Patient ID number is given corresponding to Table 1. Filled circles represent cases from the General group and the open circles from the Visual field group.
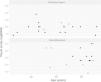
The main VA results were plotted as a function of age; split for CF and HM (Fig. 3). All patients with HM were older than 50 years. No tendency of better or worse VA because of age could be found, not for patients with CF, nor with HM.
Discussion
Both Finger Count Test (FCT) and Berkeley Rudimentary Vision Test (BRVT) are simple and low-tech approaches to estimate VA in low vision patients; no electric screen, no computer or software is needed to perform the tests. CF is related to the thickness and length of the fingers, comparable to the lines of a tumbling E or grating (STE or GA of BRVT). HM is related to the size of the hand, but it also involves movement and therefore it is more difficult to compare with WFD and BWD of BRVT. BRVT does not involve moving the target and it is more standardized as FCT with respect to performing the test. Other main differences are the varying contrast of skin color against a white background and the high black and white contrast of the BRVT cards. FCT provides 2 ordinal scale values (CF and HM) in a range between 1.4 and 3.5 logMAR whereas BRVT allows quantification on a decimal scale with 13 distinct values within the same range (Fig A1).
We found for CF at 30 cm distance an average VA of 2.00 logMAR with BRVT, which corresponds to the STE 25 M card at 25 cm distance (Fig. 1a). The tumbling E on this chart has a line thickness of 7.2 mm with high contrast (black on white background). The examiners fingers used for CF have a thickness between 13 and 18 mm, but they have a lower contrast (skin color on white background), and they are presented somewhat further away (30 instead of 25 cm). This reveals a reasonable theoretical agreement, considering that the fingers are thicker, have less contrast and are presented further away. Employing the calculations suggested by Karanjia et al.13 which utilize the width of the examiner's digits and the inter-digit distances (in the present study 15.4 mm) gives an estimate of 1.63 logMAR for CF. This VA is somewhat better compared to the experimental results in this present study of 2.00 logMAR.
In some cases, we found a discrepancy between the VA taken with FCT and the VA measured using BRVT, which may be due to effects of contrast sensitivity (Patients 9, 34, 35 and 38). The patient had probably difficulties to see the lower contrast fingers compared to the high contrast BRVT black lines. Some pathologies, especially those in which the transparency of the media is affected, whether by a cataract, a corneal leukoma or some retinal pathologies, are known to affect the contrast sensitivity of the patient.
Patient 24, who had probably the most severe optical aberrations in the cohort, presented the worst VA measured using BRVT among the cases which reached CF with FCT. Corneal topography indicated high level of aberration caused by astigmatism, along with third-order coma aberrations. These aberrations affect the gratings and lines of the tumbling E of BRVT more than the finger recognition of FCT. Changing fingers in different positions are probably easier to see than the lines of a grating. This limitation in letter acuity is known from the literature to be caused by optical aberrations.14 Severe optical aberrations, as seen in patient 24, deform the image of a grating and make it difficult for the patient to distinguish even between horizontal and vertical orientation.15
We could not find an effect of the type of ocular pathology (Fig. 2) or age (Fig. 3) on the VA results of BRVT, except for severe visual field defects. Some studies showed an influence of astigmatism and type of astigmatism on VA results in low vision.16 We could not see any effect of astigmatism to explain unexpected or extreme results in the present study. Optical aberrations which remained after spectacle correction seemed to have a greater impact on the VA results.
There was a considerable overlap of the VA results for CF and HM for the Visual field group. While performing the BRVT, it was noticed that patients with visual field defects had problems distinguishing the test charts. These patients had acquired eccentric viewing due to loss of foveal function. They had to move their heads to find the BRVT test chart. The more pronounced the visual defect, the more the difficulty to discern the test charts. This was also noted when the test charts were changed, since the patient had to reposition herself or himself. Additionally, the peripheral retina has a different potential for visual tasks than the central retina. All these issues probably produced variations in the VA results obtained in patients who presented visual field defects. It has been reported earlier that visual field defects are more related to letter charts than to grating charts,17,18 introducing another source of variations between the BRVT grating and letter charts.
Concerning the FCT, CF would be easier to miss with visual field defects as compared to HM. A moving hand would be easier to see because of the movement in and out of areas without visual field defects. Therefore, VA testing in patients with visual field defects was not only more challenging, but also resulted in much more variability for the VA results. Therefore, we reported the results separately for the Visual field group. Scotoma grade 3, 4 and 5 were only found in patients with HM, not with CF. These patients were probably able to notice the examiners hand because of the movement, but not the presented fingers (Table 2).
In the presence of severe scotomas, it is difficult for the examiner and the patient to find visual field areas with remaining vision. These areas are probably sometimes missed and a worse VA is recorded, than the patient had in his or her small remaining visual field. This was probably the case for patient 17 and 37 with best VA of 3.2 and 3.5 logMAR recorded with BRVT, where a visual field test was however possible to obtain (Table 2). On the other hand, HM with FCT may be questionable for patients 9 and 34, where 1.4 and 1.8 logMAR were obtained with BRVT. Here remaining areas of the visual field with useful vision were probably missed with FCT, but not with BRVT (Table 2).
Chart reading distance may be important in patients with uncorrected refractive errors. However, the focal distance for cases with high myopia (−6 diopters and more negative values) is 16.6 cm or less. Which means that they could neither focus on charts presented at 100 cm nor at 25 cm as used in the present study and thus, the use of different chart viewing distance should not have had an influence on VA estimation with BRVT.
After having performed and evaluated the BRVT, we would like to propose two improvements. First, we suggest to start the BRVT with the STE 100 M card at 100 cm and not according to the current protocol with the STE 25 M card at 100 cm (Figure A1). This would allow to evaluate a greater VA range without missing a single measurement between 1.40 and 1.60 logMAR (detailed explanation in the Appendix). Second, we suggest to adapt the GA cards at 25 cm distance to cover VA values from 2.60 to 3.20 logMAR instead from 2.30 to 2.90 logMAR. This would result in the overlap of only one VA value (at 2.60 logMAR) between STE 25 cm and GA 25 cm; similar to the overlap between STE 100 cm and STE 25 cm (at 2.00 logMAR).
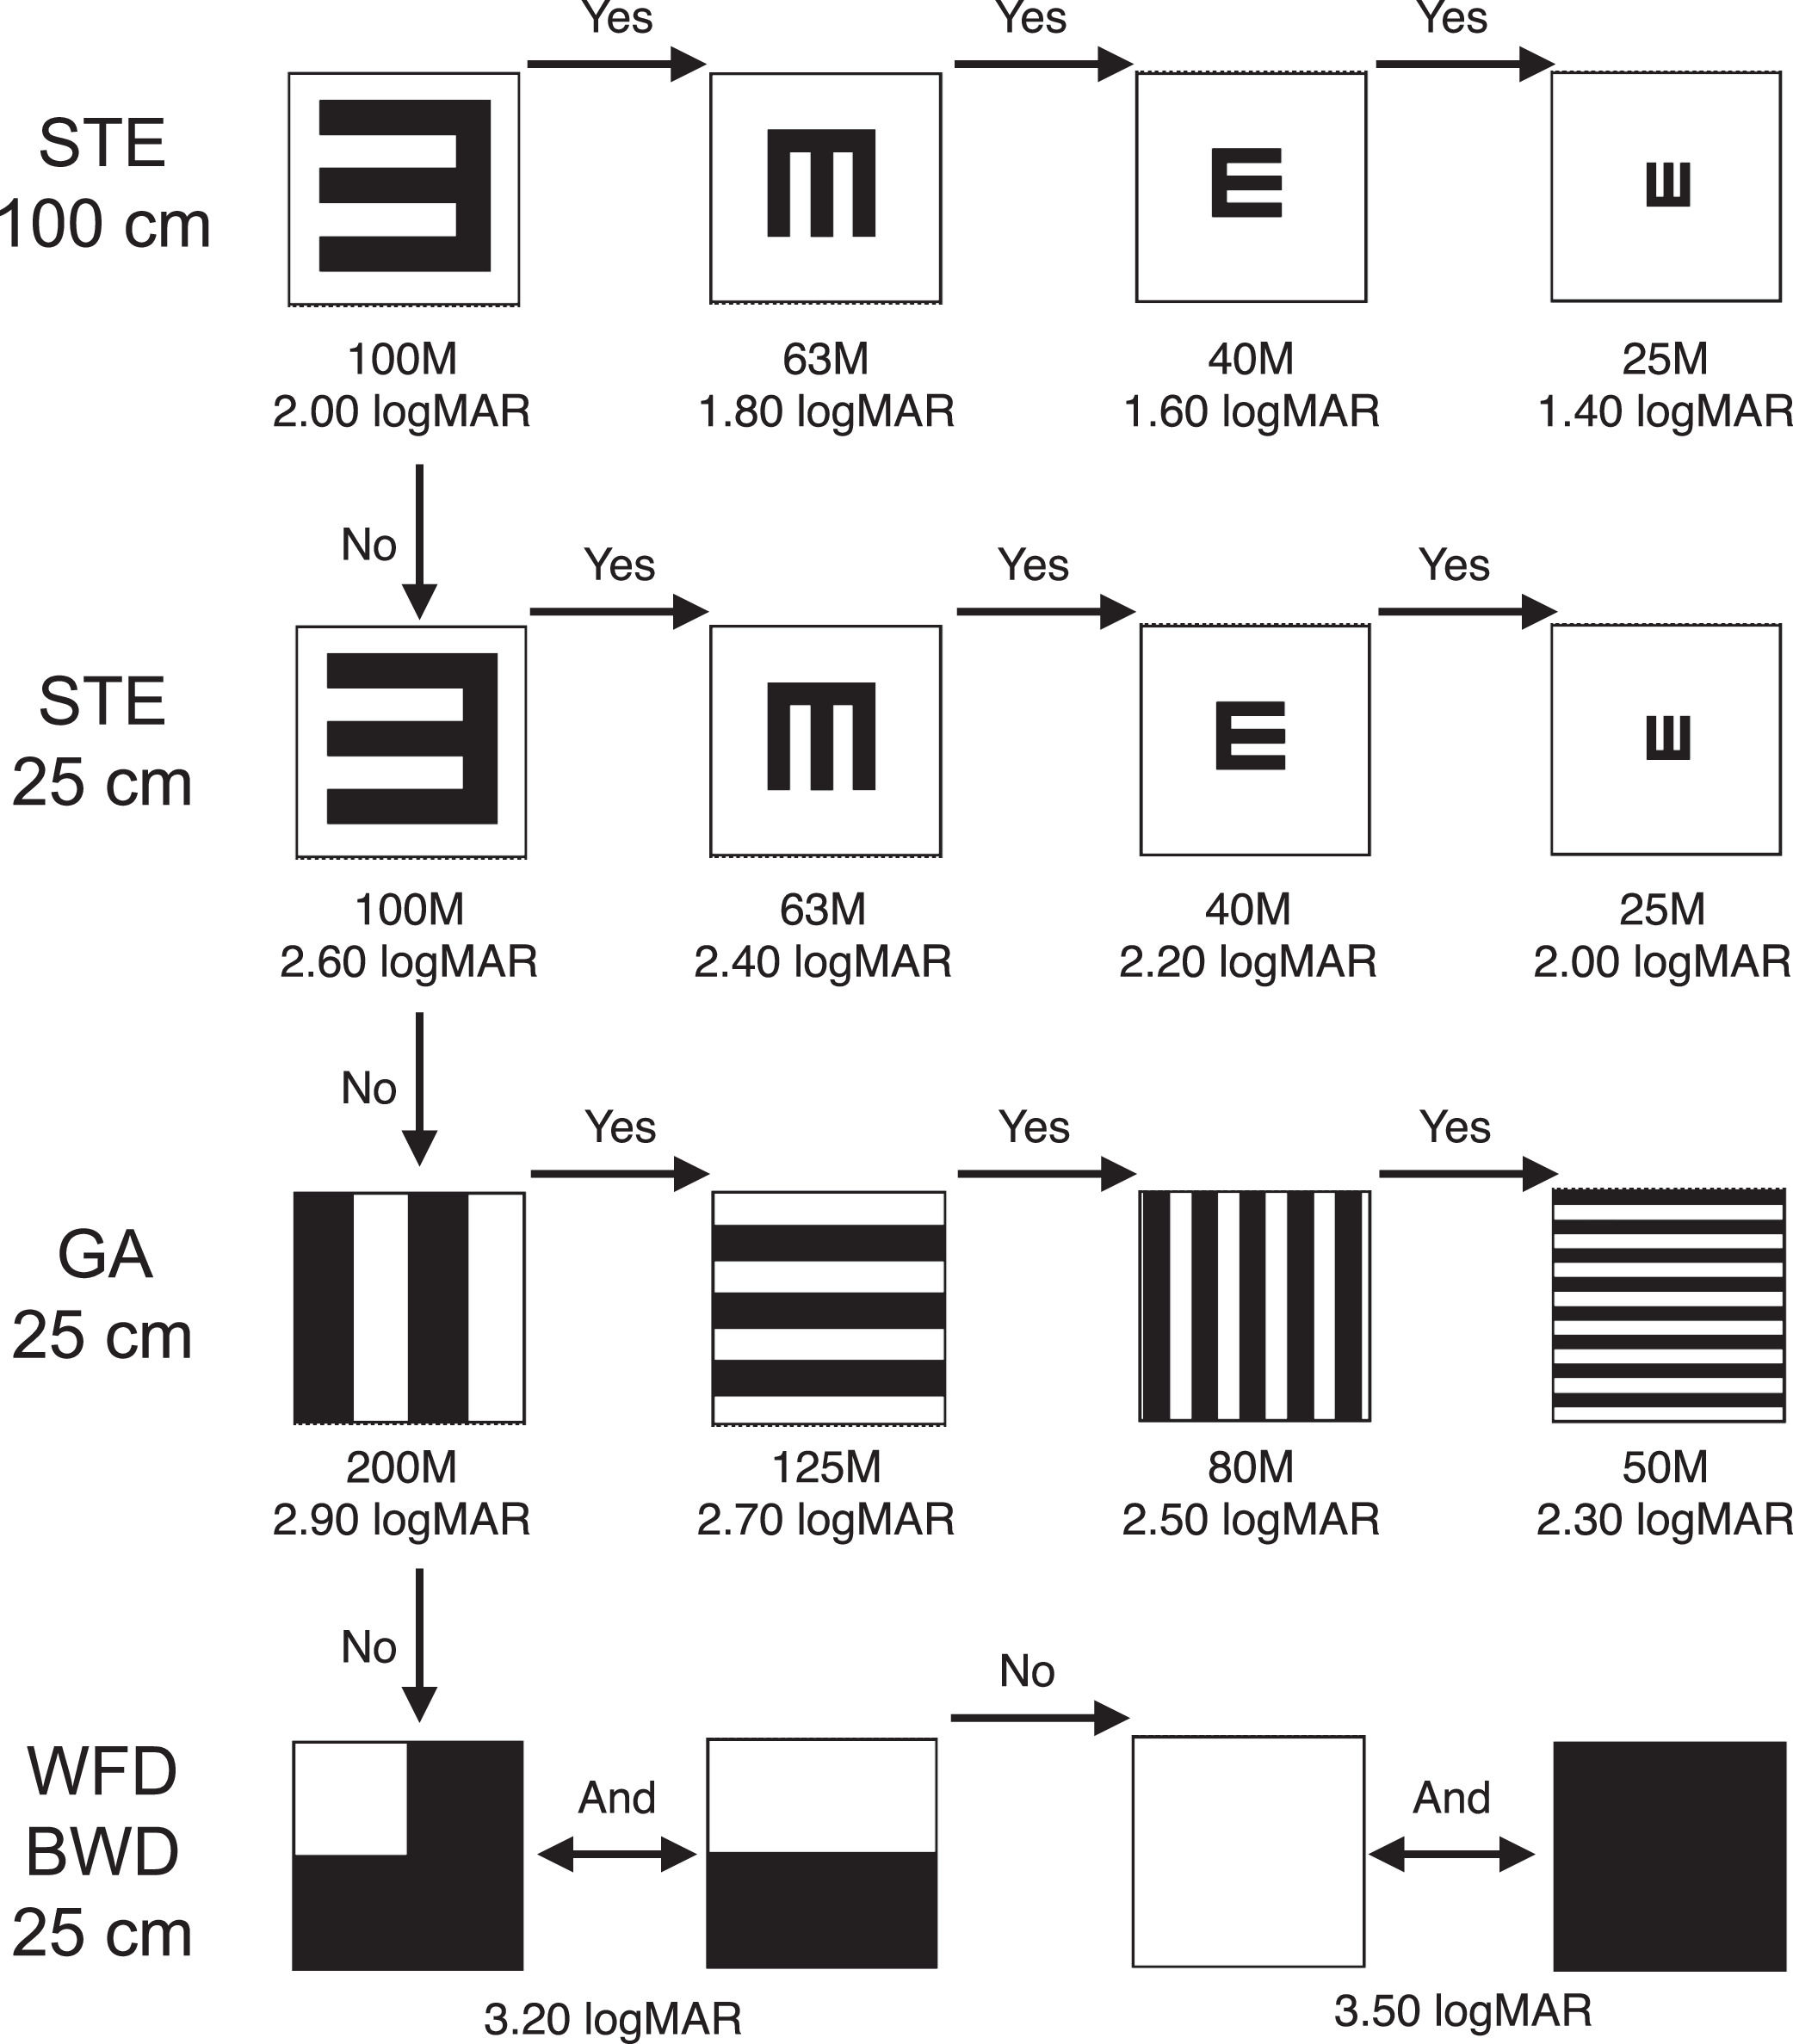
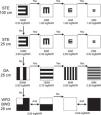
Schematic representation of Berkeley Rudimentary Vision Test. The test sequence is indicated by arrows. The name of the sheets and their distance from the patient during the assessment are indicated on the left side. Below each BRVT chart are the M-units and the corresponding visual acuity in logMAR. STE, Single Tumbling E, GA, Grating Acuity, WEP, White Field Projection, BWD, Black White Discrimination.
The VA result with BRVT in the General group for CF (2.00 logMAR) was very similar to the results by Lange et al.12 with FrACT for CF (1.98 logMAR). However, the VA in the General group for HM (2.60 logMAR) was worse compared to Lange et al. (2.30 logMAR). A possible reason might be, that Lange et al. included all pathologies, also glaucoma and probably with visual field defects. Indeed, the VA results in the Visual field group for HM (2.30 logMAR) was the same as the overall results by Lange for HM (2.30 logMAR). BRVT and FrACT were found suitable for low vision patients in a study about a direct comparison of both tests with 50 patients.10 The same study found a rather low agreement between the tests (kappa 0.26) where BRVT generally reported poorer vision than did the FrACT.
To enhance the robustness of our findings, we are planning a follow-up study with increased sample size for both the General group and the Visual field group. This study should also adapt a more standardized measurement of the visual field with regard to stimulus size and procedure, ideally performed with the same perimeter type.
ConclusionsThe VA found in this study for CF confirmed values from earlier studies, while VA for HM was found to be slightly worse. These findings allow a translation of older VA data of CF and HM to logMAR for proper statistical analysis. This is especially important for low vision treatments with long follow-up times as for instance keratoprosthesis. Patients with central visual field defects showed a large variation of measured VA with BRVT. Optometrists should therefore take special care when obtaining VA in low vision patients with visual field defects.
Declaration of generative AI and AI-assisted technologies in the writing processDuring the preparation of this work the author did not used AI and AI-assisted technologies.
FundingThis research did not receive any specific grant from funding agencies in the public, commercial, or not-for-profit sectors.
None.
The BRVT test is made up of a set of cards that have been developed for patients with severe low vision. These 25 × 25 cm cards are comprised of three pairs with the tests on both sides. The first pair of cards is made up of an optotype with the letter E, the Single Tumbling E (STE) in four different sizes of 145 mm, 92 mm, 58 mm and 36 mm, from largest to smallest, which can be evaluated at two specific distances: 1 meter or 25 cm. This enables eight different VA measures. At 1 meter, 2.00, 1.80, 1.60, and 1.40 logMAR can be evaluated, while at 25 cm, an VA of 2.60, 2.40, 2.20, and 2.00 logMAR can be measured from largest to smallest test size. The second pair contains four gratings, for Grating Acuity (GA), with different frequencies whose stripes are 60 mm, 38 mm, 24 mm and 15 mm, covering an even smaller VA range between 2.90, 2.70, 2.50 and 2.30 logMAR, always presented at a distance of 25 cm of the patient. The last pair is composed by two cards for partial white-black discrimination, made up of a white quadrant on a black background and a card that is half white and half black, denominated as White Field Projection (WFP). The last pair is for the so-called Black White Discrimination (BWD), one side white and the other side black, which is also positioned 25 cm from the patient.7 The instruction manual of the BRVT assigns 3.20 logMAR to WFP and 3.50 logMAR to BWD. Each BRVT card uses M-units, which is the letter height that corresponds to a visual angle of 5 min of arc at a distance of 1 meter.19
The original standard BRVT protocol starts with the STE 25 M card (the smallest letter E) at 100 cm, corresponding to 1.40 logMAR. However, this is only 0.10 logMAR higher than the lowest level of the standard VA test using a VistaVision screen; or just 0.20 logMAR higher than the lowest level of the ETDRS charts. Thus, some patients who are unable to see the largest VisionVista optotypes of 1.60 logMAR were able to distinguish the STE 25 M card at 100 cm (1.40 logMAR), which may be due to the type of pathology of the patient, e.g. visual field defects. Therefore, we decided to perform the test starting with the STE 100 M card at 100 cm (2.00 logMAR) to be able to evaluate a greater VA range without missing a single measurement between 1.40 and 1.60 logMAR. Our applied flow chart is given in Figure A1. We recorded as VA the one corresponding to the last card that was recognized correctly.
First, the STE 100 M card was shown at 100 cm, then we continued depending on the patient's response. If the patient was able to discern the STE 100 M, we showed the next card without varying the distance from the patient, and continued until the STE 25 M was displayed. At this point, if the patient was able to discern the STE 25 M, we would recheck the VA with VistaVision at 4 m. If the patient was not able to discern the STE 100 M card at 100 cm, we brought the same card closer to 25 cm and continued in the same way as at 100 cm (Figure A1). Although moving the test closer to 25 cm may create an accommodative demand of +4.00D, according to the study by Bailey7 and the analysis by Smith,20 it is not necessary to make corrections to the refractive value of the patient, since the blur alteration and the VA it generates is not relevant in these low vision ranges.
If, on the other hand, the patient was not able to discern the STE 100 M card at 25 cm, we changed to the GA 200 M card. All following cards were displayed at 25 cm. For GA card, the patient had to recognize the orientation of the stripes. If the patient could correctly indicate the direction of the lines that were shown, we moved on to the next GA 125 M card and so on. Finally, if the patient could not indicate the direction of the lines of the GA 200 M card, we used the pair of WFP cards, which had to be shown in each of the four possible orientations, starting with the one that was made up of a white quarter on black background. If the WFP cards could not be distinguished, we used the last pair, the BWD cards in which the patient had to discriminate whether the sheet was white or black, both indicating the same VA value.
The number of repetitions for STE, GA, WEP and BWD was done according to the original protocol described by Bailey.7 For STE and GA card, the number of presentations or repetitions of each card was a minimum of two times; up to a maximum of four presentations, depending on the fluency and security of the patient; for WFP and BWD cards, a minimum of four presentations and a maximum of six were performed.
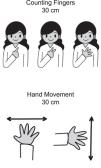
The examiner presented her hands without rings, accessories or painted nails (Figure A2). The procedure was as follows: the examiner showed 1, 2 or 5 fingers to the patient five times at 30 cm distance to the subject's head. Fingers were always shown on a white background without making movements with the hands that could stimulate the retina. If the patient was able to identify 3 out of 5 presentations correctly, "Counting fingers" (CF) was recorded as VA. If the patient was unable to recognize 3 presentations, we proceeded to the next step.
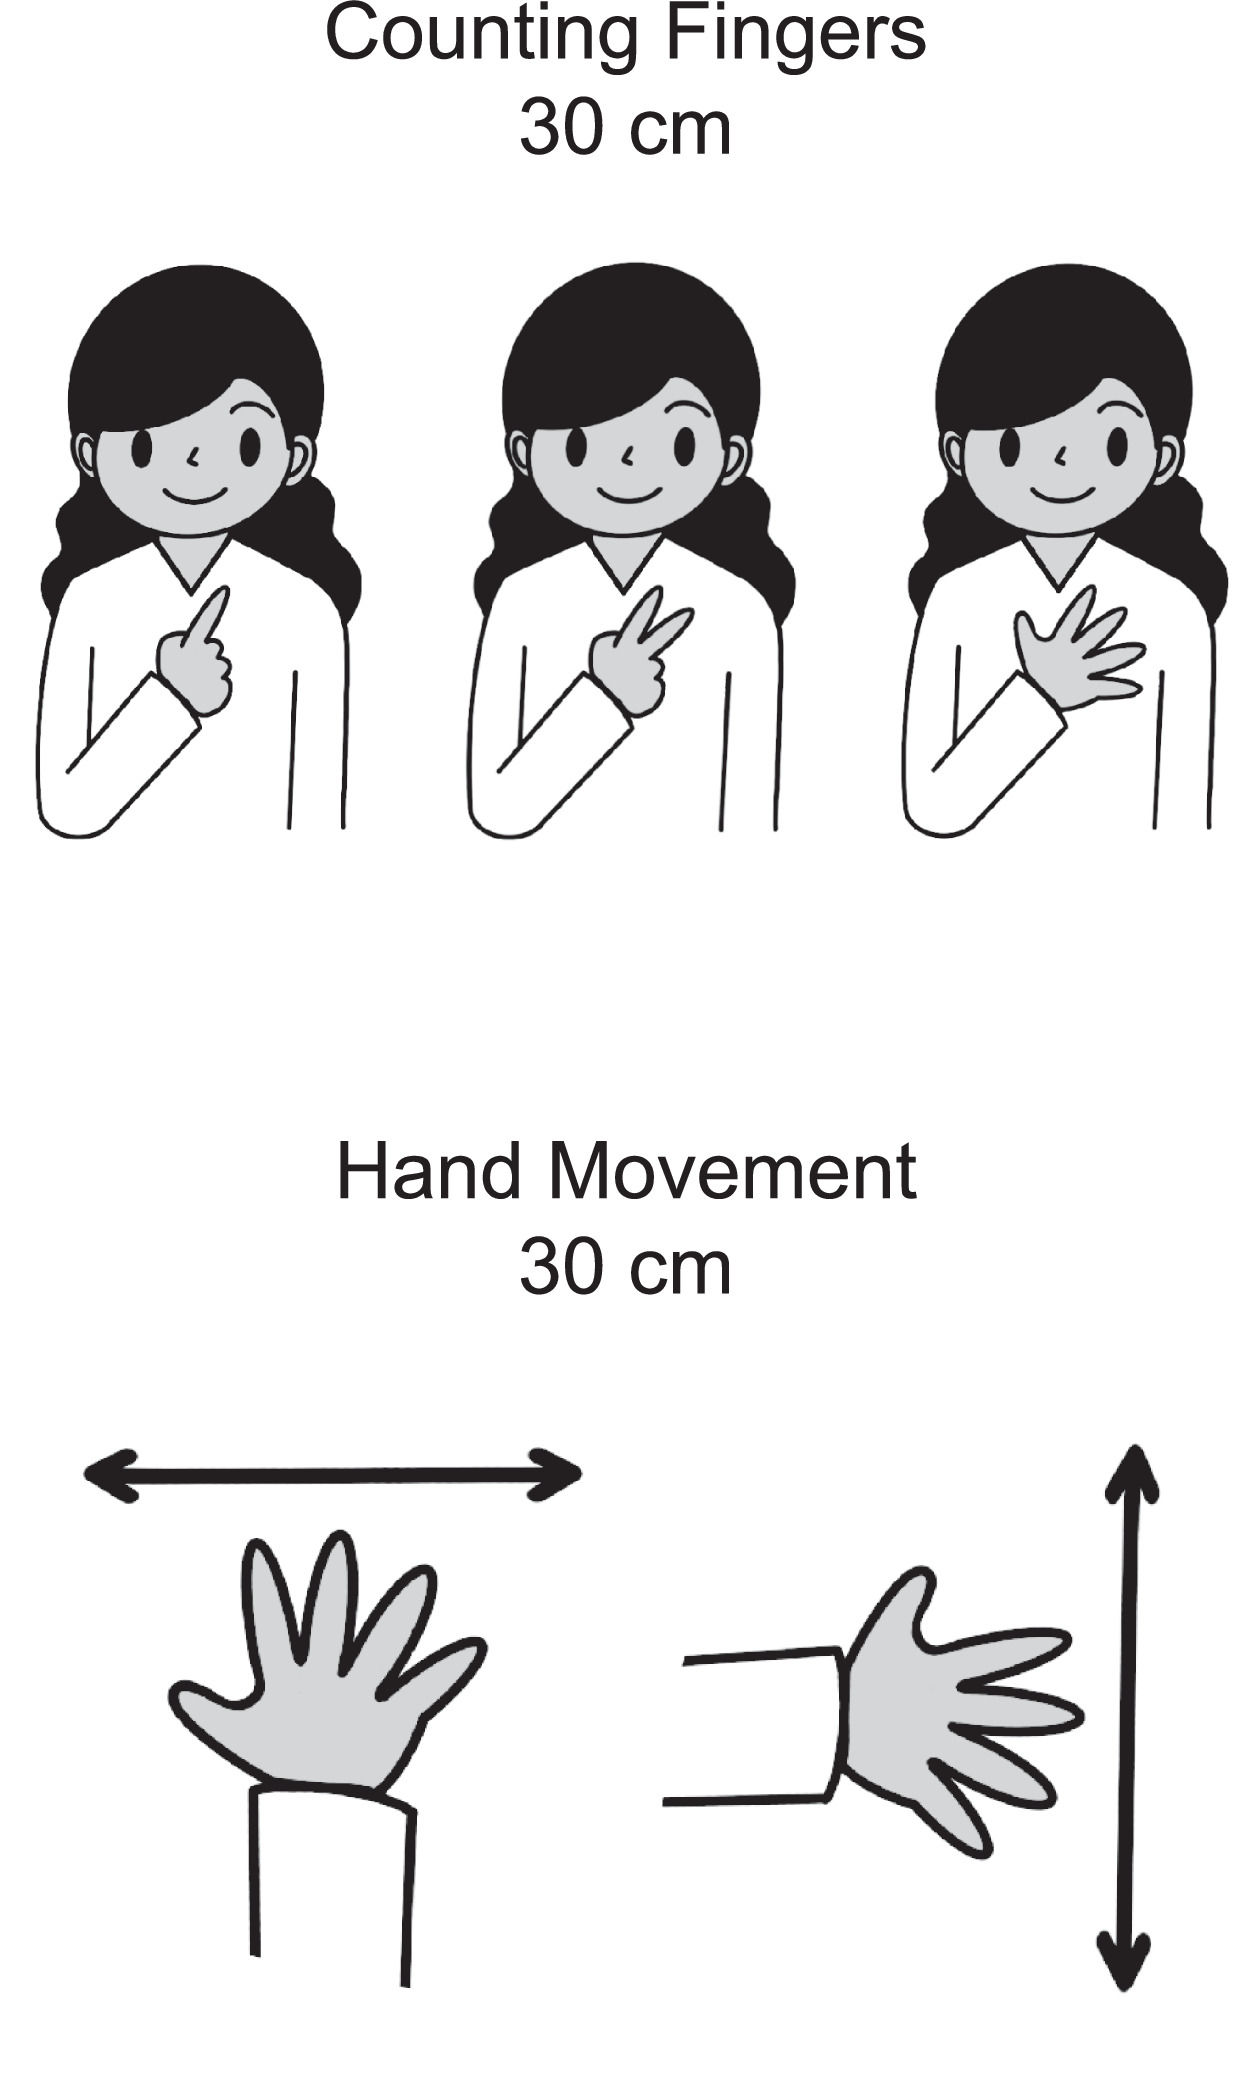
The examiner moved her hand 5 times at a distance of 30 cm from the subject's head, randomly changing the presentation either vertically (about 50 cm from top to bottom) or horizontally (about 50 cm from side to side) (Figure A2). The examiner also gave the instruction to the subject, asking him/her to notify when he/she saw the movement of the hand and indicate in which direction it moved, whether vertically or horizontally. If the subject was able to identify 4 out of 5 presentations correctly, the "Hand movement" (HM) was recorded as VA. If the patient was not able to recognize the HM, light perception was examined and the subject was excluded from the present study.
The dimensions of the examiner's hand are as follows: the length of the hand, from the wrist to the tip of the middle finger was 16 cm and the width of the palm without counting the thumb was 7.4 cm. The median finger widths of the index, middle, and ring finger together with their inter-digit distances was 15.4 mm (range 13.1 to 18.1 mm).13


