


This research aimed to thoroughly examine and meta-analyse statistical information about the prevalence of refractive error in Iraq.
MethodsTo discover every pertinent Iraqi epidemiological study from March 2014 to March 2024, Scopus, Science Direct, Google Scholar, Embase, PubMed, and the Cochrane Library were searched and reviewed. The Iraqi refractive error rate was interesting. The Comprehensive Meta-Analysis Software received unprocessed events and sample sizes for effect size calculations.
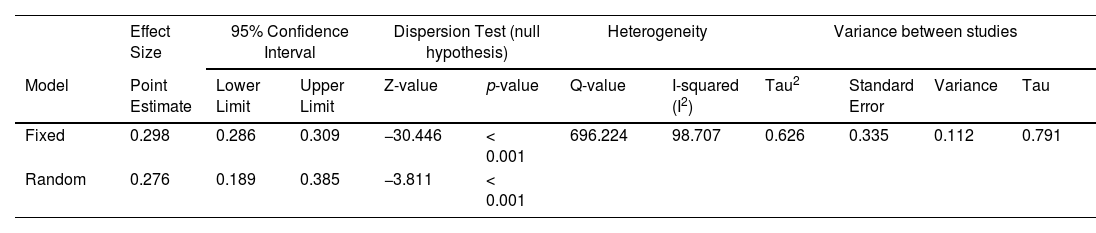
ResultsA meta-analysis was undertaken by pooling data from 10 studies. The fixed effects model indicates an estimated effect size of 29.8% (95% CI: 28.6—30.9%). However, the statistical measures of heterogeneity (Q-value p < 0.001; I2 = 98.707) showed significant heterogeneity among the studies, which indicates that a random-effects model should be used. The random effects model suggests that the prevalence of refractive error in the Iraqi population is predicted to be 27.6% (95% CI: 18.9—38.5%). The most common refractive defect was myopia, found in 35.1% of cases (95% CI: 24.9—46.8%). Astigmatism was the second most prevalent, affecting 32.2% (95% CI: 19.1—49.0%), followed by hyperopia in 23.9% (95% CI: 16.0—34.2%).
ConclusionsCurrent estimate of refractive error prevalence in Iraq may be conservative of this condition's burden. Nevertheless, this corresponds to a minimum of 8 to 18 million individuals in Iraq who have a refractive error. Due to study variability, wide estimate ranges, and random effects, more research and reliable sources are needed to obtain more accurate results.
Refractive error (RE) is an optical defect of the eye that affects vision by hindering light from reaching a single focus on the retina. Visual impairment (VI) is also linked to RE; this occurs when standard eyeglasses, surgery, or contact lenses are ineffective in treating RE.1 Sometimes, other factors contribute to RE not being treatment, such as a shortage of easily accessible treatment options.2 The type of lens needed to correct RE determines whether it is spherical , cylindrical or a combination or both.
Refractive errors impact a significant segment of the global population, regardless of gender, age, race, or cultural background. One of the primary health issues that should be taken seriously is RE in young people, which is particularly problematic for school-age children and significantly impacts the community.3
Uncorrected refractive errors (URE) are some of the common causes of visual impairment globally, particularly among school-going children. These vision issues go untreated or undetected in children, thus impending social development and academic performance. According to the World Health Organization (WHO), about 12.8 million children aged between 5 and 15 years are affected by URE. With such a huge number, there is a need to have early detection and correction since this would prevent long-term visual deficits.4 If refractive errors are treated early, quality of life improves, and millions of children with visual impairment can be prevented from developing permanent vision problems, such as amblyopia, which can result from untreated refractive errors.5
Refractive errors impact significantly and negatively society's economy and a person's schooling, personality growth, and employment prospects.1 As a result, there has recently been an increase in the demand for efficient screening programs to identify people with REs. The World Health Organization created the global program Vision 2020, “Right to Sight”, to prevent vision impairment caused by refractive errors.6,7 One of its tactics is to provide children with significant refractive problems with spectacles and incorporate a primary visual acuity examination within school health programs.8-11 Proper eyewear is one easy, affordable way to help with vision improvement.
Refractive errors come in three varieties: astigmatism, myopia, and hyperopia.12 Hyperopia is when the eye rests, and parallel light beams focus posterior to the retina.13-15 In contrast, myopia results from parallel light beams focusing in front of the retina.16 One of the common eye conditions is astigmatism, which entails assymmetric meridional curvature of the cornea or lens. However, in most cases, this problem is correctable with only contact lenses or spectacles. In extreme cases, the problem may be corrected through treatment using refractive surgery.17,18
According to Steinmetz et al.,7 refractive errors (REs) are the world's second most common cause of visual impairment, behind cataracts. However, uncorrected refractive error is the leading cause of vision impairment in Iraq.19 RE can be detected by routinely examining patients attending clinics or by conducting population-wide vision screenings; the latter is required in developing nations since most people do not have access to reasonably priced and top-quality eye medical care.20,21 According to Mahmoud & Mansour (2023), schoolchildren are the most common patients for vision screening, which is a helpful method of identifying potentially curable ocular disorders, including blindness associated with RE caused by amblyopia.22
Due to the conflicts and hostilities in Iraq during the last decade, over 1.7 million people, including more than 900,000 children, have been forced to leave their homes and are now seeking protection in either refugee shelters or housing in the Kurdistan area of the country.19 The findings of various research conducted in the last two decades on Iraqi children and youths observed a high magnitude of REs.18,19 The meta-analysis, in this case, shows that myopia is the most prevalent condition observed, followed by astigmatism and hyperopia, which is the least reported.7,15 Consequently, there has been controversy regarding the prevalence of REs in Iraq from previous studies, many of which have small sample sizes and limited geographical coverage.15,23,24 These treatment differences underline the importance of the improved integration of the available data for a more accurate assessment of the frequency of REs among school children in Iraq.13 This information becomes vital in accurately managing the direction of the nation's handling of public health concerns and allocating monies for the speciality of vision care.25
MethodsApproach to literature search and epidemiology data sourcesResearch databases that were used in the analysis include Scopus, Science Direct, Google Scholar, Embase, PubMed, and the Cochrane Library. Besides the search, other sources of the literature on campus and in different institutions' libraries and the bibliographies of the identified articles were also reviewed for other papers.
All data in this study were retrieved from the databases. While considering the database search field, selective keywords were used to reveal how frequently the REs manifest among school students in Iraq. The research design covers all relevant phases related to refractive errors. The search terms used included key phrases and medical subject headings such as ‘refractive error’ AND ‘prevalence’ OR ‘incidence’ OR ‘rate’ AND along with ‘children under 18’ OR ‘adolescents’ OR ‘school students’ AND ‘Iraq’. Additionally, Boolean operators were used to refine the search results and ensure comprehensive coverage.25,26 The study was limited to journal articles with peer review only. After the dataset was screened, two reviewers independently reviewed each text article to ensure no biases. The results from this double review procedure produced a shortlist of papers judged most pertinent to the subject, serving as the basis for the final analysis.
Study designThe current study employed a systematic review and meta-analysis methodology to ascertain the prevalence of pupils impacted by REs in Iraq. The study was conducted following the PRISMA standards.27 It includes steps to find and critically evaluate relevant studies and systematically review the epidemiological evidence on REs among Iraqi school children.
Inclusion and exclusion criteriaFirst, all published articles about the prevalence of refractive errors among Iraqi schoolchildren. Research studies were evaluated using specific inclusion and exclusion criteria. The initial criterion chosen was the availability of complete texts of the studies that aim to assess the occurrence of refractive errors (astigmatism, hyperopia, myopia) in schoolchildren ranging from 6 to 18 years old. The articles were published between March 2014 and March 2024. The papers and articles used were those that were published in English alone.
Furthermore, all the investigations that were conducted in Iraq or that targeted Iraqi populations were also considered for the research. The sources of the documents under consideration were studied to gain additional information or access other papers. Non-research papers, reports with replication studies, unclear methodological quality, and non-availability of the full text of the research were excluded.
Data collectionAs described in the flow chart shown in Fig. 1, EndNote software was employed to identify the studies used in the meta-analysis. Initially, 396 papers were retrieved through database searches and other sources. After the title screening, articles whose titles contained the words ‘refractive errors’ and ‘school students with refractive error in Iraq’ were subjected to abstract screening. Of the 396 papers identified in the initial search, 134 duplicates were excluded, and an additional 252 studies were excluded after further screening the titles and abstracts. All articles that satisfied the specified criteria were chosen for further examination. In the end, 10 studies were selected for the meta-analysis for this study. The PRISMA flowchart, displayed below, provides a comprehensive visual representation of the procedure used to select the studies.

Diagram illustrating the process of selecting studies according to the PRISMA Framework.27
The data were retrieved and processed using Microsoft Excel before being exported to the Comprehensive Meta-Analysis Software (CMA). The prevalence of refractive error, which includes myopia, hyperopia, and astigmatism, in the Iraqi population was the primary factor investigated. The unprocessed data was utilised to input the frequency of occurrences and the size of the sample, and the CMA program calculated the parameters for the magnitude of the effect (rate of event, logit rate of event, standard error).
The information was entered manually from a prepared data extraction form, which included the authors' names, publication dates, study types, sample sizes, ages, study areas, diagnostic criteria used, assessment tools, and prevalence rates of myopia, hyperopia, and astigmatism. Cochrane's Q test was used to investigate study heterogeneity using its underlying chi-square distribution, providing a measure of variability across included studies.28 A high level of study heterogeneity was thought to be suggested by an I2 value greater than 75%.29 To assess the combined prevalence of myopia, hyperopia, and astigmatism, both fixed-effect and random-effect models were employed at a 95% confidence level.30 A p-value of less than 0.05 was set as the threshold for statistical significance, ensuring robust criteria for interpreting the results.29 A secondary moderator analysis was performed to evaluate geographical variations in the prevalence of the variable.
Funnel plots were used to conduct bias assessments, and the results indicated minor publication bias. To evaluate the reliability of the evidence, sensitivity analyses were conducted by excluding studies of poor quality.3,25 The results were presented in the form of the pooled prevalence ratio for refractive errors, which gives an overall profile of the prevalence of the conditions among school students in Iraq.
ResultsVarious stages of academic research were determined, and data from March 2014 to March 2024 was applied. These studies cover 10 years. Table 1 briefly summarizes the attributes of the 10 studies incorporated in the qualitative and quantitative synthesis.
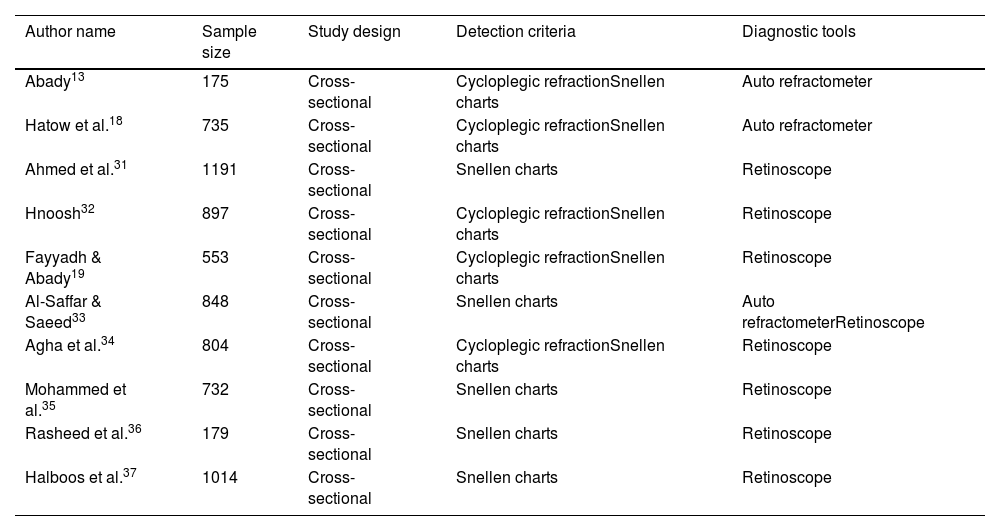
Table 2 presents the articles’ characteristics, such as the study's design, the size of the sample, the detection criteria, and the diagnostic techniques utilised. This information allows us to assess the quality and comparability of the studies and the procedures employed in diagnosing refractive errors.9 The use of cycloplegia plays a crucial role in accurately measuring refractive errors in pediatric populations due to their strong accommodative responses, which can mask the true refractive state of the eye. Studies employing cycloplegic refraction provide more reliable estimates of hyperopia and astigmatism, as cycloplegia eliminates accommodation, reducing the risk of underestimating hyperopia and overestimating myopia. In the studies included in this analysis, variability in the use of cycloplegia was observed, as outlined in Table 2. For instance, studies such as those by Abady, Hatow et al., Hnoosh, Fayyadh & Abady, and Agha et al. utilized cycloplegic refraction, yielding more accurate prevalence rates. In contrast, studies by Ahmed et al., Al-Saffar & Saeed, Mohammed et al., Rasheed et al., and Halboos et al. did not document the use of cycloplegia, potentially contributing to their lower prevalence estimates. This inconsistency highlights a significant methodological factor that likely contributes to the heterogeneity observed in the meta-analysis results. The standardized use of cycloplegia across future studies is essential to improve the reliability and comparability of findings, ensuring more accurate assessments of refractive error prevalence in pediatric populations and guiding effective public health strategies.
Characteristics of included articles.
| Author name | Sample size | Study design | Detection criteria | Diagnostic tools |
|---|---|---|---|---|
| Abady13 | 175 | Cross-sectional | Cycloplegic refractionSnellen charts | Auto refractometer |
| Hatow et al.18 | 735 | Cross-sectional | Cycloplegic refractionSnellen charts | Auto refractometer |
| Ahmed et al.31 | 1191 | Cross-sectional | Snellen charts | Retinoscope |
| Hnoosh32 | 897 | Cross-sectional | Cycloplegic refractionSnellen charts | Retinoscope |
| Fayyadh & Abady19 | 553 | Cross-sectional | Cycloplegic refractionSnellen charts | Retinoscope |
| Al-Saffar & Saeed33 | 848 | Cross-sectional | Snellen charts | Auto refractometerRetinoscope |
| Agha et al.34 | 804 | Cross-sectional | Cycloplegic refractionSnellen charts | Retinoscope |
| Mohammed et al.35 | 732 | Cross-sectional | Snellen charts | Retinoscope |
| Rasheed et al.36 | 179 | Cross-sectional | Snellen charts | Retinoscope |
| Halboos et al.37 | 1014 | Cross-sectional | Snellen charts | Retinoscope |
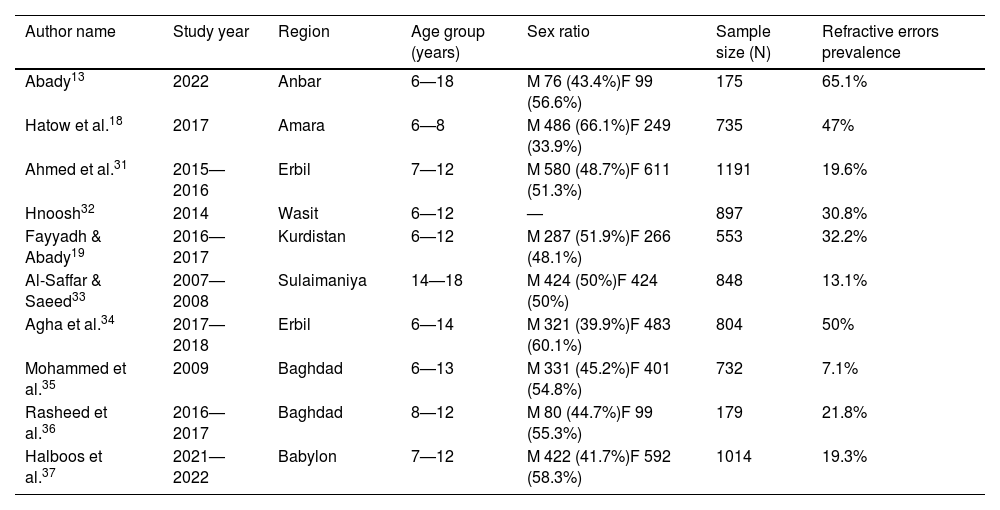
Table 3 displays the distribution of REs among students at schools in Iraq, showing noticeable differences across various studies and geographies. Abady study in 2022 reported the highest prevalence rate of 65.1%, indicating a high occurrence of vision problems in Anbar. On the other hand, a study by Mohammed et al. in 2019 in Baghdad province showed a much lower prevalence rate of 7.1%. This comparison amplifies the influence of regional characteristics, such as socio-economic status, health care, and weather, on the incidence of REs. In this case, we must consider regional characteristics and make suitable public health interventions relevant to the region. Likewise, other studies conducted in other Arab countries display varied results regarding the causes of visual impairment while proposing that regional factors should be considered.38
Studies on the prevalence of refractive error in the Iraqi population.
| Author name | Study year | Region | Age group (years) | Sex ratio | Sample size (N) | Refractive errors prevalence |
|---|---|---|---|---|---|---|
| Abady13 | 2022 | Anbar | 6—18 | M 76 (43.4%)F 99 (56.6%) | 175 | 65.1% |
| Hatow et al.18 | 2017 | Amara | 6—8 | M 486 (66.1%)F 249 (33.9%) | 735 | 47% |
| Ahmed et al.31 | 2015—2016 | Erbil | 7—12 | M 580 (48.7%)F 611 (51.3%) | 1191 | 19.6% |
| Hnoosh32 | 2014 | Wasit | 6—12 | — | 897 | 30.8% |
| Fayyadh & Abady19 | 2016—2017 | Kurdistan | 6—12 | M 287 (51.9%)F 266 (48.1%) | 553 | 32.2% |
| Al-Saffar & Saeed33 | 2007—2008 | Sulaimaniya | 14—18 | M 424 (50%)F 424 (50%) | 848 | 13.1% |
| Agha et al.34 | 2017—2018 | Erbil | 6—14 | M 321 (39.9%)F 483 (60.1%) | 804 | 50% |
| Mohammed et al.35 | 2009 | Baghdad | 6—13 | M 331 (45.2%)F 401 (54.8%) | 732 | 7.1% |
| Rasheed et al.36 | 2016—2017 | Baghdad | 8—12 | M 80 (44.7%)F 99 (55.3%) | 179 | 21.8% |
| Halboos et al.37 | 2021—2022 | Babylon | 7—12 | M 422 (41.7%)F 592 (58.3%) | 1014 | 19.3% |
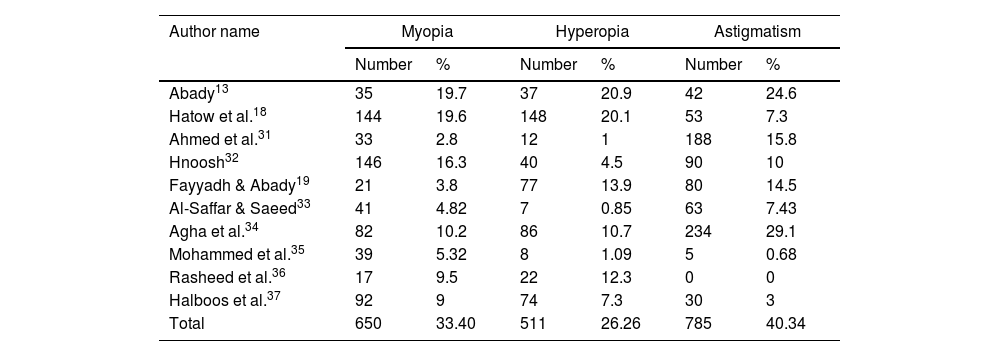
The possibility of myopia, hyperopia, and astigmatism varies in the surveyed studies listed in Table 4. The overall prevalence of myopia was 33.40%, while Abady's study reported the highest percentage at 19.7%, while the lowest level was reported by Ahmed et al., 2017 at 2.8%. This variation indicates that the potential of developing myopia might depend on environmental factors such as increased population density and more time spent on near-work activities, including screens.39
Distribution of refractive errors among studies.
| Author name | Myopia | Hyperopia | Astigmatism | |||
|---|---|---|---|---|---|---|
| Number | % | Number | % | Number | % | |
| Abady13 | 35 | 19.7 | 37 | 20.9 | 42 | 24.6 |
| Hatow et al.18 | 144 | 19.6 | 148 | 20.1 | 53 | 7.3 |
| Ahmed et al.31 | 33 | 2.8 | 12 | 1 | 188 | 15.8 |
| Hnoosh32 | 146 | 16.3 | 40 | 4.5 | 90 | 10 |
| Fayyadh & Abady19 | 21 | 3.8 | 77 | 13.9 | 80 | 14.5 |
| Al-Saffar & Saeed33 | 41 | 4.82 | 7 | 0.85 | 63 | 7.43 |
| Agha et al.34 | 82 | 10.2 | 86 | 10.7 | 234 | 29.1 |
| Mohammed et al.35 | 39 | 5.32 | 8 | 1.09 | 5 | 0.68 |
| Rasheed et al.36 | 17 | 9.5 | 22 | 12.3 | 0 | 0 |
| Halboos et al.37 | 92 | 9 | 74 | 7.3 | 30 | 3 |
| Total | 650 | 33.40 | 511 | 26.26 | 785 | 40.34 |
With an overall prevalence of 26.26%, hyperopia shows substantial variability across regions. The highest rate reported by Abady (2024) at 20.9% and the lowest by Al-Saffar & Saeed (2018) at 0.85% suggest differences in diagnostic and possibly underreporting. The relatively low incidence reported in some of the studies could have been due to inadequate documentation or varying methods of diagnosis.40
The findings also showed astigmatism, with an overall rate of 40.34%. The highest rate of astigmatism was observed by Agha et al., 2018 at 29.1%, compared to no cases reported by Rasheed et al., 2018 indicates inconsistencies in diagnostic criteria or differences in the populations studied.
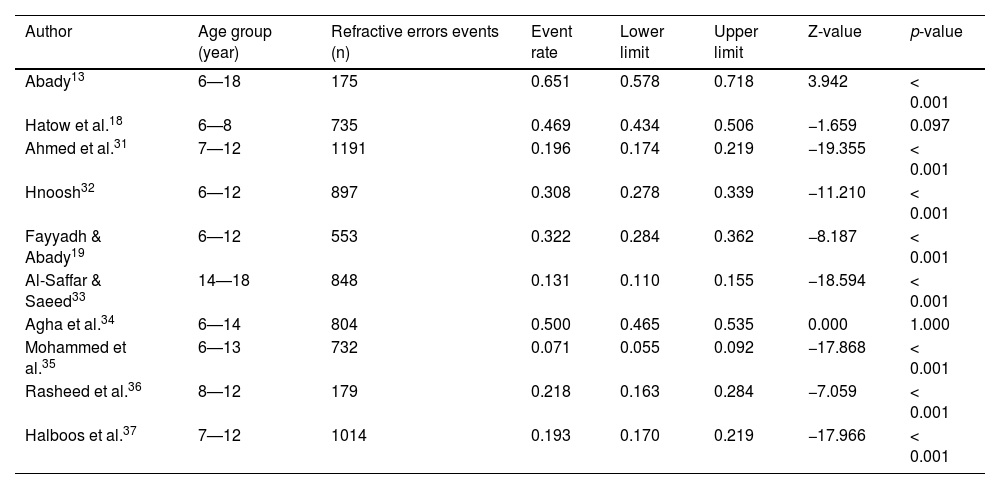
In Table 5, the event rates for each study are shown, indicating the statistical significance. Abady study found a higher event rate of 0.651 and a Z-value of 3.942, indicating a significant burden of REs in that population.
Age, Sample, and Events loaded into the CMA program and computed (Event Rate, Lower limit, Upper limit, Z-Value, p-Value).
| Author | Age group (year) | Refractive errors events (n) | Event rate | Lower limit | Upper limit | Z-value | p-value |
|---|---|---|---|---|---|---|---|
| Abady13 | 6—18 | 175 | 0.651 | 0.578 | 0.718 | 3.942 | < 0.001 |
| Hatow et al.18 | 6—8 | 735 | 0.469 | 0.434 | 0.506 | −1.659 | 0.097 |
| Ahmed et al.31 | 7—12 | 1191 | 0.196 | 0.174 | 0.219 | −19.355 | < 0.001 |
| Hnoosh32 | 6—12 | 897 | 0.308 | 0.278 | 0.339 | −11.210 | < 0.001 |
| Fayyadh & Abady19 | 6—12 | 553 | 0.322 | 0.284 | 0.362 | −8.187 | < 0.001 |
| Al-Saffar & Saeed33 | 14—18 | 848 | 0.131 | 0.110 | 0.155 | −18.594 | < 0.001 |
| Agha et al.34 | 6—14 | 804 | 0.500 | 0.465 | 0.535 | 0.000 | 1.000 |
| Mohammed et al.35 | 6—13 | 732 | 0.071 | 0.055 | 0.092 | −17.868 | < 0.001 |
| Rasheed et al.36 | 8—12 | 179 | 0.218 | 0.163 | 0.284 | −7.059 | < 0.001 |
| Halboos et al.37 | 7—12 | 1014 | 0.193 | 0.170 | 0.219 | −17.966 | < 0.001 |
Table 6 compares the fixed and random effects models, which provide the overall prevalence of REs. The fixed effects model estimated an overall prevalence of 29.8% (95% CI: 28.6—30.9%), while the random effects model gave a slightly lower value of 27.6% (95% CI: 18.9—38.5%). The Q-values of 696.224 and 12, which correspond to a 98.707% confidence level, support the hypothesis that substantial variability exists among the studies. Therefore, it is suitable for applying a random effects model for the meta-analysis. This high heterogeneity means that random factors may not cause the observed variability but could indicate genuine variability in the incidence of REs to various factors such as sociodemographic characteristics, diagnostic approaches, and regional healthcare systems. These findings align well with other studies showing comparable variability in the incidence of RE in various areas among various populations.41
Meta-analysis results of fixed and random model estimates of effect size, the 95% confidence interval, and the Z-value.
The RE prevalence forest plot of the random effects model is presented in Fig. 2. The graph indicates that the range of effect sizes differs from high prevalence depending on studies like Abady's to low prevalence by other researchers such as Mohammed et al., 2019. This graphical representation also justifies the high heterogeneity that prevails over the studies according to the 10 statistics. Some studies mentioned earlier, including Abady (2024), have tight confidence intervals, suggesting more accurate prevalence estimates. Other research has larger confidence intervals, meaning the results have more variability.
.")
Each horizontal line in the plot represents specific studies, while the diamond shape at the bottom shows the pooled prevalence estimate of the random effects model. The thickness of the lines also indicates the research's confidence intervals, demonstrating the range of prevalence rates reported by the studies.30
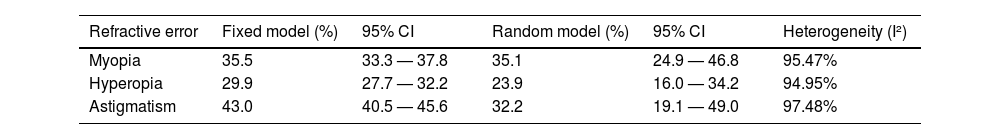
The meta-analysis findings for myopia, hyperopia, and astigmatism about effect size estimates using both fixed and random models are shown in Table 7. Myopia, the most common RE, is shown to have a pooled prevalence of 35.1% (95% CI: 24.9—46.8%) and high heterogeneity (I2 = 95.47%). These findings highlight the importance of interventions to reduce environmental risks like screen time and limited outdoor exposure associated with increased myopia prevalence.
Hyperopia has an overall prevalence of 23.9% (95% CI: 16.0—34.2%), suggesting that the condition represents a substantial load for which patients need further detailed eye testing for early diagnosis.
The overall prevalence of astigmatism, calculated by pooling data from several studies, was 32.2% (95% CI: 19.1—49.0%), suggesting the lack of diagnostic criteria and the need for general screening programs for early disease identification. High heterogeneity indicates substantial sampling, age criteria, diagnostic methods, and geographical variation between the studies.16 These suggest that the researches are heterogeneous, thereby implying that the difference in the prevalence rates, which has been a cause for concern, results from variability in sample size, age, criteria used in the diagnosis of the disorders, as well as regional issues.12
Bias was assessed using funnel plots, the Q-test for heterogeneity, the I-squared statistic, and Tau-squared and tau. Results indicated potential publication bias in smaller studies, as evidenced by asymmetrical funnel plots.
DiscussionRefractive error is the primary factor leading to vision impairment; more significantly, it is a type of visual impairment that may be prevented. Several studies have examined the epidemiology of these events and observed their prevalence. The occurrence and prevalence of refractive errors vary among countries, and the continuous need for services and products for individuals with refractive errors highlights the significance of such eye disease within a country's population.
The meta-analysis data reveal substantial heterogeneity among the studies, requiring a random-effects model. This model indicated a cautious prevalence rate of 27.6% (95% CI: 18.9—38.5%). The wide confidence intervals revealed in the study result from the variations in study designs and demographics. This highlights the importance of using consistent and standardised procedures in future research.
According to a study conducted by an eye care epidemiological consortium, it is estimated that over 50% of children and adolescents in the Middle East have refractive error when compared to a more detailed analysis of the region. The prevalence of myopia in Saudi Arabia is 48.8%, whereas astigmatism and hyperopia are observed at rates of 29.7% and 28.3%, respectively.42 Lone et al. (2023) reported that the prevalence of myopia in Saudi Arabia is estimated to be 59.63%, while hyperopia and astigmatism are estimated to be 12.42% and 6.22%, respectively.43
Meta-analyses conducted in Iran have revealed similar variability levels, which require using random-effects models to estimate prevalence appropriately. Based on the findings of Hashemi et al. (2018), the prevalence of myopia in Iran is estimated to be 11.7%, hyperopia is estimated to be 4.6%, and astigmatism is estimated to be 14.9%.44
Accurate data regarding the prevalence of vision impairment in Iraq is currently unavailable. However, researchers have estimated these figures by extrapolating or inferring from data collected in countries within the same global burden of illness region, specifically the Middle East. Based on the analysis of 10 studies, it has been shown that out of the 7128 Iraqi students aged 6 to 18 who were examined, approximately 27% of them have visual impairment. Nevertheless, the uncertainty interval suggests that these figures provide only a general overview of the situation for Iraqi students, and additional prevalence studies are required.
To assess the impact of methodological heterogeneity, a sensitivity analysis was conducted by including only studies that explicitly utilized cycloplegic refraction. Cycloplegia, critical for accurately assessing refractive errors in pediatric populations, eliminates accommodation and reduces the risk of misclassifying hyperopia or myopia. The analysis showed that studies employing cycloplegia yielded higher and more reliable prevalence estimates for hyperopia and astigmatism compared to the overall pooled estimates, which included studies with varying methodologies.
These findings highlight the importance of cycloplegia in refractive error research. Its use reduced heterogeneity and narrowed confidence intervals, indicating that variability in prevalence rates was partly due to differences in cycloplegic refraction practices. Excluding non-cycloplegic studies also revealed potential underestimation of hyperopia and overestimation of myopia in those studies.
For instance, the International Myopia Institute (IMI) has recommended myopia definition as a spherical equivalent of ≤ −0.50 D.45 Several studies in this analysis have adopted this definition. However, if there are divergences in threshold diagnosis, there will be some reports of higher or lower prevalence rates of myopia, depending on the criteria. Therefore, such variability would underscore the need for standardization in RE thresholds across the studies, thus facilitating reliable comparisons.
Notably, some studies focused on methods of vision screening to identify participants who may require further refraction assessments. If only vision screening is used, then there will be an underestimation of low preference RE. In this case, only that with noticeable visual acuity deficits gets flagged. Besides, some individuals may miss full refractive assessment, especially those with mild refractive errors. Mohammed et al. 2019 utilized vision screening as a preliminary measure, resulting in lower-magnitude RE cases. Therefore, there is a need to have a uniform methodology for future studies of refractive error prevalence. As such, the compatibility of findings across different studies would be enhanced if mandatory cycloplegia for pediatric assessments is used and standard protocols are established.
The study highlights significant heterogeneity among included studies, necessitating a random-effects model to address variations in sample sizes, diagnostic criteria, and the use of cycloplegic refraction, which impacted internal validity. Publication bias was assessed using funnel plots and statistical tests, revealing potential bias, particularly in smaller studies. A systematic review with independent screening by two reviewers minimized selection bias, and only peer-reviewed articles were included to ensure quality. Sensitivity analyses examined the impact of cycloplegic refraction, addressing variability from differing diagnostic methods. Exclusion of studies with unclear methods, unavailable full texts, or low relevance further reduced bias. While focusing on schoolchildren aged 6–18 ensured population specificity, regional differences in coverage and methods may still influence prevalence estimates.
ConclusionThe meta-analysis results of this systematic review showed a high prevalence of refractive errors among Iraqi students, with a somewhat high degree of variation reported across different regions and studies. Myopia, hyperopia, and astigmatism are all common, but myopia and astigmatism are more frequent.
There is a lot of variation between studies; estimates for the prevalence of refractive error range from 21.8 to 46.3%, and random effects are included. All of these things lead to the main conclusion of this study, which is that more research (population-based surveys) and more reliable sources are needed to get more accurate estimates of how common and how often refractive error happens in Iraq.
Assuming a cautious approach, a rate of prevalence ranging from 19.0% to 39.0% means that there are at least 8 to nearly 18 million individuals in Iraq who suffer a refractive error. The prevalence of refractive error substantially burdens the health system and the entire national population, emphasising the need to address this issue promptly within a public health strategy.
The findings of this study indicate a requirement for consistent reporting and diagnostic protocols, as well as the establishment of eye health initiatives in schools in Iraq. Scheduling regular vision examinations, providing easy vision repair options, and raising awareness are crucial steps towards eliminating the problem. Greater emphasis should be placed on conducting follow-up studies to ascertain the incidence and severity of adverse events and evaluate the effectiveness of the implemented measures. In conclusion, it is imperative to tackle these issues to improve the educational outcomes and overall welfare of children in Iraq. The results of the current study align with the findings of earlier studies conducted on refractive errors in other population groups and emphasise the need to address this issue.6


