


To evaluate the relationship between myopia and potential "myopiagenic" digital habits (excessive screen time, near face-device distance or low ambient light level).
Methods82 university students (21 ± 3 years) underwent a comprehensive optometric examination, including subjective refraction and axial length (AL) measurements. Digital habits were objectively measured using a mobile application (app) capturing screen time, face-device distance, ambient light level and number of interruptions larger than 20″ per day (called "events").
ResultsThe collection of 40 M data points showed mean values: 57 ± 40 min of daily screen time, 355 ± 67 mm of face-device distance, 305 ± 215 lux of ambient light level and 52 ± 32 events. No correlation was found between spherical equivalent refraction (SER) and digital habits. Particularly, SER was more negative for greater screen times, nearer face-device distances, lower light levels or more events. AL was inversely correlated with SER decrease. Correlation coefficients were very weak (R < 0.14) in all cases.
ConclusionsThe app quantified smartphone-based digital habits in a university population. The study revealed weak correlations between digital habits and myopia, indicating that longer-duration studies in a greater population are needed to obtain powerful correlation coefficients.
It is known that the prevalence of myopia is increasing. The exact cause is still unknown, but the knowledge gained in the last decade indicates that myopia is a result of complex interactions between genetic factors,1,2 near work3 and ambient light level.4
The research into the effects of each of these factors on myopia onset and progression can be very complicated and usually requires longitudinal studies in large populations.5–7 One of the challenges is the potential entanglement between light level and near work. For example, although outdoor activities have been reported to reduce the prevalence of myopia in children4,8 it is not clear whether this is due to higher light levels, or dominance of distant stimuli (less near work) outdoors. Another important difficulty in the measurement of the exact amount of time spent in given light conditions or engaged in near work. Most of the studies carried out so far have been based on questionnaires.9 Examples of questions included in these questionnaires are: "How many books did you read in a week?", or "How many hours a day do you spend outdoors?", etc.9 Several studies have shown the limitations of questionnaires used as research tools.10–12 In particular, accurately knowing screen time, face-device distance, and light level during near work is impossible with questionnaires7 in spite of the relevance of these factors to myopia progression.
Given the above limitations researchers have pointed out the need for objective data to find correlations between digital habits and myopia progression.13–16 Numerous studies have been carried out in the last 5 years using light sensors included in watches17–20 due to their wide availability.
?A3B2 tlsb=-0.01pt?>Mobile devices (smartphones and tablets) include cameras, light sensors, high-resolution screens and processing power which create an opportunity to measure daily screen time, face-device distance and ambient light level. Furthermore, the devices can warn users if their digital habits are considered inappropriate for their visual health.21 Embracing this opportunity is even more pressing given the amount of time spent by users on their phones (i.e. more than 8 h in teens22). Many researchers have pointed out the use of the smartphone as a significant risk of myopia onset and progression in children.23,24 The risk continues to be elevated among university students who spend many hours in front of books and electronic devices which increases the possibility of developing late onset myopia.25 Furthermore, the daily screen time with electronic devices has increased since 2021 due to remote, virtual classes held during the COVID-19 pandemic and subsequent remote work and study modalities. Recent studies show a significant increase in the progression of myopia that year compared to previous years.26–28
Although numerous studies reported reading distance and ambient light level,20,29,30 only one included viewing behavior data obtained using users' own smartphones (to the best of our knowledge).31 This study was performed in a group of 272 teenagers (13.7 ± 0.85 years old) over the course of 5 wk. It employed an app “Myopia app” (Innovattic, Netherland, not to be confused with “myopia.app™” by VisionApp Solutions S.L.) which displayed an on-screen questionnaire including questions such as: “How much time did you spend outdoors last Saturday/Sunday/Monday or Tuesday/Wednesday/Thursday/Friday?”. The face-device distances were measured using the device's front camera while users answered the questions. Questionnaires were scheduled twice per week through pop-up notifications. The daily screen time was inferred from the events of unlocking the device's screen lock. While highly original and innovative, the study had certain limitations: ambient light levels were inferred from questionnaires, daily screen time was inferred from discrete events of unlocking the device, and face-device distance was only measured at the time users were answering questions.
The events of unlocking the device could be considered interruptions in the continuous use of the device. The number of events per day can be a way of objectively measuring the interruptions in near vision tasks which can be relevant to myopia progression. Engaging in tasks that demand continuous near vision, such as working on electronic devices, can contribute to visual fatigue and, in some cases, the onset of transient hyperopic defocus. As indicated by some animal studies,32–34 interruptions could play a role in myopia control when hyperopic defocus was induced in marmosets.32 Early age interruptions resulted in less myopia progression compared to interrupting it later, or not interrupting at all, but these differences did not reach statistical significance (p = 0.56).32
Therefore, the purpose of the present study was to investigate the relationship between digital habits and myopia progression in a university population using objective measurements. Specifically, the research focused on whether prolonged screen time, shorter face-device distance, and lower ambient light levels are linked to myopia progression. The aim was to provide precise and objective data on digital habits through smartphone technology. Clinically, the findings could help eye care professionals to develop better guidelines and interventions to manage myopia. Understanding the impact of digital habits is particularly relevant given the increasing use of digital devices. The data could lead to recommendations for optimal screen time, appropriate face-device distances, and adequate ambient lighting to reduce myopia risk in young adults. The study used new technology to obtain objective values of digital habits and correlate them with clinical measures of spherical equivalent refraction (SER) and axial length (AL).
MethodsA total of 110 students (aged 21 ± 3 years) from the University of Murcia (Spain) were recruited, of which 82 were finally included in the study having met the prerequisites for the statistical analysis (see subsection “Smartphone app measurements”). The study was approved by the Ethics Committee of the University of Murcia and adhered to the tenets of the Declaration of Helsinki. The inclusion criteria for this study were: no ocular pathology compromising visual acuity (excluding refractive errors) of the subject, i.e. amblyopia, macular impairments, affectations of the optic nerve…), being enrolled in their first or second year of university studies, and owning an Android device for regular use.
Clinical measurementsAll clinical measurements were carried out at the Clínica Universitaria de Visión Integral (CUVI) at the University of Murcia (Spain) during each subject's initial visit of about 45′. Objective sphero-cylindrical refraction was obtained using an auto refractometer (Visionix L79 ARK-Topo), which was followed by retinoscopy, standard subjective refraction35 and biometry (Zeiss IOL master 700). The measurements with the biometer were always taken under the same conditions, using the standard SNR (Signal to Noise Ratio) of the device (98 Db). In the present study, SER and AL were compared with digital habits data measured with the app.
Smartphone app measurementsAt the end of the first visit, a mobile Android application (“myopia.app”, VisionApp Solutions S.L.) was installed via the Play Store on the students' own devices. After the installation each subject created a profile with a coded name given by the experimenter as a part of an anonymized study protocol. The subjects then gave the app permission to use the front camera and the light sensor of the device to collect face-device distance, daily screen time and ambient light level data. Previous reports by Salmerón-Campillo et al. provide detail on how the data are obtained and the accuracy and repeatability of the results.21,36 Subjects were advised to keep the app enabled all the time during a period of 3 months, except if they were going to let someone else use their device.
The app collected data continuously at 1 Hz as long as the subject's face was detected in the image from the front camera of the device. This ensured accurate daily screen time measures. After every 15 min of screen time a data bundle was uploaded to General Data Protection Regulation (GDPR)-compliant, anonymized cloud storage. Aggregate data could be downloaded by researchers for further processing in Python.
Prior to the statistical data analysis a few data filters were used to exclude subjects that did not collect enough data. In particular, subjects whose smartphones did not collect at least 1 h of data (3600 data points) during the whole collection period were excluded. A usage time of less than 1 h over 3 months could be due to the application being deactivated by mistake or the user themselves deactivating it for a long time. Individual data points were also filtered out; face-device distances greater than 80 cm (typically corresponding to the device not being hand-held, and not representative of near work), ambient light levels greater than 50 K lux (device pointing at the sky or sunlit pavement), and events separated by fewer than 20 s (not considered interruptions, but rather continuous erratic behavior by a subject). In summary, two events were considered separate if their timestamps were separated by more than 20″. This definition of event was adopted because in real-world smartphone usage, a subject's face can be missing from the camera image for several seconds e.g. when the user's hand, hair or another object passes in front of the camera, and many other circumstances.
Statistical analysisIntra- and inter-subject means and standard deviations (SD) of digital habits values were calculated, and a linear regression analysis was performed to assess the correlation between SER and AL with each of the factors. In addition, comparisons were made between digital habits in myopic subjects (SER < −0.5 D) and non-myopic subjects (SER ≥ −0.5 D). Either a parametric Student's T-test or a non-parametric Wilcoxon Mann-Whitney test (W-M) was used in case it was not possible to meet the assumptions of normality and homoscedasticity. The statistical analyses were carried out using RStudio v.2022.7.2.576.
ResultsMean values, standard deviation and range of SER and AL obtained in the clinic in the population were: −1.82 ± 2.15 [−7.75, +6.50] D and 24.01 ± 1.03 [21.8, 26.82] mm, respectively. Out of 82 included subjects 25 were non-myopic (+0.23 ± 1.30 D) and 57 were myopic (−3.09 ± 1.84 D). The app collected a total of 3677 h of data (13,237,139 discrete data points at 1 Hz with an inter-subject mean of 161.43 ± 326.47 s). The sum of the data collected by the app corresponding to daily screen time, face-device distance and ambient light level results in a total of approximately 40 million data (13,237,139 discrete data point multiplied by 3 factors). The total number of events were 19,828 with an inter-subject mean of 2.26 ± 3.86 events. The median value was taken into account to characterize a better distribution of the ambient lighting data, since for example, a person may be outside for 2 min on a sunny day (>10,000 lx) and indoors for 2 h (50 lux), and those 2 min outdoors would overestimate the mean value (Table 1).
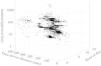
Fig. 1 shows a 3D representation of all data points collected by a subject in one day in a coordinate system comprising face-device distance, ambient light level and hour of day. In this example 3592 data points were collected at 1 Hz (adding up to approximately 1 h of data). As an example, it can be seen that no data is shown between midnight and 8 am, indicating that the subject probably did not use the phone or look at its screen during that period of time.

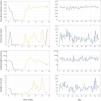
Fig. 2 presents the hourly mean values of data points in Fig. 2 (left column) and daily means for the whole data collection period (right column). The changes in digital habits during the day are easier to see than in Fig. 1. Last row includes the number of events per hour and the second column shows the same digital habit but averaged by day during the whole period of the measurements.

Example of mean digital habits values in one subject during every hour of a particular day (left column) or during the whole day (right column). In the left column, black line represents night hours while yellow line represents day hours. In the right column, green line shows weekends and blue line shows weekdays. Day 1 corresponds to Monday, November 22nd 2021. Events data (last file) are presented as the number of events per hour (left column) or per day (right column). Although the data is discrete, it is represented with a continuous line for legibility. Ambient light level plots are represented on a logarithmic scale.
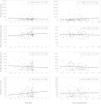
Fig. 3 shows the results of the correlation between each digital habit, the SER (left column) and the AL (right column). Each data point represents the mean correlation for one subject.

For the sample analyzed size and for a given level of significance of 0.05 and a power of 80%, the t-values obtained were always bellow the critical t-value (1.99), indicating a non-significative slope after the least square fittings showed in Fig. 3.
Myopic vs non-myopic subjectsTable 3 shows the mean values of each of the digital habits’ factors (daily screen time, face-device distance, ambient light level and number of events per day) in myopic and non-myopic groups together with p-values obtained from the statistical analysis of differences between both groups for each of the factors.
For the face-device distance and number of events per day the assumptions of normality (p = 0.762 and p = 0.957, respectively) and homoscedasticity (p = 0.283 and p = 0.191, respectively) were met. The parametric Student's t-test revealed that there were no statistically significant differences between myopes and non-myopes (p = 0.882 and p = 0.077, respectively).
For the ambient light level and daily screen time, the assumptions of normality were not met (p = 0.005 and p = 6.76·10–5, respectively). The non-parametric W-M revealed that there were no significant differences between myopes and non-myopes (p = 0.574 and p = 0.556, respectively).
Given the large variability of the results obtained in the sampled studied, our estimations suggest that depending on parameter to study a sample size of between 120 and 3500 participants would be required to achieve a statistical power of 80%.
DiscussionObjective data on visual behavior and digital habits were collected from 82 mobile device users through an app. The average values obtained for each habit are collected in Table 1. The average number of data points obtained per subject was about half a million, and the total number of data was approximately 40 million samples of face-device distance, daily screen time, ambient light level and number of events per day. It is important to point out one limitation of the present study wherein the digital habits data would not be registered when the app was disabled by the user or because of an error or crash. To avoid this problem, researchers monitored the data collected by every subject, and when less than a full day of data was detected, the subject was contacted to troubleshoot. This lack of data probably represents the most important limitation of the study.
As seen in Fig. 2 many of the highest values for daily screen time or the number of events per day occur on weekends. Ambient light levels show large changes (up to 1.5 orders of magnitude) depending on hour of the day, probably indicating that the phone is used in different environments. Second column of Fig. 2 shows hour ranges where the smartphones hardly collected any data, which correspond to night time.
In 2015, the VICON© system, a technology specialized in motion capture, was used to measure the average face-device distance during smartphone use which was 338 ± 51 mm.37 Enthoven et al. measured it using the front camera in 525 young people while they were completing a questionnaire and obtained an average working distance of 291 ± 63 mm.31 These results are similar to the face-device distance obtained in the present study (355 ± 67 mm). Furthermore, Soler et al. also took face-device distance measurements in 454 subjects using the same methodology as in the Enthoven study and found that at 318 mm it was shorter than a typical near-work distance. Their study revealed no correlation between face-device distance and a typical near-work distance (r = 0.206, p = 0.053).38
In 2019, Wen et al. investigated children from urban and rural areas where they found significant differences between myopic and non-myopic children in terms of both face-device distance (309 ± 41 mm and 348 ± 39 mm, respectively) and ambient light level (614 ± 178 lux and 918 ± 257 lux, respectively) with a high degree of statistical significance p < 0.001.29 In 2020, Wen et al.39 obtained mean near work distances similar to the face-device distances revealed in the present study by using a wearable accessory Clouclip (Glasson Technology Co., Hang-Zhou, China). They found significant differences between myopic and non-myopic children (p = 0.011); myopic children worked 27 mm nearer than non-myopic children (312 ± 49 mm vs. 339 ± 34 mm, respectively). In the present study, no statistically significant differences were found between the myopic and non-myopic groups for any of the digital habits’ factors (p-values > 0.05).
Regarding ambient light level, Wen et al.39 also measured illuminance values with the Clouclip device and reported mean ambient light levels (305 ± 215 lux) that were similar to the present study (298 ± 201 lux for myopic and 308 ± 222 lux for non-myopic subjects, see Table 3). Dharani et al. found differences between mean levels of ambient light in students during school period and holidays (702.9 lux versus 950.9 lux) .40 Verkicharla et al. recorded target illuminance values in children using a fitness tracker (FitSight) device, obtaining a mean value of 731 ± 501 lux during a week, 621 ± 620 lux on weekends and 1005 ± 1031 lux on holidays (p = 0.16) .20 In 2017, Ostrin et al. used a wristband device (Actiwatch) in a school to measure 248 ± 168 lux of mean ambient light levels.41 Our findings on mean ambient light levels differ from those reported in previous studies, aligning more closely with the outcomes observed by Wen39 and Ostrin41 (305 ± 215 lux, see Table 1).
Differences from previous studies may also be explained by different geographic locations, season, and time of day. Large variations in lighting in groups and subjects are typical as one person can use the smartphone for a long time on a terrace (>50,000 lux) while another uses it too long at home with the windows closed, without outside light or even at night (< 50 lux).42
Correlations between digital habits and the SER or the AL was also evaluated. Pearson's correlation coefficient revealed no linear correlation between SER and any of the digital habits’ factors (Table 2). Notwithstanding, face-device distance, ambient light level and the number of events per day showed weak positive correlations coefficients with SER (r = 0.078, 0.042 and 0.184, respectively) indicating that high values of these factors correlate with a higher SER (became more positive which signifies less myopia). On the other hand, the correlation coefficient for the daily screen time and ambient light level were negative (r = −0.068), which indicates an inverse relationship, that is, a lower SER (more negative which signifies more myopia) with high values of daily screen time. In particular, Liu et al. reported that an increase in daily screen time by 1 h per day would yield a lower SER by −0.28D (more myopic).43 Regarding ambient light level, taking into account that it is many orders of magnitude greater outdoors than indoors our results are in agreement with other studies that found lower values of SER in subjects that spend longer times outdoors.4 In terms of the number of events per day, our results are in agreement with that from Enthoven et al.31 who found a weak negative correlation between the continuous use of the device without events, for more than 20 min and SER.
Statistical summary: digital habits factors versus SER (top) and digital habits factors versus AL (bottom). The columns represent, from left to right: the linear fit equation, the Pearson R coefficient, p-value, lower limit of agreement, and upper limit of agreement.
Regarding the correlation of the abovementioned digital habits factors with AL, Pearson's correlation coefficient revealed no correlations between digital habits factors and AL. Daily screen time and number of events per day showed positive correlation coefficients, in agreement with the results obtained by others, who showed an association between excessive screen time and myopia.44,45 The correlation coefficients for the face-device distance and ambient light level were negative, which indicates an inverse relationship, that is, the greater the distance or illuminance values, the shorter the AL. This result is in agreement with certain studies based on questionnaires.4,15
In Fig. 3, some correlations coefficients between digital habits and SER or the AL are opposite as one would expect. Positive correlation coefficients were expected between face-device distance, ambient light level, and number of events with SER; that is, higher values of these factors were expected to correspond to a greater SER (more positive). Additionally, a negative correlation between time and SER was expected, where a high daily screen time value was expected to be associated with a lower SER (more negative). Despite very weak correlation coefficients, all factors except ambient light level met expectations.
The expected correlations for axial length were opposite to those expected for SER; that is, higher values of face-device distance, ambient light level, and number of events were expected to correspond to a shorter AL. Additionally, a high daily screen time value was expected to be associated with a greater AL. Despite weak correlation coefficients, all factors except number of events per day met expectations. This result does not agree with that of Enthoven et al.31 who found a weak negative correlation between AL and number of events (R2 = 0.014 (OD) and R2 = 0.012 (OS)).
No statistically significant differences were found in digital habits between the myopic and non-myopic group, although the differences in number of events showed a p-value close to the significance, p = 0.077 (Table 3). Additionally, the number of events or near vision interruptions are related to interruptions in hyperopic defocus. Interrupting hyperopic defocus for even brief periods of time is also known to reduce myopia development in chicks, tree shrews, and primates.32,33
The method employed for collecting objective data on digital habits using smartphones is subject to certain limitations. Specifically, with respect to the acquisition of face-device distance values, and the inclination of the smartphone screen may introduce variability in the measurements.21 Additionally, some participants either deactivated the monitoring app or failed to restart it, resulting in incomplete data collection and potentially skewing the average usage time values. Consequently, the reported average usage times may deviate considerably from the actual values. Furthermore, this study did not include data on other digital devices such as tablets and computers, where digital habits and visual demands may differ. Conversely, when exploring myopia and its progression factors, it becomes pertinent to obtain objective data on proximal working distances, facial illumination, and the time allocated to each of these factors.
In conclusion, this baseline study has contributed to understanding the relationship between digital habits and ocular parameters (SER and AL). A novel methodology was introduced, enabling the collection of objective data on digital habits within participants' natural environments, thus minimizing the limitations of traditional laboratory settings. The findings indicated a weak, non-significant correlation between SER or AL and factors such as viewing distance, illuminance, screen time, and the number of daily events. Although no significant relationship was found in this sample, the approach used lays the foundation for future research with larger samples, supported by greater statistical power.
Funding informationNone.


