


To evaluate changes in the thickness of the crystalline lens components in children with different refractive errors before and after cycloplegia.
Methods and AnalysisThis prospective study recruited 132 right eyes from 132 children (age 5–15 years) with different spherical equivalent (SE) ranging from −6.00 diopters (D) to +6.75 D. We categorized these eyes into non-myopia (N = 30), low-myopia (N = 77), and moderate-myopia (N = 25) groups. The thickness parameters of the crystalline lens components, including lens thickness (LT), lens nucleus thickness (LNT), anterior cortex thickness (ACT), and posterior cortex thickness (PCT), were assessed using optical coherence tomography before and after 0.5 % tropicamide-induced cycloplegia.
ResultsAfter cycloplegia, LT significantly decreased from 3.47 ± 0.20 to 3.41 ± 0.20 mm in non-myopia eyes (P < 0.05), and from 3.30 ± 0.17 to 3.27 ± 0.16 mm in low-myopia eyes (P < 0.05), with no significant changes in moderate-myopia eyes (P < 0.05). LNT decreased from 3.15 ± 0.19 to 3.09 ± 0.19 mm in non-myopia eyes (P < 0.05), and from 3.02 ± 0.20 to 2.99 ± 0.17 mm in low-myopia eyes (P < 0.01), with no reduction observed in moderate-myopia eyes (P > 0.05). Cycloplegia-induced changes in ACT and PCT (all P > 0.05) did not differ significantly between the groups. SE was positively correlated with LT and LNT before (Pearson's r = 0.353 and 0.272, respectively; both P < 0.05) and after cycloplegia (r = 0.285 and 0.198, respectively; both P < 0.05).
ConclusionsLT and LNT significantly decreased after cycloplegia induced by 0.5 % tropicamide in children with non-myopia and low-myopia, while neither ACT nor PCT changed significantly. SE was positively correlated with LT and LNT.
The refractive status of the eye typically changes throughout an individual's lifespan.1 During early childhood, most children exhibit hyperopia, which usually decreases during growth years, leading to emmetropia in adulthood. The elongation of ocular axial length usually maintains a delicate equilibrium with decreases in crystalline lens and cornea refractive power to preserve emmetropia.2 Although the cornea contributes two-thirds of the entire refractive power of the eye, the changes in corneal power are limited following a rapid reduction within the first two years of life.3 In contrast, during childhood growth, the lens undergoes compaction and remodeling of fiber cells in the lens interior, resulting in decreased axial thickness and a flattening and reduction in optical power.4,5
The crystalline lens comprises of five distinct layers, with a prominent cortex and nucleus surrounded by delicate cysts.6 Although the refractive power of the lens and its various lenticular components cannot be directly measured in vivo, this power is highly correlated with its morphology and can be calculated using a specific formula.7 Among the lenticular components, thickness and curvature play major roles in determining the refractive power during accommodation.3 Previous studies have reported significant alternations in lens curvature and radii during accommodation or cycloplegia, the latter of which represents a relaxed or low accommodative state.3,8 However, further analysis is needed to investigate the impact of accommodation or cycloplegia on lenticular components.
Recent studies have investigated the effects of accommodation lag on myopia progression.9,10 The Helmholtz accommodative theory proposes that the ciliary muscle plays a crucial role in accommodation.6,11 Relaxed ciliary muscle increases zonule tension to apply force on the lens, resulting in lens stretching and reduced lens curvature.12 Cycloplegic refraction is considered the gold standard for myopia evaluation due to the robust accommodation function of children.13 While previous studies have used cycloplegic eye drops to demonstrate the significant morphological alterations of the lens and the changes in lenticular refractive power, how the thicknesses of the main lens components change in accommodation or cycloplegia remains unknown.14
Optical coherence tomography (OCT) is a rapid, noncontact, and precise technology for in vivo and real-time biometric measurements.15 Depending on optical pixel density, OCT can be used to analyze the thicknesses of the three major components of the cataractous lens.16
In this study, we evaluated cycloplegia-induced alterations in the thickness of crystalline lens components in children aged 5–15 years and their potential correlations with ocular metrics. Additionally, we compared the baseline and altered values among three refractive statuses, including non-, low- and moderate-myopia.
Materials and methodsParticipantsThis prospective study was conducted in strict accordance with the tenets of the Declaration of Helsinki and approved by the Ethics Board of the Eye & Ear, Nose, and Throat Hospital of Fudan University (EENT) (No.2020530).
This study recruited children who visited the EENT between June and August 2024. These participants acquired for initial screening or subsequent follow-up. Participants with a medical history of ocular conditions other than refractive errors, those diagnosed with amblyopia, strabismus, or anisometropia, and individuals with preexisting systemic conditions were excluded from the study. Additionally, participants who had previously been prescribed corrective single vision spectacles for refractive errors were included, but participants who underwent other myopia control or intervention methods were excluded, such as atropine or defocus spectacles.
Definitions of refractive groupsBased on the SE after cycloplegia, we categorized the participants’ eyes into non- (SE ≥ 0D, including both emmetropes and hyperopes), low- (SE −3.00D to −0.50D), and moderate- (SE −6.00D to −3.25D) myopia groups.
Ocular metric evaluation and cycloplegiaBefore inducing cycloplegia, spectral-domain OCT (Colombo IOL II, Moptim, Jiangxi, China) was used to obtain the ocular and crystalline lens parameters. The ocular parameters included axial length (AL), anterior chamber depth (ACD), mean front corneal keratometry (Kmean), central corneal thickness (CCT), white-to-white ratio (WTW), pupil diameter (PD), and lens thickness (LT).
Subsequently, 0.5 % tropicamide eye drops were administered to both eyes of each participant every 5 mins for a total of five times. After waiting for 30 min to allow full pupil dilation, another OCT examination was performed by the same physician (Y. B.). The sphere and cylinder were measured via autorefraction and manifest refraction after cycloplegia.
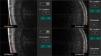
The original image of the entire lens was captured using the technique system, as depicted in Fig. 1. The crystalline lens components can be divided into three major parts—the anterior cortex, lens nucleus, and posterior cortex—according to the differences in optical density. By identifying the four spikes (with higher gray level as depicted in Supplementary Fig. 1) at the interface of the crystalline lens components, software (ImageJ; National Institutes of Health, Bethesda, MD) evaluated the thicknesses of these components, including the anterior cortex thickness (ACT), lens nucleus thickness (LNT), and posterior cortex thickness (PCT) by quantifying the ratio of the distance (the thickness of components) to the number of pixels (Supplementary Fig. 1). The Cortex D-Value was defined as the difference between the anterior and posterior cortices (Cortex D-Value = ACT–PCT), as previously reported.16

Four spikes of the crystalline lens components. The differences in readings between the spikes indicate the following lens components: A1 and B1 spikes (lens thickness), A1 and A2 spikes (anterior cortex thickness), B1 and B2 spikes (posterior cortex thickness), and A2 and B2 spikes (lens nucleus thickness).
A power analysis was conducted using G*Power software version 3.1, with an α set at 0.05, a sample size of N = 132, and an effect size f = 0.25 (indicating a medium effect). The calculated statistical power is 0.72. All statistical analyses were performed using IBM SPSS Statistics for Windows, version 27.0 (IBM Corp., Armonk, NY, USA). The results are represented as means ± standard deviation (range). Δvalues were calculated using as the metrics after cycloplegia minus the value before cycloplegia. The normality of the data was evaluated using the Shapiro-Wilk test and confirmed through a homogeneity of variance test. We conducted paired sample t-tests to compare the ocular metrics and lens component parameters before and after cycloplegia. Interclass comparisons among the three refractive groups were conducted by one-way analysis of variance (ANOVA), with pairwise post-hoc t-test comparisons and Bonferroni or Tamhane correction for equal or unequal sample sizes. Categorical variables were compared using the chi-square test. We applied Pearson's correlation coefficient and multiple linear regression analysis to examine the correlations between lenticular and ocular parameters before and after cycloplegia. P < 0.05 was considered statistically significant.
ResultsBaseline characteristics and changes in ocular parameters before and after cycloplegiaThis study included a total of 132 eyes from 132 children (76 boys and 65 girls; age 9.40 ± 2.02 years, range 5–15 years) with spherical equivalent (SE, SE = spherical + astigmatism/2) ranging from −6.00 diopters (D) to 6.75D (mean −1.27 ± 2.11 D). The non-myopia, low-myopia, and moderate-myopia groups included 30 (SE = 1.56 ± 1.58D [0D, +6.75D]), 77 (SE = −1.44 ± 0.77D [−3.00D, −0.50D]), and 25 (SE = −4.11 ± 0.95D [−6.00D, −3.25D]) eyes, respectively.
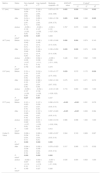
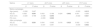
Table 1 shows the demographic characteristics and ocular metrics of the three refractive groups. Age differed significantly between the non-myopia group and the two other myopia groups (both P < 0.01), but not between the low- and moderate-myopia groups (P > 0.05). SE and AL showed significant variations among all three groups (all P < 0.05). ACD differed significantly between the non-myopia and the two other myopia groups (all P < 0.05), but not between the low- and moderate-myopia groups. No other ocular metrics, including Kmean, CCT, WTW, and PD, differed significantly before and after cycloplegia, (all P > 0.05).
Demographic and ocular metrics of participants.
| Metrics | Status | Non-Myopia | Low-Myopia | Moderate-Myopia | ANOVA P-value | P-valueb | ||
|---|---|---|---|---|---|---|---|---|
| 1T | 2T | 3B | ||||||
| Number | 30 | 77 | 25 | 0.068c | 0.030 | 0.072 | ||
| (boys%) | (66.67 %) | (62.34 %) | (32.00 %) | |||||
| Age/years | 8.13 ± 2.00 | 9.55 ± 1.83 | 10.48 ± 1.87 | <0.001 | 0.004 | 0.102 | <0.001 | |
| (5,14) | (7,15) | (8,15) | ||||||
| SE/D | 1.56 ± 1.58 | −1.44 ± 0.77 | −4.11 ± 0.95 | <0.001 | <0.001 | <0.001 | <0.001 | |
| (0, 6.75) | (−3.00, −0.50) | (−6.00, −3.25) | ||||||
| AL/mm | Before | 22.77 ± 0.9 | 24.31 ± 0.78 | 25.4 ± 1.04 | <0.001 | <0.001 | <0.001 | <0.001 |
| (20.97, 24.79) | (22.4, 26.59) | (22.51, 28.19) | ||||||
| After | 22.77 ± 0.9 | 24.31 ± 0.78 | 25.4 ± 1.04 | <0.001 | <0.001 | <0.001 | <0.001 | |
| (21, 24.75) | (22.4, 26.57) | (22.52, 28.16) | ||||||
| Δvalue | −0.004 ± 0.031 | −0.001 ± 0.022 | −0.004 ± 0.015 | 0.766 | 0.956 | 0.806 | 1.000 | |
| (−0.08, 0.05) | (−0.06, 0.04) | (−0.03, 0.02) | ||||||
| P-valuea | 0.479 | 0.649 | 0.163 | |||||
| ACD/mm | Before | 3.60 ± 0.23 | 3.82 ± 0.22 | 3.86 ± 0.21 | <0.001 | <0.001 | 0.750 | <0.001 |
| (3.13, 4.26) | (3.21, 4.38) | (3.47, 4.25) | ||||||
| After | 3.70 ± 0.22 | 3.89 ± 0.21 | 3.91 ± 0.23 | <0.001 | <0.001 | 0.953 | 0.001 | |
| (3.38, 4.34) | (3.36, 4.44) | (3.51, 4.35) | ||||||
| Δvalue | 0.104 ± 0.076 | 0.073 ± 0.064 | 0.053 ± 0.063 | 0.018 | 0.160 | 0.440 | 0.017 | |
| (−0.08, 0.25) | (−0.07, 0.29) | (−0.17, 0.14) | ||||||
| P-valuea | 0.000 | 0.000 | 0.000 | |||||
| Kmean/D | Before | 43.4 ± 1.55 | 43.13 ± 1.63 | 43.25 ± 1.63 | 0.734 | 0.813 | 0.985 | 1.000 |
| (40.87, 46.56) | (39.51, 46.96) | (39.22, 47.85) | ||||||
| After | 43.4 ± 1.61 | 43.09 ± 1.61 | 43.19 ± 1.68 | 0.671 | 0.752 | 0.990 | 1.000 | |
| (40.86, 46.79) | (39.4, 46.85) | (38.88, 47.84) | ||||||
| Δvalue | 0.00 ± 0.19 | −0.04 ± 0.16 | −0.06 ± 0.15 | 0.376 | 0.622 | 0.965 | 0.608 | |
| (−0.38, 0.56) | (−0.445, 0.35) | (−0.365, 0.245) | ||||||
| P-valuea | 0.958 | 0.030 | 0.081 | |||||
| CCT/μm | Before | 540.50 ± 32.83 | 537.56 ± 31.29 | 547.65 ± 33.55 | 0.395 | 0.966 | 0.473 | 1.000 |
| (466.9, 611.5) | (443.8, 611.7) | (484.2, 618.8) | ||||||
| After | 543.88 ± 33.88 | 540.80 ± 31.31 | 550.76 ± 34.39 | 0.413 | 0.964 | 0.500 | 1.000 | |
| (469.6, 609.7) | (446.5, 612.8) | (485.8, 634.8) | ||||||
| Δvalue | 3.373 ± 5.294 | 3.235 ± 5.094 | 3.112 ± 5.718 | 0.983 | 0.999 | 1.000 | 1.000 | |
| (−10.1, 11.4) | (−11.3, 14.9) | (−8.8, 16.0) | ||||||
| P-valuea | 0.002 | 0.000 | 0.012 | |||||
| WTW/mm | Before | 12.43 ± 0.40 | 12.45 ± 0.33 | 12.45 ± 0.51 | 0.969 | 0.993 | 1.000 | 1.000 |
| (11.61, 13.05) | (11.51, 13.28) | (11.8, 14.21) | ||||||
| After | 12.47 ± 0.41 | 12.47 ± 0.37 | 12.4 ± 0.51 | 0.774 | 1.000 | 0.916 | 1.000 | |
| (11.56, 13.14) | (11.62, 13.28) | (11.67, 14.11) | ||||||
| Δvalue | 0.033 ± 0.170 | 0.014 ± 0.154 | −0.052 ± 0.101 | 0.085 | 0.927 | 0.102 | 0.108 | |
| (−0.19, 0.5) | (−0.31, 0.42) | (−0.27, 0.23) | ||||||
| P-valuea | 0.291 | 0.439 | 0.016 | |||||
| PD/mm | Before | 5.78 ± 0.74 | 5.92 ± 1.02 | 5.99 ± 1.01 | 0.703 | 0.829 | 0.985 | 1.000 |
| (4.36, 7.43) | (3.58, 7.96) | (3.49, 8.17) | ||||||
| After | 8.34 ± 0.52 | 8.29 ± 0.69 | 8.26 ± 0.62 | 0.905 | 0.975 | 0.996 | 1.000 | |
| (7.02, 8.99) | (6.41, 9.68) | (7.24, 9.95) | ||||||
| Δvalue | 2.555 ± 0.816 | 2.373 ± 1.239 | 2.270 ± 1.257 | 0.643 | 0.758 | 0.979 | 1.000 | |
| (0.82, 3.68) | (0.33, 4.96) | (0.39, 4.8) | ||||||
| P-valuea | 0.000 | 0.000 | 0.000 | |||||
Data were expressed as mean ± standard deviation (range).
SE, spherical equivalent; D, diopters; AL, axial length; ACD, anterior chamber depth; Kmean, mean front corneal keratometry; CCT, central corneal thickness; WTW, white-to-white ratio; PD, pupil diameter.
Cycloplegia demonstrated significant effects on ocular metrics, with increases in ACD, CCT, and PD after cycloplegia in all three groups (all P < 0.05). Additionally, Kmean decreased in the low-myopia group while WTW increased in the moderate-myopia group (both P < 0.05). However, AL did not change significantly in any group after cycloplegia (all P > 0.05).
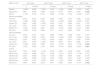
Changes in lens component thicknesses before and after cycloplegiaTable 2 and Fig. 3 present the results of the comparisons of the thicknesses of the crystalline lens components before and after cycloplegia. LT, ACT, and PCT before and after cycloplegia differed significantly between the non- and low-myopia groups (all P < 0.05). LT before and after cycloplegia, and LNT before cycloplegia differed significantly between the non- and moderate-myopia groups (all P < 0.05). No lens components differed significantly before and after cycloplegia in the low- and moderate-myopia groups (all P > 0.05). Additionally, Cortex D-Value differed significantly in all three refractive groups both before and after cycloplegia (all P < 0.01).
Comparisons among thickness metrics of the crystalline lens components before and after cycloplegia.
| Metrics | Status | Non-myopiaN = 30 | Low-myopiaN = 77 | Moderate-myopiaN = 25 | ANOVAP-value | P-valueb | ||
|---|---|---|---|---|---|---|---|---|
| 1T | 2T | 3B | ||||||
| LT (mm) | Before | 3.474 ± 0.202 | 3.303 ± 0.174 | 3.373 ± 0.175 | 0.002 | 0.029 | 0.244 | 0.002 |
| (3.01, 3.86) | (2.95, 3.66) | (3.02, 3.86) | ||||||
| After | 3.414 ± 0.196 | 3.269 ± 0.16 | 3.324 ± 0.158 | 0.005 | 0.048 | 0.366 | 0.005 | |
| (2.97, 3.71) | (2.95, 3.60) | (2.99, 3.75) | ||||||
| Δvalue | −0.059 ± 0.130 | −0.049 ± 0.127 | −0.034 ± 0.131 | 0.767 | 0.973 | 0.949 | 1.000 | |
| (−0.25, 0.25) | (−0.36, 0.25) | (−0.27, 0.24) | ||||||
| P-valuea | 0.018 | 0.001 | 0.208 | |||||
| ACT (mm) | Before | 0.216 ± 0.042 | 0.192 ± 0.045 | 0.185 ± 0.046 | 0.006 | 0.004 | 0.874 | 0.140 |
| (0.12, 0.31) | (0.12, 0.31) | (0.10, 0.34) | ||||||
| After | 0.214 ± 0.042 | 0.186 ± 0.029 | 0.189 ± 0.050 | 0.020 | 0.029 | 0.974 | 0.059 | |
| (0.12, 0.29) | (0.14, 0.23) | (0.10, 0.38) | ||||||
| Δvalue | −0.002 ± 0.035 | 0.004 ± 0.038 | −0.006 ± 0.036 | 0.446 | 0.841 | 0.542 | 1.000 | |
| (−0.07, 0.12) | (−0.11, 0.18) | (−0.11, 0.05) | ||||||
| P-valuea | 0.758 | 0.383 | 0.379 | |||||
| LNT (mm) | Before | 3.151 ± 0.191 | 3.018 ± 0.197 | 3.103 ± 0.177 | 0.029 | 0.572 | 0.172 | 0.026 |
| (2.65, 3.44) | (2.55, 3.30) | (2.75, 3.62) | ||||||
| After | 3.092 ± 0.191 | 2.988 ± 0.167 | 3.052 ± 0.160 | 0.075 | 0.673 | 0.271 | 0.072 | |
| (2.60, 3.35) | (2.54, 3.29) | (2.67, 3.52) | ||||||
| Δvalue | −0.059 ± 0.137 | −0.052 ± 0.134 | −0.03 ± 0.128 | 0.716 | 0.993 | 0.859 | 1.000 | |
| (−0.29, 0.28) | (−0.38, 0.28) | (−0.28, 0.23) | ||||||
| P-valuea | 0.027 | 0.001 | 0.247 | |||||
| PCT (mm) | Before | 0.121 ± 0.023 | 0.107 ± 0.030 | 0.096 ± 0.019 | <0.001 | <0.001 | 0.291 | 0.076 |
| (0.07, 0.16) | (0.07, 0.22) | (0.05, 0.15) | ||||||
| After | 0.121 ± 0.026 | 0.107 ± 0.026 | 0.097 ± 0.020 | <0.001 | <0.001 | 0.206 | 0.084 | |
| (0.08, 0.18) | (0.07, 0.20) | (0.05, 0.15) | ||||||
| Δvalue | 0.000 ± 0.022 | 0.001 ± 0.016 | 0.000 ± 0.018 | 0.986 | 0.998 | 1.000 | 1.000 | |
| (−0.07, 0.05) | (−0.05, 0.05) | (−0.02, 0.06) | ||||||
| P-valuea | 1.000 | 0.729 | 0.912 | |||||
| Cortex D-Value | Before | 0.096 ± 0.034 | 0.089 ± 0.04 | 0.085 ± 0.037 | 0.564 | 0.743 | 0.969 | 0.927 |
| (0.04, 0.17) | (0.03, 0.21) | (0.03, 0.19) | ||||||
| P-valuec | 0.000 | 0.000 | 0.000 | |||||
| After | 0.094 ± 0.036 | 0.092 ± 0.048 | 0.078 ± 0.023 | 0.317 | 0.995 | 0.175 | 0.532 | |
| (0.02, 0.19) | (0.02, 0.28) | (0.03, 0.12) | ||||||
| P-valuec | 0.000 | 0.000 | 0.000 | |||||
| Δvalue | −0.002 ± 0.037 | 0.003 ± 0.043 | −0.007 ± 0.034 | 0.535 | 0.904 | 0.563 | 1.000 | |
| (−0.12, 0.12) | (−0.16, 0.17) | (−0.1, 0.06) | ||||||
| P-valuea | 0.769 | 0.527 | 0.326 | |||||
Before, before-cycloplegia metrics; After, after-cycloplegia metrics; Δvalue, differences between after- and before-cycloplegia metrics; Δvalue, after-cycloplegia value – before-cycloplegia value; ANOVA, one way analysis of variation.
LT, lens thickness; ACT, anterior cortex thickness; LNT, lens nucleus thickness; PCT, posterior cortex thickness; Cortex D-Value, the differences between anterior and posterior cortex in the same status, Cortex D-Value, ACT–PCT.
Regarding alternations in lens component metrics before and after cycloplegia, LT significantly decreased from 3.47 ± 0.20 to 3.41 ± 0.20 mm in non-myopia eyes (P < 0.05), and from 3.30 ± 0.17 to 3.27 ± 0.16 mm in low-myopia eyes (P < 0.01), with no significant changes in moderate-myopia eyes (P > 0.05). Additionally, LNT decreased significantly from 3.15 ± 0.19 to 3.09 ± 0.19 mm in the non-myopia group (P < 0.05), and from 3.02 ± 0.20 to 2.99 ± 0.17 mm in the low-myopia group (P < 0.01), with no changes in eyes with moderate-myopia (P > 0.05). ACT and PCT did not change significantly in any of the three groups (all P > 0.05).
A significant difference in thickness between the anterior and posterior cortex was observed in all three groups before and after cycloplegia, in which the anterior cortex was thicker than the posterior cortex in children, as indicated by the Cortex D-Value (all P < 0.01).
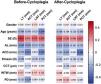
Correlations between biological parameters and crystalline lens component thickness metrics before and after cycloplegiaFig. 2 and Supplementary Table 1 illustrate the correlations between the thicknesses of the crystalline lens components and other metrics. Age was significantly correlated with LT and PCT before cycloplegia (both P < 0.05). SE was significantly positively correlated with all thickness metrics of the crystalline lens components before and after cycloplegia, including LT (Pearson's r = 0.353 and 0.285, respectively; both P < 0.01), ACT (r = 0.214 and 0.230, respectively; both P < 0.05), LNT (r = 0.272 and 0.198, respectively; both P < 0.05), and PCT (r = 0.265 and 0.251, respectively; both P < 0.01). The association among three groups was further shown in Fig. 3. ACD was significantly negatively correlated with ACT (r = −0.291, −0.221, respectively; both P < 0.05) and PCT (r = −0.290, −0.339, respectively; both P < 0.01) before and after cycloplegia. ACT was negatively correlated with PD before cycloplegia (r = −0.239, P < 0.05); however, the correlation diminished after cycloplegia (P > 0.05).

Correlation heatmap of the thickness metrics of the crystalline lens components and other ocular metrics. Pearson's correlation coefficients are shown in squares, with colors indicating positive (red) or negative (blue) correlations between the thickness metrics of the crystalline lens components and other metrics before and after cycloplegia. According to the Pearson's correlation analysis, the threshold for statistical significance is 0.171. LT, lens thickness; ACT, anterior cortex thickness; LNT, lens nucleus thickness; PCT, posterior cortex thickness; SE, spherical equivalent; D, diopters; AL, axial length; ACD, anterior chamber depth; Kmean, mean front corneal keratometry; CCT, central cornea thickness; WTW, white-to-white; PD, pupil diameter.
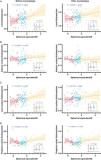
![Linear regression analysis among three refractive subgroups and comparisons. The primary figures demonstrated a linear relationship between the thickness of crystalline lens components and spherical equivalent (SE, diopters [D]). The within figures illustrated the intergroup comparisons conducted via one-way analysis of variance, with subsequent Bonferroni or Tamhane post-hoc tests. Statistical significance is denoted by asterisks: ⁎⁎P < 0.01, ⁎⁎⁎P < 0.001, and ⁎⁎⁎⁎P < 0.0001. Not significant comparisons are marked as "ns."](https://static.elsevier.es/multimedia/18884296/0000001800000001/v1_202503101130/S1888429625000056/v1_202503101130/en/main.assets/gr3.jpeg?xkr=ue/ImdikoIMrsJoerZ+w93meMsSv3kCFu9ka1kgzl/xrK32s3f4YRcWD6Dd7AXar4zIXM1naIWBO394f0Soi6K8rC35Pod0XjXpczqcvMyRlVVwm8Av2ZH0pHc7UlJ92gJCDHRnOgduLsk4PObW8VAcNx7b9NOtUX5aJePWfyLQMWsKGzOiEyYEe6tUPy9brazT1Nc+zFJzFsVi0MQCzupDIypg4Q8wkhl/ZR0xRBf34o2BILygn0b5M6AaKAlCasRNTkTftPxOG0IMTbO2ocg==)
Linear regression analysis among three refractive subgroups and comparisons. The primary figures demonstrated a linear relationship between the thickness of crystalline lens components and spherical equivalent (SE, diopters [D]). The within figures illustrated the intergroup comparisons conducted via one-way analysis of variance, with subsequent Bonferroni or Tamhane post-hoc tests. Statistical significance is denoted by asterisks: ⁎⁎P < 0.01, ⁎⁎⁎P < 0.001, and ⁎⁎⁎⁎P < 0.0001. Not significant comparisons are marked as "ns."
Table 3 presents the results of a multiple linear regression analysis examining the factors influencing the thickness metrics of the crystalline lens components. Before cycloplegia, ACT was significantly correlated with ACD and PD (β = −0.038, −0.009, respectively, both P < 0.05); however, this correlation became non-significant after cycloplegia (P > 0.05). Before cycloplegia, PCT was negatively correlated with age and ACD (β = −0.003, −0.022, respectively, both P < 0.05); however, after cycloplegia, PCT was only negatively correlated with ACD (β = −0.033, P < 0.01).
Univariable linear regression analysis of influencing factors on thickness metrics of the crystalline lens components.
LT, lens thickness; ACT, anterior cortex thickness; LNT, lens nucleus thickness; PCT, posterior cortex thickness; SE, spherical equivalent; D, diopters; ACD, anterior chamber depth; PD, pupil diameters.
β: Estimate in multivariable linear regression analysis.
Bold indicates statistically significance.
Table 4 presents the factors influencing the changing values (Δvalue) of the lenticular component thicknesses. The Δvalue of PCT was positively associated with age (r = 0.180, P < 0.05) but negatively with PD after cycloplegia (r = −0.290, P < 0.01). Conversely, the other Δvalues of the lenticular components showed no correlation with the change of ocular metrics before and after cycloplegia (all P > 0.05).
Factors influencing changes in thickness metrics of the crystalline lens components.
| Metrics (mm) | ΔLT (mm) | ΔACT (mm) | ΔLNT (mm) | ΔPCT (mm) | |||||
|---|---|---|---|---|---|---|---|---|---|
| ra | P-value | r | P-value | r | P-value | r | P-value | ||
| Gender | −0.008 | 0.926 | −0.029 | 0.740 | −0.004 | 0.966 | −0.013 | 0.880 | |
| Age (years) | 0.051 | 0.562 | 0.058 | 0.510 | 0.019 | 0.831 | 0.180 | 0.039 | |
| SE (D) | −0.135 | 0.124 | 0.019 | 0.828 | −0.129 | 0.139 | −0.023 | 0.797 | |
| Before-cycloplegia | |||||||||
| AL (mm) | 0.072 | 0.413 | 0.018 | 0.836 | 0.062 | 0.477 | 0.030 | 0.735 | |
| ACD (mm) | −0.048 | 0.583 | 0.040 | 0.648 | −0.048 | 0.585 | −0.050 | 0.567 | |
| Kmean (D) | 0.035 | 0.694 | −0.060 | 0.494 | 0.047 | 0.594 | 0.031 | 0.723 | |
| CCT (μm) | 0.051 | 0.560 | −0.017 | 0.846 | 0.055 | 0.530 | 0.079 | 0.365 | |
| WTW (mm) | −0.037 | 0.678 | 0.087 | 0.323 | −0.041 | 0.644 | −0.161 | 0.065 | |
| PD (mm) | −0.058 | 0.509 | 0.026 | 0.771 | −0.071 | 0.422 | 0.020 | 0.819 | |
| After-cycloplegia | |||||||||
| AL (mm) | 0.072 | 0.413 | 0.015 | 0.862 | 0.064 | 0.469 | 0.031 | 0.727 | |
| ACD (mm) | −0.055 | 0.535 | 0.056 | 0.526 | −0.054 | 0.539 | −0.085 | 0.333 | |
| Kmean (D) | 0.038 | 0.667 | −0.073 | 0.404 | 0.052 | 0.551 | 0.034 | 0.699 | |
| CCT (μm) | 0.051 | 0.560 | −0.042 | 0.634 | 0.063 | 0.471 | 0.068 | 0.441 | |
| WTW (mm) | −0.058 | 0.507 | 0.069 | 0.431 | −0.057 | 0.513 | −0.176 | 0.044 | |
| PD (mm) | −0.001 | 0.995 | 0.153 | 0.080 | −0.016 | 0.855 | −0.291 | 0.001 | |
| Δvalue | |||||||||
| ΔAL (mm) | 0.000 | 0.999 | −0.154 | 0.079 | 0.056 | 0.522 | 0.046 | 0.598 | |
| ΔACD (mm) | −0.015 | 0.869 | 0.047 | 0.595 | −0.014 | 0.878 | −0.109 | 0.213 | |
| ΔKmean (D) | 0.034 | 0.698 | −0.134 | 0.126 | 0.058 | 0.509 | 0.030 | 0.730 | |
| ΔCCT (μm) | 0.004 | 0.959 | −0.155 | 0.076 | 0.055 | 0.531 | −0.067 | 0.443 | |
| ΔWTW (mm) | −0.063 | 0.473 | −0.035 | 0.691 | −0.051 | 0.565 | −0.061 | 0.487 | |
| ΔPD (mm) | 0.048 | 0.587 | 0.063 | 0.471 | 0.049 | 0.574 | −0.177 | 0.042 | |
Δvalue = differences between after- and before-cycloplegia metrics, Δvalue = after-cycloplegia value – before-cycloplegia value.
LT, lens thickness; ACT, anterior cortex thickness; LNT, lens nucleus thickness; PCT, posterior cortex thickness; SE, spherical equivalent; D, diopters; AL, axial length; ACD, anterior chamber depth; Kmean, mean front corneal keratometry; CCT, central corneal thickness; WTW, white-to-white ratio; PD, pupil diameter.
Bold indicates statistically significant (P < 0.05).
In this study, we elucidated the altered thickness of crystalline lens components following tropicamide-induced cycloplegia in children aged 5–15 years, which was primarily attributed to changes in the lens nucleus rather than the cortex. Moreover, the changes in the posterior cortex thickness after complete cycloplegia may be negatively associated with PD (P = 0.042, Table 4). In addition, our findings demonstrated a significant correlation between SE and the thickness of specific lens components.
Based on the theory of OCT techniques and analysis of optical transparency, sweep-source OCT accurately stratifies the cataractous lens.16 Meanwhile, Brillouin microscopy effectively divides the lens into three layers based on its distinct biomechanical properties.17,18 Therefore, in this study, we initially categorized the lens into three major components: the anterior cortex, nucleus, and posterior cortex.
The mechanical properties of the lens cortex and nucleus are crucial factors influencing the lens's ability to change shape.19 Consistent with previous studies, our results revealed reduced LT and LNT following tropicamide-induced cycloplegia in both non- and low-myopia groups.20 Additionally, other studies have suggested that changes in nuclear thickness accounted for approximately 70 % of the total change in lens thickness in adults aged 29 years.21,22 Despite the variation in age range, we supposed that the cycloplegia-induced alteration in crystalline lens thickness can be attributed to changes in the nucleus. In contrast, the moderate-myopia group in the present study demonstrated no significant changes, possibly due to lower crystalline lens rise and thinner lens in higher myopic participants, as reported previously.23 Our findings further indicated differences between the non-myopia and both myopia groups in children aged 5–15 years, in which higher degrees of myopia were associated with thinner LT; however, low- and moderate-myopia eyes showed no significant differences. Moreover, we identified a significant correlation between lenticular thickness and other metrics including age and SE. With increasing age and myopia degree, the lens and lens nucleus thin, consistent with the observations reported by previous study in healthy adults.24
In this study, we did not observe alterations in ACT and PCT following cycloplegia across all three refractive groups, consistent with the findings reported by previous research.25 However, the magnitude of change in the cortex differs considerably among studies due to the use of different measurement methods. Using Scheimpflug imaging, Dubbelman et al. reported similar results, whereas Pour et al. found that the cortex accounted for 30 % of the thickness change in their analysis of finite element models.22,26 Furthermore, discrepancies in lens thickness changes may be attributed to an unclear definition of the cortex. The Hockwin system, which delineates 10 distinct turning points to indicate the extent of single lens layers, suggests a decrease in cortical thickness; however, the Oxford system, characterized by 8 different densitogram zones, indicates an increase in thickness during accommodation.26,27 These differences may be attributed to the varying methods of layer identification. In this study, we utilized OCT technique detailed images of the crystalline lens, providing new insights into the changes in component thickness. This approach differs from that of Scheimpflug imaging but aligns with previous classifications using similar OCT techniques.16,25 Our results also revealed a significantly negative relationship between ACT and PD before mydriasis. However, after cycloplegia, when all participants maintained the same accommodative status, ACT was not significantly correlated with PCT or PD.
In addition, ACT and PCT differed between the non- and low-myopia groups, in which the higher the degree of myopia, the thinner the cortex, and the older the children. Our results align with the general hypothesis regarding the balance between ocular axial length elongation and decreased lens refractive power.28 However, our findings contrast with previous studies, which reported a linear increase in cortex thickness with age in participants aged 4–80 years.4,29 According to Oxford system, the cortical zones could be divided into zone C1, C2 and C3.26 Previous studies have demonstrated that in the first decade there were only two distinct cortical zones, C1 and C2, and any decrease with age was due to compaction in zone C1.29 The participants in the present study had an average age of 9.5 years, therefore, the cortex thinning age can be attributed to this specific developmental stage.
Previous studies have confirmed cycloplegia-induced changes in ACD.30 Our results were consistent with those findings: after cycloplegia, ACD increased greatly, which could be attributed to the backward movements of the lens, and we also identified a negative relationship between ACD and LT.23,31 Furthermore, our results indicated that deeper ACD was associated with thinner lens and cortex, consistent with our previous Brillouin results.18 Similar to prior studies, we found that CCT significantly increased after cycloplegia across all three refractive groups.23,32 However, Zhang et al. reported no change in CCT after cycloplegia by tropicamide.20 These discrepancies may be due to the effect of corneal rehydration and the resolution limitation of OCT.33
Our study has several limitations. First, we focused on the components of the crystalline lens in eyes with different refractive error statuses while acknowledging that both lens morphology and refractive status are highly associated with age and may result in significant discrepancies in intragroup comparisons. Second, previous research has illustrated sex-based discrepancies in ocular metrics.34 However, in this study, the effect of sex on cycloplegia-induced alternation of the crystalline lens was statistically insignificant, which requires further investigation. Last, the use of five drops of 0.5 % tropicamide administered at five-minute intervals with a final waiting period of twenty minutes has been widely accepted for mydriasis in the Chinese pediatric population, this protocol is considered sufficient for achieving full mydriasis.13,23 Alternatively, commercially available 1 % cyclopentolate hydrochloride, following the standard protocol of two drops spaced fifteen minutes apart and an additional fifteen-minute waiting period, may also be a viable option.35
Our findings suggest that after cycloplegia, the lens nucleus plays a crucial role in the changes in the whole lens, while neither the anterior nor posterior cortexes change significantly, in children with non- and low-myopia. Additionally, SE was positively correlated with the thickness of the crystalline lens nucleus and the total lens thickness.
Ethic approval and consent to participateThe study was approved by the Ethics Committee Office of the Eye and ENT Hospital of Fudan University. All participants provided informed consent to participate in the study (Ethics No.: 20200530).
Consent for publishWritten informed consent was obtained from the patients for the publication of this paper. Patients’ names are not applicable.
Authors' contributionsStudy conception and design: Jing Zhao and Jian Cao; Data acquisition: Yongle Bao, Zhirong Zhang, Zhanying Wang and Jing Zhao; Data analysis: Jian Cao and Zhirong Zhang; Data interpretation: Lingling Niu, Yong Ma and Yanze Yu; Manuscript drafting: Yongle Bao, Zhirong Zhang, Jian Cao and Jing Zhao; Manuscript revision: Xingtao Zhou, Xiaoying Wang and Jia Huang; Final approval: Jing Zhao. All authors read and approved the final manuscript.
Zhao received funding from the following sources: National Natural Science Foundation of China (Grant No 82271119); Shanghai Rising-Star Program (23QA1401000); Healthy Young Talents Project of Shanghai Municipal Health Commission (2022YQ015); Project of Shanghai Science and Technology (21Y11909800); Hexi University President Fund youth research project (QN2024027); General topics of the 14th Five-Year Plan of Education Science of Gansu Province in 2024 (GS[2024]GHB1487). The funding agencies had no role in study design, data collection and analysis, interpretation of data, or writing the manuscript.


