


To determine the prevalence of burnout among optometrists in the United States and identify associated demographic and clinical factors.
MethodsA survey was distributed to optometrists via email listservs from the American Academy of Optometry and optometric societies. Participants completed a modified Mini Z Survey with 10 questions rated on Likert scale, followed by demographic questions. Burnout was classified as mild, moderate, or severe, with subgroup comparisons made using multinomial logistic regression.
Results1436 optometrists responded. 53.6 % of respondents reported symptoms of burnout: 61.4 % mild, 30.4 % moderate, and 8.2 % severe. Females reported higher burnout rates than males (60.9 % vs. 40.6 %, p < 0.0001). Optometrists with a spouse/partner in healthcare reported lower burnout (47.7 %) compared to those without (55.3 %, p = 0.0035). Respondents with children reported less burnout (49.6 % vs. 61.0 %, p < 0.0001). Burnout was less prevalent among those practicing <5 years (51.1 %) and 30+ years (33.7 %) compared to mid-career (5–29 years). Average number of clinic days was associated with burnout severity. Electronic health record (EHR) use was associated with higher rates of burnout (p = 0.0040). Respondents in private practice and academic settings reported the lowest burnout rates.
ConclusionsBurnout is a significant concern among U.S. optometrists, with female optometrists disproportionately affected. Protective factors include male gender, having children, both shorter and longer commutes, and specific work settings. Risk factors include female gender, increased clinic days, higher patient volume, and EHR use. Future research should focus on longitudinal studies of burnout, intervention-based studies to evaluate mitigation strategies, and qualitative research to explore gender differences and work-related stressors in optometry.
Burnout is a professional, work-related condition characterized by emotional exhaustion, cynicism, depersonalization, and a diminished sense of personal accomplishment.1 The term was introduced by psychiatrist Herbert Freudenberger in 1974, who noted that some of his patients were so exhausted they would light their cigarettes and forget to smoke them, letting the cigarette “burn out.”2
Burnout adversely affects several aspects of healthcare, with significant consequences for practitioners, patients, and the healthcare system. For practitioners, it leads to increased job turnover, reduced productivity, and higher rates of medical errors, which in turn can elevate the risk of malpractice lawsuits.3,4 Additionally, burnout can lead to substance abuse, suicidal ideation, depression, and a decreased quality of life.3,5 On the patient side, burnout contributes to lower patient satisfaction and decreased adherence to medical advice, potentially compromising patient outcomes.3,4 Burnout also affects teamwork and communication among healthcare providers, which can undermine the quality of care.3,4 Finally, burnout increases healthcare expenditures, as it may lead to unnecessary diagnostic testing and referrals, along with higher costs related to staff turnover and the need for additional resources to manage its effects.3,4
Prior research has identified risk factors of burnout to include inadequate paid time off, weekend work, heavy patient loads, staffing and resource shortages, administrative burdens, management of electronic health records, lack of meaningful work, job culture, work-life balance, among others.6,7 Demographic factors such as gender, practice setting, and geographical location also play a role in burnout.6,8 Moreover, the COVID-19 pandemic disproportionately affected healthcare workers in direct patient care, negatively impacting both physical and psychological health and further contributing to burnout.9
While burnout is a concern across various professions, healthcare workers in the United States experience it at rates estimated between 35 % and 50 %, which is up to twice as high as in non-healthcare professions.10,11 Although burnout has been extensively studied in various healthcare roles – including physicians, nurses, physician assistants, and nurse practitioners3 – there has only been one large-scale investigation into burnout within the optometric profession, which was conducted in Australia.12 To the authors’ knowledge, this is the first nationwide investigation of optometric burnout in the United States. The aim of this study is to determine the prevalence of burnout among optometrists and identify risk factors contributing to this condition. Understanding these factors is essential for addressing burnout and ensuring that optometrists can continue to deliver high-quality patient care while maintaining their own personal and professional well-being.
MethodsIn line with ethical standards, approval for this study was secured from the Colorado Multiple Institutional Review Board before the survey was distributed (Protocol #24–1505; 22-Aug-2024). The research adhered to the Health Insurance Portability and Accountability Act and followed the principles of the Declaration of Helsinki. All participants provided informed consent via survey participation.
The respondents completed a modified version of the Mini Z burnout survey, consisting of 10 items rated on 5-point Likert scales to evaluate burnout outcomes and contributing factors. The final open-ended question, “Please tell us about your stressors and potential solutions,” was not included in our survey. However, our survey retained all 10 main questions from the Mini Z survey, which are rated on a 5-point Likert scale. Additional questions related to demographics, clinical practice, and lifestyle were incorporated into the survey tool (see Supplemental Attachment).
The survey was distributed by the American Academy of Optometry (estimated at the time of the survey to be approximately 6266 members) through email listservs. Data were collected anonymously through Research Electronic Data Capture or REDCap (Vanderbilt, University). A total of 2 reminder emails were sent before the survey was closed for a total survey duration of 14 days the survey was open (September 3, 2024 – September 17, 2024). The survey was also distributed from various Optometrists (OD) groups including ODs on Facebook (∼45,300 members), Corporate Optometry Facebook post (∼32,500 members), ODs on Finance Facebook post (∼19,300 members), OD Finance Professionals Facebook post (∼2300 members), and an Optometry 360 website feature for 5 days. The Ocular Wellness and Nutrition Society (∼3838 members) also sent a single email to its listserv. To prevent duplicate entries, the survey introduction and consent included a request for respondents to complete the survey only once. The inclusion criterion was any United States optometrist by training. Participants who did not answer the primary burnout question (n = 5) were excluded from the statistical analyses.
The Maslach Burnout Inventory (MBI) is a frequently used 22-item survey assessing three components of burnout: emotional exhaustion, depersonalization, and reduced sense of personal achievement. Although the MBI is widely used, the aim of this study was not only to quantify burnout but also to highlight the potential drivers of this condition, which is why the Mini-Z survey was utilized. The Mini-Z survey, supported by the American Medical Association, is the most commonly used tool in clinical healthcare settings. The Mini-Z uses a Likert scale to assess burnout, stress, and job satisfaction, along with seven other risk factors for burnout: control over workload, sufficiency of time for documentation, job atmosphere, alignment of professional values with leadership, team efficiency, electronic health record (EHR) use at home, and EHR proficiency. The burnout measure (question 3) of the Mini-Z has been externally validated against the emotional exhaustion item of the MBI.13 The second page of the Mini-Z survey is also customizable to collect demographic and career-related information. Due to its simplicity, reliability, and focus on core burnout aspects within the medical profession, the Mini-Z survey is used in various healthcare settings worldwide.13–15 Recently, it was also employed to evaluate burnout in ophthalmologists with a similar study design.8 For these reasons, the Mini Z survey was selected for this particular study.
Question 3 (“Using your own definition of ‘burnout, please circle one of the answers:”) was used to define and classify self-reported burnout. Answer 1 (“I enjoy my work. I have no symptoms of burnout”) and 2 (“I am under stress, and don't always have as much energy as I did, but I don't feel burned out”) were categorized as “no burnout.” Answer 3 (“I am definitely burning out and have one or more symptoms of burnout, e.g., emotional exhaustion”) was categorized as mild burnout; Answer 4 (“The symptoms of burnout that I am experiencing won't go away. I think about work frustrations a lot”) as moderate burnout; and Answer 5 (“I feel completely burned out. I am at the point where I may need to seek help”) as severe burnout.
Statistical analysisBasic frequencies and percentages are presented for the three categories of self-reported burnout and other survey questions that were categorical. Means and standard deviations (SD) are reported for continuous variables and Likert scale items. Self-reported burnout was classified into three categories for the tables: no burnout, mild burnout, and moderate/severe burnout. In the text, these categories are often combined and referred to as total burnout, representing the sum of mild, moderate, and severe burnout. Prevalences of these three categories are presented by respondent characteristics and compared with Chi-square and ANOVA testing. A sensitivity analysis with a four-level outcome (no burnout vs mild, moderate, or severe burnout) was conducted to determine if moderate and severe burnout had similar associations when analyzed separately.
Univariate and multivariable multinomial logistic regression models were employed, using odds ratios and 95 % confidence intervals, to compare mild and moderate/severe self-reported burnout with no burnout. This analysis focused on demographic and practice characteristics that showed significant differences between burnout categories in Chi-square and ANOVA testing. All variables differing significantly between burnout categories in Chi-square and ANOVA testing were included in the multivariable model. Differences in the Mini-Z Likert scale questions between the three self-reported burnout categories were assessed with ANOVA testing. Means and 95 % confidence limits are presented graphically for these comparisons.
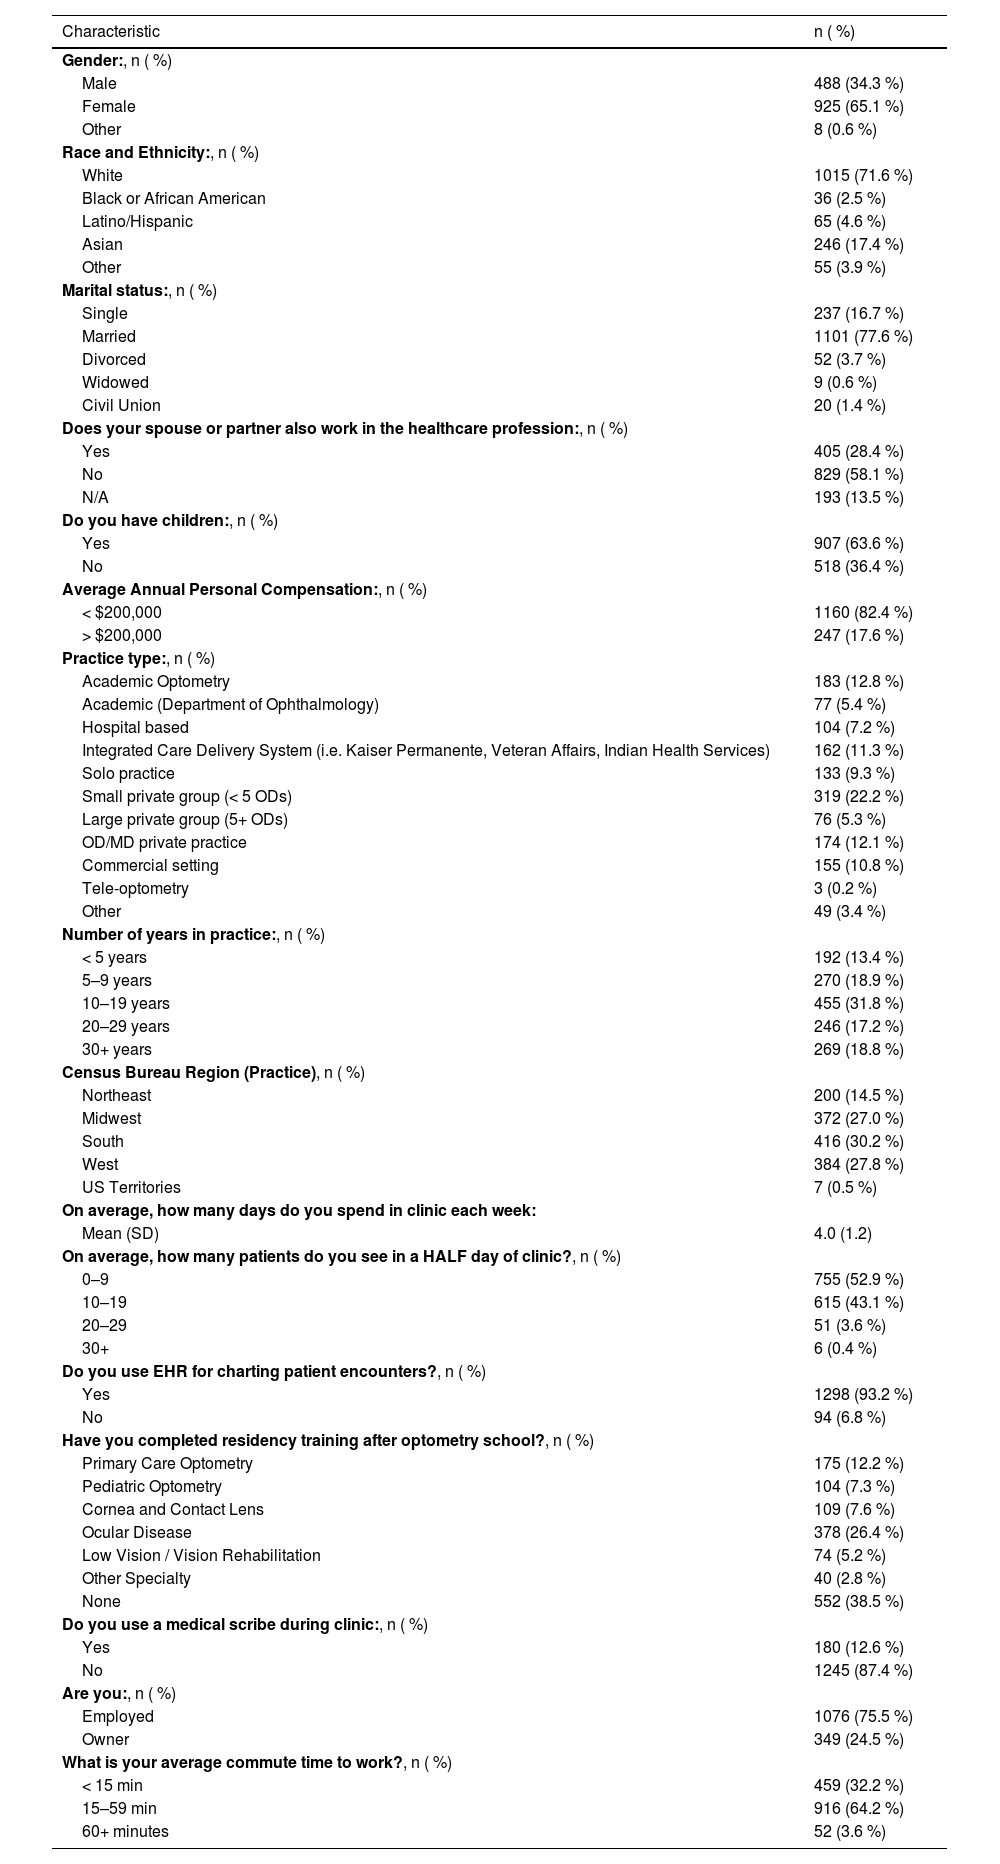
ResultsA total of 1436 optometrists responded to the survey. Of these respondents, 65.1 % were female, 71.6 % were white, and 77.6 % were married. Overall demographic and practice characteristics of the respondents are presented in Table 1. The mean number of days per week spent in clinic was 4.0 (SD: 1.2), with 52.9 % seeing, on average, 0–9 patients per half day of clinic and 43.1 % seeing 10–19 patients per half day.
Respondent demographic and clinical characteristics.
Note: Missing values for each field are not included in the percentages; the number for each are as follows: gender (n = 15), race/ethnicity (n = 19), marital status (n = 17), spouse/partner in healthcare (n = 9), having children (n = 11), annual compensation (n = 29), practice type (n = 1), number of years in practice (n = 4), region of practice (n = 59), days spent in clinic per week (n = 35), average number of patients seen in a half day clinic (n = 9), use of HER (n = 44), residency training (n = 4), use of medical scribe (n = 11), owner or employed (n = 11), average commute time (n = 9).
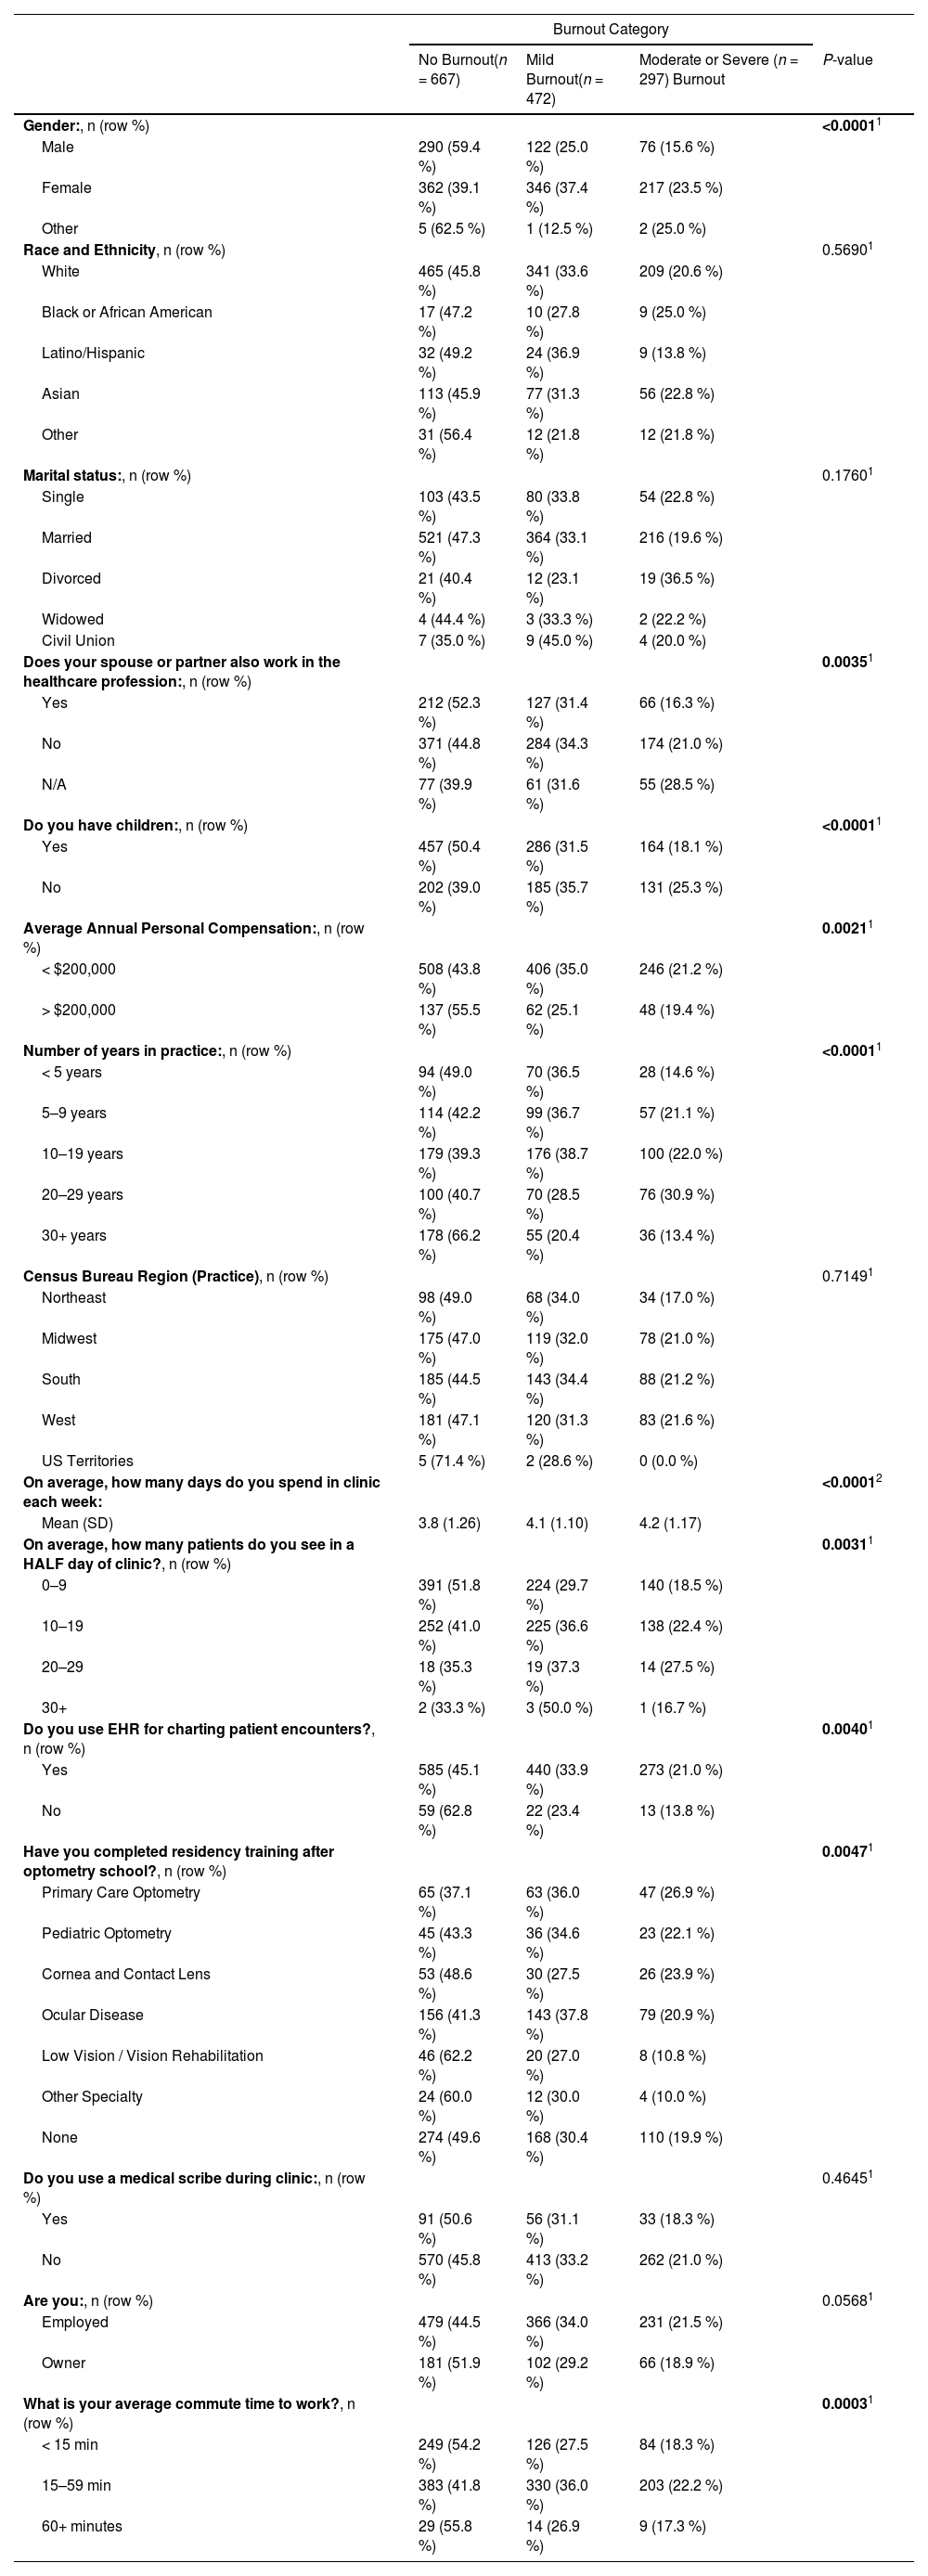
A total of 769 (53.6 %) optometrists self-reported symptoms of burnout. Among those reporting burnout, 61.4 % were classified as mild, 30.4 % moderate, and 8.2 % severe. Female optometrists reported significantly higher rates of any burnout than male optometrists (60.9 % vs 40.6 %, p < 0.0001). Females also reported a higher rate of severe burnout, 23.5 % versus 15.6 % for males. Individuals with a spouse or partner in healthcare reported a lower rate of burnout at 47.7 % compared to those with a spouse not working in healthcare, 55.3 % (p = 0.0035). Respondents with children (n = 907) reported significantly less burnout than those without children (n = 518) (49.6 % vs 61.0 %, p < 0.0001). Individuals reporting a personal compensation <200,000 United States dollars (USD) experienced significantly higher burnout rates at 56.2 % compared to those earning >200,000 USD, who had a burnout rate of 44.5 % (p = 0.0021). Several demographic factors, such as marital status, race and ethnicity, and geographic region, were assessed for potential associations with burnout and no significant associations were found.
Work environment and burnoutYears in practice and number of days in clinic per week were also associated with burnout. Burnout was less prevalent among those practicing <5 years (51.1 %) and 30+ years (33.7 %) as compared with optometrists practicing 5–9 years (57.8 %), 10–19 years (60.7 %), and 20–29 years (59.4 %). Those with no burnout averaged 3.8 days in clinic per week (SD=1.26); those with mild burnout averaged 4.1 days in clinic per week (SD=1.10); those with severe burnout averaged 4.2 days in clinic per week (SD=1.17). As depicted in Table 2, respondents with mild and moderate/severe burnout reported higher average volume of patients seen in half day of clinic. The 93.2 % of respondents who use EHR reported higher rates of burnout (54.9 %) compared to the 6.8 % who do not who EHR (37.2 % reporting any burnout, p = 0.0040). While employed optometrists had more burnout than owners, this difference did not reach statistical significance (p = 0.0568). Performing of minor surgical and laser procedures was not associated with burnout (data not shown). Figure 1 displays the mean Likert scale scores for the Mini Z burnout survey questions by the three categories of burnout. Apart from EHR proficiency (p = 0.6869), self-reported burnout was associated with each of the other Likert scale questions. Respondents who self-reported burnout experienced less job satisfaction (p ≤ 0.0001), control over workload (p ≤ 0.0001), time for documenting patient encounters (p ≤ 0.0001), alignment with leadership values (p ≤ 0.0001), and care team efficiency (p ≤ 0.0001). Self-reported burnout was also associated with a more hectic work atmosphere (p = 0.0489), stress because of their job (p ≤ 0.0001), and time spent on EHR at home (p ≤ 0.0001).
Prevalence of burnout by respondent characteristics.
| Burnout Category | ||||
|---|---|---|---|---|
| No Burnout(n = 667) | Mild Burnout(n = 472) | Moderate or Severe (n = 297) Burnout | P-value | |
| Gender:, n (row %) | <0.00011 | |||
| Male | 290 (59.4 %) | 122 (25.0 %) | 76 (15.6 %) | |
| Female | 362 (39.1 %) | 346 (37.4 %) | 217 (23.5 %) | |
| Other | 5 (62.5 %) | 1 (12.5 %) | 2 (25.0 %) | |
| Race and Ethnicity, n (row %) | 0.56901 | |||
| White | 465 (45.8 %) | 341 (33.6 %) | 209 (20.6 %) | |
| Black or African American | 17 (47.2 %) | 10 (27.8 %) | 9 (25.0 %) | |
| Latino/Hispanic | 32 (49.2 %) | 24 (36.9 %) | 9 (13.8 %) | |
| Asian | 113 (45.9 %) | 77 (31.3 %) | 56 (22.8 %) | |
| Other | 31 (56.4 %) | 12 (21.8 %) | 12 (21.8 %) | |
| Marital status:, n (row %) | 0.17601 | |||
| Single | 103 (43.5 %) | 80 (33.8 %) | 54 (22.8 %) | |
| Married | 521 (47.3 %) | 364 (33.1 %) | 216 (19.6 %) | |
| Divorced | 21 (40.4 %) | 12 (23.1 %) | 19 (36.5 %) | |
| Widowed | 4 (44.4 %) | 3 (33.3 %) | 2 (22.2 %) | |
| Civil Union | 7 (35.0 %) | 9 (45.0 %) | 4 (20.0 %) | |
| Does your spouse or partner also work in the healthcare profession:, n (row %) | 0.00351 | |||
| Yes | 212 (52.3 %) | 127 (31.4 %) | 66 (16.3 %) | |
| No | 371 (44.8 %) | 284 (34.3 %) | 174 (21.0 %) | |
| N/A | 77 (39.9 %) | 61 (31.6 %) | 55 (28.5 %) | |
| Do you have children:, n (row %) | <0.00011 | |||
| Yes | 457 (50.4 %) | 286 (31.5 %) | 164 (18.1 %) | |
| No | 202 (39.0 %) | 185 (35.7 %) | 131 (25.3 %) | |
| Average Annual Personal Compensation:, n (row %) | 0.00211 | |||
| < $200,000 | 508 (43.8 %) | 406 (35.0 %) | 246 (21.2 %) | |
| > $200,000 | 137 (55.5 %) | 62 (25.1 %) | 48 (19.4 %) | |
| Number of years in practice:, n (row %) | <0.00011 | |||
| < 5 years | 94 (49.0 %) | 70 (36.5 %) | 28 (14.6 %) | |
| 5–9 years | 114 (42.2 %) | 99 (36.7 %) | 57 (21.1 %) | |
| 10–19 years | 179 (39.3 %) | 176 (38.7 %) | 100 (22.0 %) | |
| 20–29 years | 100 (40.7 %) | 70 (28.5 %) | 76 (30.9 %) | |
| 30+ years | 178 (66.2 %) | 55 (20.4 %) | 36 (13.4 %) | |
| Census Bureau Region (Practice), n (row %) | 0.71491 | |||
| Northeast | 98 (49.0 %) | 68 (34.0 %) | 34 (17.0 %) | |
| Midwest | 175 (47.0 %) | 119 (32.0 %) | 78 (21.0 %) | |
| South | 185 (44.5 %) | 143 (34.4 %) | 88 (21.2 %) | |
| West | 181 (47.1 %) | 120 (31.3 %) | 83 (21.6 %) | |
| US Territories | 5 (71.4 %) | 2 (28.6 %) | 0 (0.0 %) | |
| On average, how many days do you spend in clinic each week: | <0.00012 | |||
| Mean (SD) | 3.8 (1.26) | 4.1 (1.10) | 4.2 (1.17) | |
| On average, how many patients do you see in a HALF day of clinic?, n (row %) | 0.00311 | |||
| 0–9 | 391 (51.8 %) | 224 (29.7 %) | 140 (18.5 %) | |
| 10–19 | 252 (41.0 %) | 225 (36.6 %) | 138 (22.4 %) | |
| 20–29 | 18 (35.3 %) | 19 (37.3 %) | 14 (27.5 %) | |
| 30+ | 2 (33.3 %) | 3 (50.0 %) | 1 (16.7 %) | |
| Do you use EHR for charting patient encounters?, n (row %) | 0.00401 | |||
| Yes | 585 (45.1 %) | 440 (33.9 %) | 273 (21.0 %) | |
| No | 59 (62.8 %) | 22 (23.4 %) | 13 (13.8 %) | |
| Have you completed residency training after optometry school?, n (row %) | 0.00471 | |||
| Primary Care Optometry | 65 (37.1 %) | 63 (36.0 %) | 47 (26.9 %) | |
| Pediatric Optometry | 45 (43.3 %) | 36 (34.6 %) | 23 (22.1 %) | |
| Cornea and Contact Lens | 53 (48.6 %) | 30 (27.5 %) | 26 (23.9 %) | |
| Ocular Disease | 156 (41.3 %) | 143 (37.8 %) | 79 (20.9 %) | |
| Low Vision / Vision Rehabilitation | 46 (62.2 %) | 20 (27.0 %) | 8 (10.8 %) | |
| Other Specialty | 24 (60.0 %) | 12 (30.0 %) | 4 (10.0 %) | |
| None | 274 (49.6 %) | 168 (30.4 %) | 110 (19.9 %) | |
| Do you use a medical scribe during clinic:, n (row %) | 0.46451 | |||
| Yes | 91 (50.6 %) | 56 (31.1 %) | 33 (18.3 %) | |
| No | 570 (45.8 %) | 413 (33.2 %) | 262 (21.0 %) | |
| Are you:, n (row %) | 0.05681 | |||
| Employed | 479 (44.5 %) | 366 (34.0 %) | 231 (21.5 %) | |
| Owner | 181 (51.9 %) | 102 (29.2 %) | 66 (18.9 %) | |
| What is your average commute time to work?, n (row %) | 0.00031 | |||
| < 15 min | 249 (54.2 %) | 126 (27.5 %) | 84 (18.3 %) | |
| 15–59 min | 383 (41.8 %) | 330 (36.0 %) | 203 (22.2 %) | |
| 60+ minutes | 29 (55.8 %) | 14 (26.9 %) | 9 (17.3 %) | |
 with lines. Questions 1,2, and 4–10 indicate the individual Mini Z survey questions which are graphed by the self-reported burnout question 3 categorized into no burnout, mild burnout, and moderate/severe burnout. Means and CLs are blue for respondents reporting no burnout, yellow for respondents reporting mild burnout, and red for moderate/severe burnout. *Significant differences across burnout categories, ANOVA F-test, p-value<0.05.")
Mean Likert scale of Mini Z Survey questions by category of burnout.
Figure 1 Legend. Mean Likert scale of potential drivers of burnout according to the presence of self-reported burnout category. Means are depicted with diamonds, and 95 % confidence limits (CL) with lines. Questions 1,2, and 4–10 indicate the individual Mini Z survey questions which are graphed by the self-reported burnout question 3 categorized into no burnout, mild burnout, and moderate/severe burnout. Means and CLs are blue for respondents reporting no burnout, yellow for respondents reporting mild burnout, and red for moderate/severe burnout. *Significant differences across burnout categories, ANOVA F-test, p-value<0.05.
In the United States, optometrists can pursue 1–2 years of post-doctoral residency training in specialized areas of optometry (Table 2). While these residencies provide advanced training, optometrists are not restricted to practicing within the specialty upon completion and may work in various settings. 61.5 % of respondents had completed a residency program. Among them, primary care optometrists reported the highest burnout rate at 62.9 %, while low vision and rehabilitation optometrists reported the lowest rate at 37.8 %.
Commute time and burnoutAverage commute time was associated with burnout, with short (<15 min) and long commutes (>60 min) having lower rates of burnout and moderate commutes (15–59 min) having higher rates of burnout (p = 0.0003).
Burnout by practice settingBurnout by practice setting is displayed in Figure 2. The prevalence of burnout by practice setting, from highest to lowest, is as follows: tele-optometry (100 %, n = 3), hospital-based (62.5 %, n = 104), integrated care (62.4 %, n = 162), department of ophthalmology (61.1 %, n = 77), commercial setting (54.9 %, n = 155), OD/MD private practice (54.6 %, n = 174), academic optometry (50.3 %, n = 183), small private practice (49.8 %), solo practice (49.6 %, n = 319), large private practice (48.7 %, n = 76), and other (38.7 %, n = 49).

Prevalence of mild and moderate/severe burnout by practice setting.
Figure 2 Legend. Prevalence of self-reported mild and moderate/severe burnout for respondents by practice setting. Blue bars represent rates of mild burnout and red bars represent rates of moderate/severe burnout. Percentages of each are provided by type of practice setting.
Results from the univariate multinomial logistic regression compared the odds of mild burnout and moderate/severe burnout to no burnout across respondent characteristics and are shown in the Supplemental Table. Most characteristics that were significant in Table 2 remained significant for both categories of burnout, including having children, days spent in clinic per week, patients seen in a half day of clinic, use of EHR, and commute of 15–59 min. Conversely, characteristics of having a spouse/partner in healthcare and most categories of number of years in practice were significantly associated with moderate/severe burnout, but not mild.
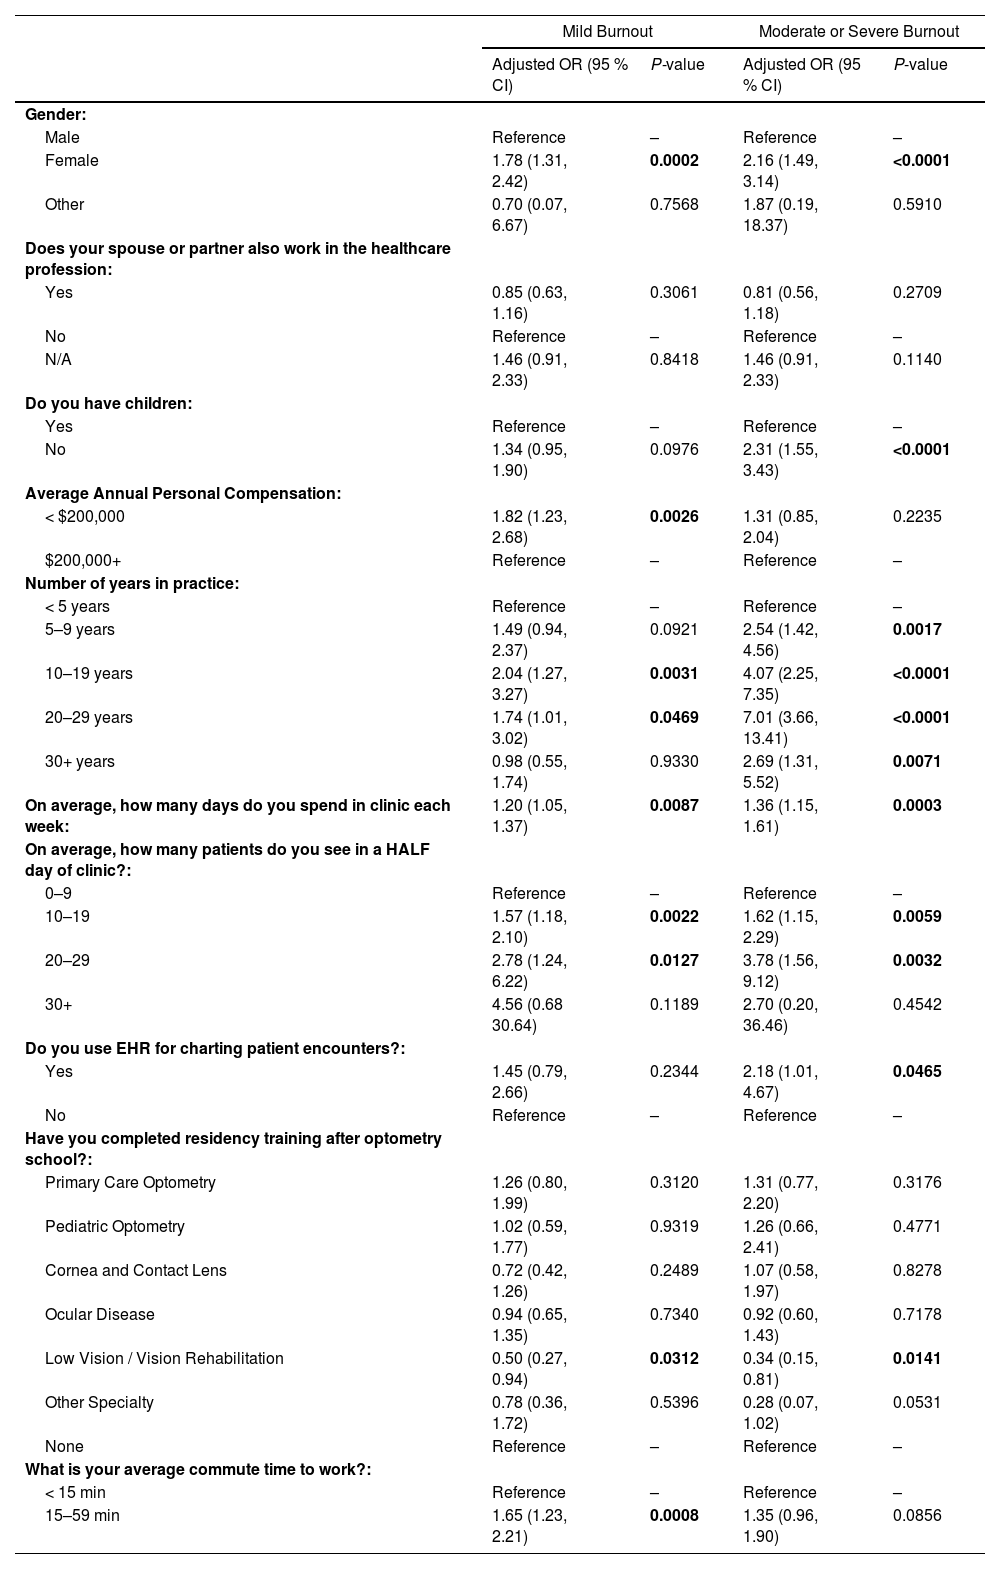
Table 3 demonstrates the multivariable analysis of associations with burnout. Females had 1.78 (95 %CI: 1.31, 2.42) higher odds of mild burnout and 2.16 (95 %CI: 1.49, 3.14) higher odds of moderate/severe burnout compared to males. Respondents without children had 2.31 (95 %CI: 1.55, 3.43) higher odds of moderate/severe burnout. Lower average annual compensation was significantly associated with mild (p = 0.0026), but not moderate/severe burnout (p = 0.2235). Most categories of number of years in practice were associated with both levels of burnout. Number of days spent in clinic was associated with higher odds of burnout, OR 1.20 (95 %CI: 1.05, 1.37) for mild and OR 1.36 (5 %CI: 1.15, 1.61) for moderate/severe. Average number of patients seen in a half day was also associated with both levels of burnout. EHR use was associated with moderate/severe burnout, OR 2.18 (95 %CI: 1.01, 4.67), but not mild. Most categories of type of residency training were no longer significant in the multivariate model, with the exception low vision/vision rehabilitation which had lower odds of both mild and moderate/severe burnout compared to no residency training. Average commute time of 15–59 min was only associated with mild burnout and not moderate/severe. Having a spouse in healthcare was no longer associated with either level of burnout in multivariable analysis. When moderate and severe burnout were analyzed as separate outcomes in the sensitivity analysis, we found the same significant associations for moderate burnout and demographic and clinical variables (with the exception of EHR use). Similarly, characteristics remained significant for the severe burnout category (with the exception of EHR use and residency type), with gender of borderline significance (p = 0.06). The loss of significance was likely due to the small sample size in the severe burnout group.”
Multivariable multinomial logistic regression of associations with burnout category.
OR = Odds ratio; CI = confidence interval.
Our study reveals concerning rates of burnout among optometrists in the United States, with 53.6 % self-reporting such symptoms. Among those reporting burnout, 61.4 % were classified as experiencing mild burnout, 30.4 % moderate, and 8.2 % severe. Self-reported burnout was associated with reduced job satisfaction, high stress, EHR use at home, insufficient time for documentation, lack of control over workload, a hectic work environment, reduced team efficiency, and professional values that do not align with leadership.
In our multivariable analysis, several risk factors for burnout were identified. Clinic related factors including lower average annual compensation, greater number of days spent in clinic, and EHR use had significantly greater odds of experiencing some level of burnout symptoms. Most of these are not altogether surprising as increasing workloads and EHR burdens along with falling compensation likely represent significant work and financial stressors that could contribute to burnout.16 While EHR systems aim to enhance documentation and streamline patient visits, they can also worsen provider burnout.16 Certain EHR platforms allow patients to directly message providers, which can increase the administrative workload for clinicians. Although this system benefits patients by improving communication, the time spent managing these messages adds to non-clinical tasks, contributing to stress and burnout for providers. EHR systems are believed to contribute to practitioner burnout and frustration by increasing administrative burdens, boosting inbox and patient message volumes, and reducing time for documentation.16 Clinicians who receive the most patient messages through EHRs are more likely to experience higher levels of burnout.17 Among residency-trained optometrists, those specializing in low vision and vision rehabilitation exhibited lower odds of experiencing mild and moderate to severe burnout compared to their peers without residency training. This could be due to the reduced patient volume for low vision providers, who see fewer patients and have longer appointment times, however this association remained after adjusting for patient volume. It is important to note that low vision and rehabilitation residency-trained optometrists represented the smallest category of residency-trained optometrists, with only 74 respondents. This small sample size may limit the strength and generalizability of this finding. Finally, factors outside the direct work environment also influence burnout. Respondents without children were more likely to experience burnout. Additionally, those with moderate commute times had higher burnout levels, whereas short (<15 min) or long (>60 min) commutes were associated with lower burnout levels. The relationship between having children and job burnout is not well understood and remains understudied. A systematic review on the topic found that while two studies report no association between having children and job burnout, another study found a positive correlation, and several others suggest that having children is protective against workplace burnout.18 It is important to note that these findings have only been reported in the field of nursing. One potential way in which having children might reduce job burnout is by allowing parents to disengage from work during time spent at home with their children. The protective association between short commutes and burnout may be attributed to individuals having more free time for desired activities and spending less time in transit. Historically, longer commute times have been associated with burnout, but recent theoretical research proposes that longer commutes could actually help alleviate stress by providing individuals with valuable personal time.19 Some evidence even indicates that the quality of the commute, rather than its duration, may be more important for worker well-being.20 Future studies with a more targeted approach are warranted to better understand the reasons behind each of these associations.
The prevalence of burnout was notably higher among female optometrists (60.9 %) compared to their male counterparts (40.6 %), with females also reporting more severe symptoms. Females had 1.78 higher odds of mild burnout and 2.16 higher odds of moderate/severe burnout compared to males after adjusting for other contributing factors. This association is not exclusive to optometry; female ophthalmologists are also nearly twice as likely to exhibit symptoms of burnout compared to males.8 This disparity has been observed not only in the United States but also in other countries, including India.21 Furthermore, this sex disparity is not confined to just eye care, as similar disparities have been documented across various medical specialties worldwide.22
One potential reason for this disparity could be differences in reporting between men and women. A meta-analysis on sex and burnout found that women are more likely to report emotional exhaustion, while men are more prone to report depersonalization.23 It is possible that the Mini Z survey used in our study is more effective at capturing emotional exhaustion than depersonalization. Additionally, evidence suggests that women face unique challenges in the workforce which may contribute to burnout, including gender biases, discrimination, sexual harassment, barriers to professional advancement, and deferred personal life decisions.22,24 There may also be different gender expectations in the doctor-patient relationship; for instance, female doctors typically spend more time with patients, engaging in empathetic listening and counseling, which can lead to decreased workflow and increased time pressure.25 An additional factor that may contribute to the higher burnout rates among female optometrists is the unequal distribution of family responsibilities.23 While gender roles have evolved, women often bear a greater share of caregiving and household duties, which can add to the stress and workload they experience.23 This additional burden, alongside professional demands, may contribute significantly to the observed gender disparity in burnout.23
This issue is particularly pressing in optometry, as the number of female optometrists continues to rise, with female optometry students having outnumbered their male counterparts for over a decade.26,27 A 2017 survey indicated that female optometrists are less likely to be self-employed compared to their male peers.27 Our study found that self-employed optometrists experience less burnout than employed ones, although this difference was not statistically significant. The reasons behind the discrepancies between men and women are multifaceted and complex, but recognizing these differences is a crucial first step in identifying and addressing the problem. Notably, other demographic factors such as race/ethnicity, region of the United States, city size, and marital status were not associated with self-reported burnout.
Prior studies of burnout among eye care specialists have revealed similar findings to the present study. In a similar study performed at the University of Colorado in 2020, burnout was examined among ophthalmologists using the Mini Z survey. Interestingly, although many risk factors were similar, the prevalence of burnout among optometrists in our study (53.6 %) was substantially higher than it was among ophthalmologists (37.8 %), although the ophthalmology survey was conducted immediately prior to COVID which may have impacted their rates.8 One potential difference explaining the disparity is that ophthalmologists split their time between clinic and surgery, while optometrists are primarily in the clinic, often focusing on more repetitive tasks such as refractive care, which may contribute to higher burnout levels. A 2021 study out of Australian optometrists found a similar rate of burnout (56.1 %) to our present study.12
The field of optometry presents specific challenges that may contribute to burnout. Clinical optometrists work in a variety of settings, including private practice, solo practice, hospitals, integrated health care systems, commercial practices, tele-optometry, departments of ophthalmology, and academic optometric institutions. In our study, burnout was linked to practice setting, with private practices and optometry schools exhibiting lower rates of burnout. Additionally, optometrists engage in various job types which influence burnout, including vision correction, specialty contact lenses, surgical co-management, dry eye treatment, glaucoma management, myopia control, pediatrics, binocular vision assessment, and vision therapy. For example, residency-trained low vision providers reported lower levels of burnout, whereas residency-trained primary care optometrists experienced higher levels. These diverse settings and job types may influence the burnout experience, as different environments and responsibilities can introduce unique stressors. Although the sample size was small (n = 3), optometrists practicing in a tele-optometry setting reported significant burnout. This is particularly interesting, as some optometrists may seek a work-from-home lifestyle to reduce burnout, which aligns with broader trends in job satisfaction. Worth mentioning, performing minor surgical and laser procedures was not linked to burnout. Furthermore, data from a 2012–2017 nationwide optometrists survey indicated that the average number of weeks worked per year by optometrists is increasing, along with the number of patient visits per week, particularly among female optometrists.27
This study was exploratory to assess prevalence of burnout across various potential characteristics. There are several limitations to this study. Although a large number of respondents participated, selection bias may be present due to the low response rate and the specific group of individuals to whom the survey was distributed. Another limitation is the potential for selection bias from the sampling method, along with the possibility of social desirability bias due to self-reported data and the lack of longitudinal data to assess causality. According to the U.S. Bureau of Labor Statistics, the estimated number of licensed optometrists in the United States is 41,390 as of May 2023.28 The survey was primarily distributed through the American Academy of Optometry, which represented 6266 optometrists at the time of distribution—approximately 15 % of the national total. This likely includes a disproportionate number of residency-trained optometrists and those in academia, while underrepresenting those in commercial and private practice settings. To address this, the survey was also distributed through other online platforms, which have more participants from corporate optometry and private practice settings. A list of additional platforms used for survey distribution can be found in the methods section. The survey may not have fully captured the burnout rates of optometrists working in industry or primarily in research roles, as the questions were primarily directed toward those in clinical positions. Age was not specifically asked in the study, although we can indirectly infer age based on the answers from “number of years in practice”. When compared to the 2017 National Optometry Workforce Study, our study included a higher proportion of women (65 % vs. 45 %).56 The racial and ethnic demographics of our sample were similar to those in the 2017 survey, with 72 % White participants compared to 81 % in the national study. Additionally, data on practice setting and years in practice were not collected in the 2017 survey.27 The Mini Z survey was selected in this study due to its wide-spread use in healthcare settings, to quantify burnout, and identify potential drivers of burnout. While the Mini Z has been used in various healthcare settings, it has not specifically been validated for the profession of optometry. The primary limitation of the Mini Z survey is its brevity, which may limit depth of analysis. Additionally, because the survey was distributed through multiple platforms, including email listservs and social media, we were unable to determine an exact response rate.
Future analyses will specifically examine gender differences in job stress and job satisfaction. Given the significant disparity between men and women, it is crucial to explore strategies for reducing burnout among women and to identify risk factors specific to them that may contribute to this disparity. Our findings are consistent with existing literature on burnout in healthcare; however, they suggest that optometrists experience higher rates of burnout than ophthalmologists, despite their similar work environments. This discrepancy implies that the optometric profession faces unique challenges that warrant further investigation, particularly regarding diverse practice settings and patient loads. Addressing burnout is a complex and multifaceted issue that goes beyond the scope of this manuscript. However, lifestyle modifications have shown promise in reducing burnout. Such modifications include regular exercise, prioritizing sleep, routine interaction with friends and family, strengthening social connections with colleagues, practicing gratitude, engaging in random acts of kindness, and improving workplace civility may be helpful in reducing burnout.7,10,29,30 Additional research is needed to develop strategies that foster supportive work environments, promote work-life balance, and enhance job satisfaction among optometrists. Addressing the disparities in burnout rates between genders will be essential for cultivating a healthier workforce. Ongoing research should focus on these issues to provide deeper insights into the underlying causes of burnout and effective interventions to mitigate its impact within optometry.
ConclusionIn conclusion, this study reveals a concerning prevalence of burnout among optometrists in the United States, with 53.6 % of respondents reporting symptoms of burnout. Female optometrists are disproportionately affected, with an alarming 60.9 % experiencing some degree of burnout compared to 40.6 % of their male counterparts. Protective factors against burnout included being male, having children, not using EHR systems, short commutes, an annual personal compensation exceeding 200,000 USD, having a spouse or partner in healthcare, and working in private practice or academic optometry settings. Conversely, risk factors included being female, an increased number of clinic days per week, higher patient volume, use of EHR systems, being mid-career, and working in settings such as tele-optometry, hospitals, integrated care systems, departments of ophthalmology, and commercial practices.
FundingThis investigation received funding from the Department of Ophthalmology at the University of Colorado.
Conflict of interestThe authors do not have any financial disclosures or conflicts of interest.
Authors contributionAll authors contributed to the design of the study and the survey. EA, LS, and KA obtained IRB approval. EA and JP built the survey. EA and JP performed statistical analysis. KA, LS, JP, and NG helped with survey distribution. KA drafted the manuscript and oversaw the investigation. All authors were involved in manuscript revisions.


