


To develop and validate a custom deep learning-based automated segmentation for choroidal thickness of optical coherence tomography (OCT) scans.
MethodsAn in-house automated algorithm was trained on a Deeplabv3+ network, based on ResNet50, using a training set of 10,798 manually segmented OCT scans (accuracy 99.25% and loss 0.0229). A test set of 130 unique scans was segmented using manual and in-house automated methods. For manual segmentation, the choroid-sclera border was delineated by the user. For in-house automated segmentation, all borders were automatically detected by the program and manually inspected. Bland-Altman analysis, intraclass correlation coefficient (ICC), and Deming regression compared the central 1-mm diameter and 3-mm and 6-mm annuli for the two methods. The in-house method was also compared with an open-source algorithm for the test set of 130 scans.
ResultsMean choroidal thicknesses obtained with manual and in-house automated methods were not significantly different for the three regions (P > 0.05 for all). The fixed bias between methods ranged from -2.41 to 3.49 µm. Proportional bias ranged from -0.04 to -0.12 (P < 0.05 for all). The two methods demonstrated excellent agreement across regions (ICC: 0.96 to 0.98, P < 0.001 for all). The open-source automated method consistently resulted in thinner choroidal thickness compared to manual and in-house automated methods.
ConclusionsCustom in-house deep learning automated choroid segmentation demonstrated excellent agreement and strong positive linear relationship with manual segmentation. The automated approach holds distinct advantages for estimating choroidal thickness, being more objective and efficient than the manual approach.
Myopia prevalence is increasing worldwide, prompting extensive research efforts to understand underlying mechanisms and develop effective tools to control its progression.1,2 Recent studies have highlighted the potential significance of the choroid, the vascular tissue providing blood supply to the outer retina and sclera.3 The choroid is located between Bruch’s membrane and the sclera, extending from the ora serrata anteriorly to the optic nerve posteriorly. The outermost layer of the choroid is the suprachoroidal lamina; deep to the suprachoroidal lamina are the large diameter vessels (Haller’s layer), the medium-diameter vessels (Sattler’s layer), the choriocapillaris, and a basement membrane, which forms the outermost layer of Bruch’s membrane.4 Besides its vascular functions, the choroid may also have a role in regulating eye growth. The choroid thickens during emmetropization; however, the choroid tends to thin with the development and progression of myopia.5,6
The choroid has been shown to dynamically modulate its thickness in response to various environmental cues in both humans and animal models.7–10 For example, when the image plane is moved posterior to the retina through imposed negative defocus, the choroid responds within minutes by reducing its thickness to position the retina more posteriorly to align the photoreceptors with the plane of focus.9,11 Conversely, the choroid has been shown to thicken in response to imposed positive defocus.10 Although large compensatory changes in choroidal thickness in response to imposed defocus are reported in chicks,7 the changes are relatively small in humans and other animal models,4 such as guinea pigs,8 marmosets,12 and rhesus monkeys.13 Nevertheless, the association has prompted extensive research into the role of the choroid in human myopia development, emphasizing the need to accurately and efficiently monitor dynamic thickness changes over time.3
Optical coherence tomography (OCT) is a non-contact imaging technique that generates high-resolution cross-sectional images of the eye.14 Because OCT provides real time in vivo images without impacting the tissue under examination, it has emerged as a standard clinical and research tool for imaging the posterior eye. Since its introduction in 1991,15 continuous improvements in technology, incorporating features such as eye tracking, averaging, and enhanced depth imaging (EDI), have significantly improved the imaging capabilities of OCT.16,17 These improvements have particularly facilitated the acquisition of high-quality images of deeper ocular layers, such as the choroid.16–19 Commercial OCT instruments provide qualitative and quantitative analysis of the retina. However, analysis of the choroid with appropriate consideration of magnification effects is not included in most commercial instruments’ software. Unlike the retina, the choroid lacks distinct, ordered layers and does not exhibit clear reflective properties.16,17 Hence, accurately identifying the posterior choroid boundary and determining thickness poses a challenge. For some OCT instruments, sub-foveal choroidal thickness can be estimated manually using the software’s caliper tool by drawing a line from the retinal pigment epithelium to the choroid-sclera border, beneath the fovea.16 Due to limitations inherent in this manual approach, alternative methods and tools have been developed and tested using exported OCT scans. These tools employ different strategies to automatically detect the choroid boundaries and consequently derive its thickness. The most common approach for choroid segmentation involves manual analysis, where an observer identifies and delineates the choroid-sclera border.20,21 This process is time consuming and subject to observer bias and variability.
Development of programs that can automatically detect boundaries of interest are being extensively explored. Among several automated techniques, a graph-search based approach has been most widely adopted.22–25 More recently, with advances in computing, software programs based on machine learning, deep learning techniques are being adopted.23 For example, Sui et al.26 presented a multi-scale convolutional neural network (CNN) in which an optimal graph-edge weight could be learned directly from raw pixels. Similarly, Chen et al.27 utilized a CNN based on SegNet design, consisting of an encoder-decoder network and pixel-wise classification layer to generate edge probability maps for the interior Bruch’s membrane and the choroid/sclera border. A technique known as “seam carving” was then used to delineate the two boundaries in the image by finding a path of connected pixels across its width.
Kugelman et al.28 investigated the performance of a range of deep learning methods, including both patch-based and semantic approaches, for OCT choroid boundary segmentation. Their findings revealed superior performance of deep learning methods compared to a standard image analysis method used as a baseline. More recently, Burke et al.29 evaluated an automatic deep learning algorithm, DeepGPET, and found excellent agreement with a clinically validated semi-automatic method, Gaussian process Edge Tracing (GPET). DeepGPET also achieved significantly reduced mean processing time than GPET. The same research group later developed Choroidalyzer, an open-source tool designed for comprehensive analysis of the choroid, including measurements of thickness, area, and vascular index.30
In this study, we aimed to validate a custom CNN based MATLAB program, trained on a Deeplabv3+ network, based on ResNet50 and designed to automate choroid segmentation of OCT scans by identifying the inner and outer boundaries of the choroid. Choroidal thicknesses obtained from this in-house automated program were compared to those from a traditional manual approach, and repeatability was assessed. Additionally, the performance of the in-house automated method was compared with the open-source deep-learning model, the Choroidalyzer.30
Material and methodsAll training and test scans were collected with a Spectralis OCT (Spectralis; Heidelberg Engineering, Heidelberg, Germany). The algorithm for the in-house automated segmentation program utilized a convolutional neural network (CNN) trained on a Deeplabv3+ network, based on ResNet50 (Fig. 1). The CNN was trained using 10,798 manually segmented B-scans to an accuracy of 99.25% and loss of 0.022931 and has been utilized in previously published papers.32,33 To assess the model's performance, we performed 10K-fold cross-validation, ensuring that each subset of data was used for both training and validation. The model achieved a mean Dice coefficient of 0.9935 ± 0.0001 and an intersection over Union (IoU) score of 0.99 across 10K-fold cross-validation, demonstrating strong agreement with manual segmentation. To test the automated segmentation program, OCT scans that had been manually segmented were run through the in-house automated segmentation program and thicknesses were compared. The test set included 136 unique OCT scans of 136 participants from seven different studies, randomly selected to compare with the automated program. These scans had been previously manually segmented and were not included in the CNN training set. Six scans were excluded either due to poor scan quality, reduced contrast, indistinct choroid boundaries, or a combination of these factors. Thus, 130 OCT scans were included for analysis. Each of the previous studies was approved by the institutional review board at the University of Houston. All OCT imaging had been performed under similar conditions. The OCT scan protocol included two high-resolution, six-line 30⁰ radial scans, centered on the fovea, and were captured using enhanced depth imaging (EDI) mode (Fig. 2). For all previous studies in our lab from which the test scans were derived, two consecutive OCT scans at each time point were collected. These scan pairs were used to test repeatability of each segmentation method, the traditional manual method and the in-house automated method. To avoid selection bias, only one scan per participant, either from the right or left eye, was included for comparing manual and automated segmentation. The selected scans were exported from the OCT instrument as .vol files, each of which underwent a separate manual and automated segmentation using custom programs written in MATLAB (MathWorks, Natick, MA, USA). For both manual and automatic programs, transverse scaling of each OCT scan was calculated and applied to account for ocular magnification.20 The scaling factor was determined based on each participant’s axial length and corneal curvature, which was input in MATLAB during the analysis.

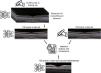
Protocol. Manually segmented scans (N = 10,798) were input as the training set to develop the convolutional neural network. A test set (N = 130) was then subjected to both manual and in-house automated segmentation, as well as an open-source automatic segmentation program, the Choroidalyzer, and compared to the manual and in-house methods.

Scan and segmentation protocol. A) High-resolution, six-line 30⁰ radial scans, centered on the fovea, were captured using enhanced depth imaging mode; B) Scans were segmented for the inner limiting membrane (yellow), Bruch’s membrane (blue), and choroid-sclera border (red) and analyzed for the central 1 mm diameter and 3 mm and 6 mm annuli; C) Choroidal thickness maps were generated post-segmentation.
For manual segmentation, a custom MATLAB program was utilized, as described previously.20,34 MATLAB read the OCT scans as a .vol file. The user manually entered the axial length and corneal curvature for that participant. For each of the six radial B-scans, the user first confirmed and, when required, corrected Bruch’s membrane border segmentation provided by the OCT instrument, and then manually delineated the choroid-sclera border for each set of six radial B-scans.
For automated segmentation via the in-house method, upon loading an OCT .vol file into MATLAB, axial length and corneal curvature were entered for the participant, and the CNN identified and automatically delineated Bruch’s membrane and the choroid-sclera border for each of the six radial B-scans. To test repeatability of the automated segmentation method, the two consecutive OCT scans at each time point for each participant were analyzed separately with the automated segmentation program. All scans were carefully examined for quality and consistency of the choroid-sclera delineation across scan pairs and segmentations were manually corrected when required. Since the in-house method requires occasional manual corrections, we describe it as "semi-automated.”
Following segmentation by either the manual or in-house automated methods, the center of the fovea (region of minimal thickness) was manually selected on the retinal thickness map. Then, the average choroidal thickness within three regions, the central 1 mm diameter and 3 mm and 6 mm annuli, were extracted. For each annulus, thickness was also determined for each quadrant, temporal, superior, nasal and inferior. The choroidal thicknesses obtained from the manual and automated methods were compared. For a subset of the dataset, we also recorded the time taken to perform both manual and automated segmentation. This comparison allowed an assessment of efficiency of the in-house automated method in terms of processing time.
To further evaluate its performance, the in-house automated segmentation method was compared with an open-source deep-learning based model, the Choroidalyzer, which utilizes a U-Net architecture. The current dataset, including OCT scans from 130 participants, was independently segmented using the two automated methods. For segmentation with the Choroidalyzer, the OCT scans were exported as XML files and cropped and padded to 768 × 768 pixels to match the analysis requirements. Following segmentation, the average sub-foveal choroidal thickness within the central 1-mm diameter and the 3-mm annulus was obtained, similar as described earlier. Transverse scaling was applied to account for ocular magnification. Choroidal thickness obtained from the Choroidalyzer and the in-house automated method were compared to those from the manual method.
Data analysisStatistical analyses were performed using MATLAB and R version 4.3.2 (R Core Team 2023). Bland-Altman analysis and intraclass correlation coefficient (ICC) were used to compare the choroidal thicknesses obtained from the manual and automated segmentation methods in the same regions for each OCT scan. ICC was calculated using the two-way mixed effects, absolute agreement model to evaluate the magnitude of agreement between methods. The presence of fixed bias (mean difference between the two methods) was tested using one-sample t-test. Proportional bias was evaluated using a linear regression model. Additionally, Deming regression was used to evaluate systematic differences between the two methods.35 Repeated measures ANOVA with post-hoc Bonferroni corrected pairwise comparisons were used to assess differences in choroidal thickness across regions and quadrants as derived from the in-house automated method.
ResultsFor the 130 test OCT scans, participants' mean (± standard deviation) age was 23.5 ± 9.6 years (range 21–46 years). Mean spherical equivalent refraction and axial length were −1.96 ± 1.04 D (range −7.50 to +6.50 D) and 24.46 ± 8.66 mm (range 19.90 to 27.62 mm), respectively. For each 6-line radial scan .vol file, the in-house automated segmentation took <60 s to process. If manual correction was required, the analysis tool an additional 3–5 min. On the other hand, the traditional manual segmentation took approximately 30 min.
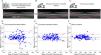
Repeatability of the in-house automated methodRepeatability of the in-house automated segmentation method was assessed by performing automated segmentation on two repeat scans for each participant (Fig. 3). Eight of the 130 OCT scans included in the test group were excluded as repeat scans were either missing or corrupted. Consequently, 122 scan pairs were evaluated for repeatability. Nineteen of the 122 pairs had one (N = 6) or both (N = 13) scans (32 scans out of 244 in total) of poor quality, reduced contrast, indistinct choroid boundaries, or presence of shadows that impaired automated segmentation in some way and exhibited a difference of >20 µm between scans. Examples include pairs where segmentation for one scan included an indistinct vessel within the choroidal boundary while the other scan excluded it; one scan showed undulations in the segmentation of choroid-sclera boundary while the other scan presented a smoother choroidal boundary; or segmentation for one scan tightly hugged the major vessels while the other scan included a portion of the suprachoroidal lamina along with the major vessels. These scans required manual correction to ensure a consistent segmentation criterion was applied to both scan pairs. After manual correction, the pairs showed excellent agreement of choroidal thickness, with the ICC > 0.99 (P < 0.001, Fig. 3C). The mean difference (± standard deviation) in choroidal thickness between the two scans of each pair was 0.87 ± 7.58 µm (95% CI from −2.23 to 0.49 µm) for the 1 mm diameter centered at the fovea. For additional comparison, we also evaluated the repeatability of the manual method across the same scan pairs (N = 122) (Fig. 3D). These scan pairs exhibited excellent agreement with the ICC > 0.99 (P < 0.001) and showed slightly smaller limits of agreement compared to the corrected scan pairs of the automated segmentation method.

A) Automated segmentation was inspected for errors in identification of the choroid sclera border (white arrowheads); in this example, segmentation tightly hugged the major vessels while the segmentation of the other scan in the pair (not shown) included a portion of the suprachoroidal lamina along with the major vessels; B) manual correction of the automated segmentation; C) fully manual segmentation of the same scan; Bland-Altman analysis of repeatability of the choroidal thickness of the 1 mm diameter centered at the fovea obtained from two repeat scans (N = 122 pairs) for D) fully automated segmentation, E) after manual correction, when required, and F) the fully manual method. Solid blue lines represent the mean difference between the two scans; dashed pink lines represent the 95% limits of agreement, and black lines represent the inner and outer 95% confidence limits for the limits of agreement.
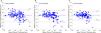
Bland-Altman analysis for mean choroidal thicknesses using the manual and in-house automated methods for the central 1 mm diameter and 3 mm and 6 mm annuli centered at the fovea are shown in Fig. 4. The mean differences (± standard deviation) between the two methods were 1.75 ± 18.52 µm (95% CI from −1.46 to 4.97 µm), −0.07 ± 17.45 µm (95% CI from −3.10 to 2.96 µm), and 1.69 ± 13.61 µm (95% CI from −0.67 to 4.05 µm) for 1 mm diameter and 3 mm and 6 mm annuli, respectively (Table 1).

Bland-Altman analysis of choroidal thicknesses derived from the manual and in-house automated methods for the A) 1 mm diameter, B) 3 mm annulus, and C) 6 mm annulus centered at the fovea. Solid blue lines represent the mean difference between the two methods; dashed pink lines represent the 95% limits of agreement, and black lines represent the inner and outer 95% confidence limits for the limits of agreement.
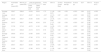
Agreement between the manual and in-house automated methods comparing the mean choroidal thickness (± standard error) for the central 1 mm diameter, 3 mm and 6 mm annuli, and their respective quadrants, centered at the fovea (N = 130).
| Region | Automated µm (mean±SE) | Manual µm (mean±SE) | Limits of agreement | Fixed bias | 95% CI | P-value (Fixed-Bias) | Proportional bias (β) | P-value (β) | ICCa | 95% CI | P-value (ICC) | |
|---|---|---|---|---|---|---|---|---|---|---|---|---|
| Lower bound LOA | Upper bound LOA | |||||||||||
| Average 1mm | 339±7 | 338±8 | −34.54 | 38.04 | 1.75 | [−1.46, 4.97] | 0.29 | −0.09 | <0.001 | 0.98 | [0.97, 0.98] | <0.001 |
| Average 3mm | 331±7 | 331±7 | −34.27 | 34.14 | −0.07 | [−3.10, 2.96] | 0.97 | −0.09 | <0.001 | 0.98 | [0.97, 0.98] | <0.001 |
| Temporal 3mm | 330±6 | 333±7 | −40.46 | 35.65 | −2.41 | [−5.78, 0.96] | 0.16 | −0.12 | <0.001 | 0.97 | [0.96, 0.98] | <0.001 |
| Superior 3mm | 347±7 | 345±7 | −36.45 | 40.44 | 2.00 | [−1.41, 5.40] | 0.25 | −0.09 | <0.001 | 0.97 | [0.96, 0.98] | <0.001 |
| Nasal 3mm | 317±8 | 317±8 | −42.72 | 41.45 | −0.64 | [−4.36, 3.09] | 0.74 | −0.08 | <0.001 | 0.97 | [0.96, 0.98] | <0.001 |
| Inferior 3mm | 331±7 | 330±8 | −34.19 | 35.74 | 0.78 | [−2.32, 3.87] | 0.62 | −0.08 | <0.001 | 0.98 | [0.97, 0.98] | <0.001 |
| Average 6mm | 308±6 | 307±6 | −24.98 | 28.36 | 1.69 | [−0.67, 4.05] | 0.16 | −0.07 | <0.001 | 0.98 | [0.97, 0.99] | <0.001 |
| Temporal 6mm | 315±6 | 315±6 | −37.48 | 37.72 | 0.12 | [−3.21, 3.45] | 0.95 | −0.12 | <0.001 | 0.96 | [0.94, 0.97] | <0.001 |
| Superior 6mm | 342±7 | 338±7 | −29.18 | 36.16 | 3.49 | [0.60, 6.38] | 0.02 | −0.06 | 0.002 | 0.98 | [0.97, 0.98] | <0.001 |
| Nasal 6mm | 263±7 | 262±7 | −26.83 | 30.09 | 1.63 | [−0.89, 4.15] | 0.20 | −0.04 | 0.007 | 0.98 | [0.98, 0.99] | <0.001 |
| Inferior 6mm | 313±6 | 311±7 | −27.68 | 30.73 | 1.53 | [−1.06, 4.11] | 0.25 | −0.07 | <0.001 | 0.98 | [0.97, 0.99] | <0.001 |
LOA, limits of agreement; CI, confidence interval; ICC, intraclass correlation coefficient; β, slope coefficient.
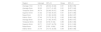
Indices of agreement and correlation between the manual and in-house automated methods obtained with Bland-Altman analysis and intraclass correlation coefficient (ICC) across different regions and quadrants, centered at the fovea, are shown in Table 1, and output of Deming regression analysis is shown in Table 2. The two methods demonstrated an excellent agreement (ICC: 0.96 to 0.98, P < 0.001 for all) across all analyzed regions and quadrants. The fixed bias between the two methods was consistently small across all regions, ranging from −2.41 to 3.49 µm, with p-values > 0.05 for all comparisons, except the superior quadrant of 6 mm annulus (P = 0.02). A small proportional bias was observed with values ranging from −0.04 to −0.12 (P < 0.05), across all regions (Table 1). Deming regression demonstrated an excellent linear relationship between the two methods across all examined regions with slopes ranging between 0.88 and 0.96 and intercept ranging between 12.67 to 36.74.
Deming regression analysis for the manual and in-house automated methods comparing the mean choroidal thickness across the central 1 mm diameter and 3 mm and 6 mm annuli, and by quadrant, centered at the fovea (N = 130).
CI, confidence interval.
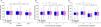
Choroidal thicknesses by region and quadrant are shown in Fig. 5. Repeated measures ANOVAs showed that the mean choroidal thicknesses derived from the manual and in-house automated methods were not significantly different (F(1129) = 0.69, P = 0.41). For both methods, choroidal thickness varied by region (F(2258) = 136.85, P < 0.001). Post-hoc pairwise comparisons showed that choroidal thickness in the central 1 mm diameter was greater than the 3 mm and 6 mm annuli, and choroidal thickness in the 3 mm annulus was greater than the 6 mm annulus (P < 0.001 for all). Within both the 3-mm and 6-mm annuli, choroidal thickness was greatest in the superior quadrant, followed by the temporal and inferior quadrants, and least in the nasal quadrant (P < 0.001 for all).

Distributions of choroidal thickness computed using the manual (pink boxes) and in-house automated (blue boxes) methods for (A) the 1 mm diameter and 3 mm and 6 mm annuli, and B-C) temporal (T), superior (S), nasal (N), and inferior (I) quadrants within the B) 3 mm annulus and C) 6 mm annulus centered at the fovea. *P < 0.001 for differences between regions (A) and quadrants (B & C), central line of each bar represents the median, X represents the mean.
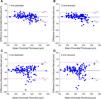
Fig. 6 presents the Bland-Altman analysis comparing the in-house automated method and the open-source automated method, the Choroidalyzer, to manual segmentation. The mean difference (± standard deviation) between the manual and the in-house automated methods was 1.75 ± 18.52 µm for the 1-mm region and −0.07 ± 17.45 µm for the 3-mm region. In contrast, the Choroidalyzer consistently underestimated choroidal thickness in both regions compared to the manual method, with a mean difference of −39.97 ± 30.70 µm for the 1-mm region and −37.48 ± 32.72 µm for the 3-mm region. Note that the 6 mm annulus could not be analyzed using the Choroidalyzer due to restrictions in the image format required by the code. Visual inspection of the segmentations from the Choroidalyzer showed that the choroid-sclera delineation was positioned closer to the vessel lumen rather than the choroid-sclera border (Fig. 7).

Bland-Altman plots comparing the performance of the manual and two automated methods, in-house and open-source, for choroidal thickness. Agreement between the manual and in-house automated methods for the A) 1-mm and B) 3-mm diameters, and agreement between the manual and open-source automated Choroidalyzer methods for the C) 1-mm diameter and D) 3-mm annulus. Solid blue line represents the mean difference between two methods; dashed blue lines represent the 95% limits of agreement.

The primary objective of the current study was to assess the consistency of a custom in-house developed deep learning-based choroid segmentation program compared to manual choroid segmentation for choroidal thickness. Additionally, an open-source automated choroid segmentation was compared to the in-house automated and manual methods. Comparisons encompassed different concentric regions, including the 1 mm central diameter and 3 mm and 6 mm annuli, as well as for the temporal, superior, nasal, and inferior quadrants within the 3 mm and 6 mm annuli. For a small percentage of scans (13%, 32 out of 244 scans), some manual correction was required following automatic segmentation to ensure accuracy; manual inspection and correction are common practices with published automated segmentation programs.22,36,37 Results showed small mean differences between the traditional manual and in-house automated methods, measuring <2 µm and 4 µm when comparing different regions and quadrants, respectively. The in-house automated program exhibited excellent agreement and strong positive linear relationship with the outcomes of the manual method across all the examined regions. Furthermore, the results obtained from the in-house automated segmentation exhibited high repeatability across the two consecutive scan pairs, demonstrating consistency within the same individuals. The advantage of the automated approach lies in its objective nature and significantly reduced time required for the segmentation process as compared to manual methods. This ensures precision in estimating choroidal thickness, reduces bias, and enhances efficiency, making it a promising and advantageous tool for future use. The in-house automated segmentation program was more similar to manual segmentation than the open-source automated Choroidalyzer program. This appears to be due to different network architecture and criteria used in training scans between the two automated methods; the Choroidalyzer consistently segmented closer to the vessel lumen of Haller’s layer, rather than the choroid sclera border. Additionally, the Choroidalyzer required cropping the OCT image, resulting in loss of data in the 6 mm annulus. While it may be possible to resize the OCT image, rather than crop, we chose not to deviate from the analytical approach outlined in the Choroidalyzer.30 Therefore, the in-house automated method is preferred and will be employed in further studies in our lab.
Findings show that caution is warranted when using automated methods. The discrepancies observed between the two automated methods highlight how variations in network architecture and training data can influence segmentation results. Thus, validation of outputs against a trusted standard, such as manual segmentation, is essential. Furthermore, visual inspection of segmentation boundaries is strongly recommended to ensure they align with anatomical expectations and maintain consistent performance across diverse datasets and conditions.
It has been suggested that in eyes with a thicker choroid, the clarity of the choroid-sclera border might be compromised due to signal loss and artifacts induced by interstitial tissue between the vessels.38 Consequently, thicker choroids may reduce the visualization of the choroid-sclera interface, resulting in extended processing times and increased variability with manual segmentation. The increased variability in thicker choroids has been observed in studies that have utilized different OCT instruments to measure choroidal thickness.38,39 Zhang et al.39 evaluated the reproducibility of graph-based automated segmentation using OCT scans derived from swept-source OCT (SS-OCT) and observed a better relationship with repeated scans compared to a manual method (R2 of 0.97 for automated and 0.93 for manual). Additionally, for choroidal thicknesses beyond 300 μm, the data points showed a larger spread with the manual method, which highlights the measurement variability of manual segmentation even for repeated scans. In contrast, Cahyo et al.40 evaluated performance of different deep-learning based approaches by comparing segmentation volume and similarity of thickness maps with respect to ground truth (manual) segmentation and observed better performance in segmenting even thicker choroids (301–400 μm) across all deep-learning-based approaches. This observation suggests that the identification of the choroid-sclera border may be influenced by different factors when comparing the human eye to a trained convolutional neural network (CNN). CNNs exhibit greater consistency, particularly in eyes with thicker choroids, where visualizing the interface poses a challenge. In our dataset, increased variation between methods beyond the mean choroidal thickness of approximately 350 µm was observed. This could be attributed to variability in manual segmentation for OCT scans with a thicker choroid, potentially leading to the small negative proportional bias observed in the study.
Numerous studies have documented choroidal thickness in healthy eyes across various age and refractive groups.32 Due to differences in study design and participant characteristics, direct comparisons of choroidal thickness between studies is challenging. Additionally, choroidal thickness is known to exhibit diurnal variations20,41 and can modulate in response to various physiological changes and visual cues.3 Nevertheless, the average choroidal thickness computed in this study are largely comparable to those reported in previously published studies, with the majority of data falling within the range of 200 and 450 µm.42–47 The superior quadrant was found to be the thickest and the nasal quadrant was the thinnest for both 3-mm and 6-mm annular regions. These observations are consistent with findings from comparable studies that examined choroidal thickness across different geographical regions and eccentricities relative to the fovea42,43,45–47 and is attributed to the anatomical characteristics, blood supply, and metabolic demands across different regions within the eye.3 The key finding crucial to the current study is that the choroidal thickness determined by an in-house automated segmentation method closely matched that of the traditional manual method across all 11 tested regions (3 concentric regions and 8 quadrants). This indicates that the proposed automated method offers robust detection of choroid boundaries and accurately computes choroidal thickness across various regions of the retina.
Upon evaluating the performance of the in-house automated method against an open-source automated method, the Choroidalyzer, results indicated better agreement between the in-house automated method and manual segmentation. The Choroidalyzer consistently produced a tighter segmentation of the choroid, leading to underestimation of choroidal thickness compared to the manual method. This highlights that the discrepancies between the automated methods can arise from challenges in defining posterior choroidal boundaries, a region which lacks distinct reflective properties, driven by differences in network architectures and training data used in each method. Additionally, the absence of distinct reflective properties at the posterior boundary becomes more pronounced in thicker choroids, where signal absorption in OCT images further diminishes clarity, leading to increased variability in the segmentation results.
The quality of OCT scans is paramount, particularly for choroid measurements where subtle changes <20 µm must be detected. Accurate choroidal thickness measurement depends on precise segmentation of choroid boundaries. If the boundaries are indistinct due to quality issues, it can lead to inaccurate quantitative measurements. Therefore, optimizing image capture and minimizing signal loss is essential to ensure distinct detection of choroid boundaries. Novice operators should undergo comprehensive training before commencing data collection to mitigate potential issues such as improper fixation, head tilt, eye movements, dry eyes, incorrect distance between the eye and the device, axial misalignment of the OCT scanning head, and uneven illumination during acquisition.48 Additionally, adhering to manufacturer guidelines is imperative for maintaining quality standards.49,50 In our dataset, a few of the randomly chosen test scans (N = 6) that had been previously collected exhibited poor quality or reduced contrast, leading to indistinct choroid boundaries, and were consequently excluded from analysis.
Our findings suggest that studies involving OCT imaging for choroidal thickness should use imaging protocols that capture more than a single scan at each time point. This enhances confidence in the obtained results and mitigates the risk of data loss if one of the scans captures appears to be low quality or corrupted. Out of 130 scan pairs in our test data, eight scans were excluded from the repeatability assessment due to missing or corrupted repeat scan measures. Some of these scan pairs exhibited a difference in choroidal thickness of greater than 20 µm. Although consecutive scan pairs are expected to be identical, when imaging is not optimized during scan capture, scans are prone to quality issues. In such circumstances, fully automated segmentation might not yield the best results. Careful inspection is still required to ensure the choroid boundaries are properly segmented. Since our test set was randomly chosen from seven previous studies, collected and manually segmented by different individuals, some variation in scan capture and border identification was expected.
The strength of the current study lies in utilizing a substantially large set for training the CNN (over 10,000 scans). The set used for validation also maintained a large sample size (N = 130), including participants with a diverse age range, spherical equivalent refraction (SER), and axial length (AL). The validation set was drawn from seven different studies, each meticulously designed and approved by the institutional review board at the University of Houston. To avoid selection bias, only one OCT scan per participant was included, either from the right or left eye (although scans from both eyes were available). Since different individuals performed manual segmentation across the seven studies, any existing individual differences in segmentation criteria were captured within our comparative analysis. Both segmentation methods were corrected for transverse magnification.51
Limitations of the current study include the following. The in-house automated algorithm was trained and tested for Spectralis OCT scans only, so testing for other instruments is warranted. All test OCT scans were from young healthy adults. Future studies should include a broader range of participants and those with retinal pathology to confirm generalizability. Future studies are aimed at investigating the performance of the in-house automated method in children and in participants with pathology, such as age-related macular degeneration, diabetes, and myopic macular degeneration, acknowledging that the quality and clarity of the OCT images can be greatly affected by poor fixation or with the presence of pathology. In addition, given the existence of other automated algorithms, future studies may be aimed at evaluating the performance of the current approach against other available open-source automated approaches.
In conclusion, a custom in-house deep learning-based automated segmentation for quantifying choroidal thickness demonstrated excellent agreement and a strong positive linear relationship with the outcomes of the manual segmentation. Observed differences between the two methods were consistently small across all examined regions. Being objective in nature, the automated approach holds distinct advantages for quantifying choroidal thickness. Automated segmentation could serve as an important clinical tool for examining and monitoring changes in choroidal thickness, particularly in myopia management.


