


Convergence insufficiency (CI) is a common binocular vision disorder that significantly impacts visual comfort and quality of life. It has been hypothesized that CI therapy can also be provided effectively with Virtual reality (VR). Recently, a few studies were conducted on virtual reality-based CI therapy. However, to the best of the authors' knowledge, no systematic review and meta-analysis has been performed on the effectiveness of VR-based CI therapy. Therefore, this study aims to fill this critical gap and investigate the effectiveness of VR-based CI therapy. Consequently, it may be helpful to the clinicians, patients, and researchers to choose therapy, and develop future research studies. A systematic search was conducted on Google scholar, Scopus, PubMed and Science Direct until October 1, 2024. A total of 649 studies were screened, of which 3 studies were eligible to be included. We evaluated the quality and risk of bias for the included studies. Using the random-effects model, we found an overall mean difference of 3.38 (95% CI: 1.61, 5.16) before and after VR-based therapy. I² was 54.82% in our study, which indicates moderate heterogeneity. Then, we performed a Q test and found Q (df = 2) = 4.3593 and p-value = 0.1131, which indicates that albeit some heterogeneity observed in our analysis, it was not statistically significant. We also performed Leave-One-Out sensitivity analysis, which indicates that the overall findings of our analysis were relatively stable and not excessively dependent on any single selected study. No significant evidence of publication bias was found by using a funnel plot, Begg's test (Kendall's Tau = 1, p-value = 0.33), and Egger's test (intercept = 2.45, p-value = 0.40). Although we found VR based CI therapy has a positive effect, small sample size and variability in study methodologies make the current evidence insufficient to draw definitive conclusions regarding its effectiveness. Further studies are required to have more robust and reliable data.
Convergence insufficiency (CI) refers to the inability to accurately move eyes together and inward direction while focusing on a near object from a far object.1-3 The prevalence of CI is between 2% and 33%.4-16 CI has several symptoms such as blurred vision, double vision, headache after short periods of reading, loss of concentration or difficulty concentrating, difficulty using phone, tab, computer.17,18 Therefore, CI creates a significant problem in the daily life activities of humans.19,20 Moreover, nowadays, people are getting more involved in small-handed devices. It was observed that the use of tablets and smartphones increased significantly.21 Therefore, CI may affect the quality of human life more significantly in the future.
There are several types of therapy that can be provided to CI patients, such as office-based vergence therapy, home-based vergence therapy, pencil push-up therapy, computerized vision therapy.22-26 Each therapy has its own drawbacks such as Office-based vergence therapy is most expensive, time-consuming, and limited access and resources.27,28 Home-based vergence therapy has low compliance, low effectiveness, and inaccurate techniques can worsen the condition.22,29 Pencil push-up therapy has limited effectiveness, monotony, as well as low compliance.29,30 Computerized vision therapy has also low effectiveness and lower engagement.29,31 Therefore, researchers are looking forward to developing a new therapy.
Virtual reality (VR) refers to a technology that creates an interactive simulated environment where users feel like they are there.32,33 The VR technology market is growing promptly and it is expected to grow from US $7.3 bn in 2018 to US $ 120.5 bn in 2026.32 Recently, VR technology is increasingly being used for healthcare such as therapy, rehabilitation, patient education, neurological disorders, and so on.33-36 VR is gaining attention due to enhanced engagement, custom environment, home-based real-time monitored and feedback therapy, personalized therapy, and so on.37-39 Researchers also assessed the feasibility of using virtual reality on normal binocular people and found positive result.40,41
There are a couple of review papers that were conducted on convergence insufficiency (CI) therapy.42-47 In review papers, analysis was conducted on different CI treatments. Another review paper was done on the impact of VR on binocular and accommodative function.48 To the best of our knowledge, no systematic review or meta-analysis has evaluated the effectiveness of virtual reality-based vision therapy for convergence insufficiency. This is a critical gap that needs to be analyzed. Therefore, we examined this issue in this current study.
It has been hypothesized that CI therapy can be provided effectively with Virtual reality. Therefore, the primary aim of our systematic review and meta-analysis is to explore the effectiveness of virtual reality-based vision therapy for convergence insufficiency (CI) patients. In addition, we also want to find out strengths and limitations of VR-based therapy and of this systematic review and meta-analysis.
This systematic review and meta-analysis will provide quantitative data from available evidence, which will provide higher levels of reliability compared to individual studies. In addition, as we are combining data from multiple studies, it will provide a more precise estimation of the effectiveness of VR therapy for CI patients. Therefore, researchers, clinicians and patients may have a clear understating of whether VR-based therapy is truly effective for CI or not. They may also get familiar with the strengths and limitations of VR-based therapy for CI. Thus, it may have an impact on clinical practice when choosing appropriate therapy for CI patients. Eventually, it may be helpful for the researchers to design VR-based therapy for CI patients in the future.
MethodsThis systematic review and meta-analysis was performed according to the Preferred Reporting Items for Systemic Review and Meta-Analysis (PRISMA) statement.49-51 We did not require any ethical approval for this study since each included study had already received ethical approval.
Study selectionSearch strategyA systematic search for relevant article was performed in 4 databases (Google scholar, Scopus, PubMed and Science Direct). The search was conducted up to October 1, 2024. During the search we used the following keywords: “Convergence Insufficiency” AND “Virtual Reality” AND “Therapy OR Treatment”.
Inclusion exclusion criteriaWe included the study which satisfied the following criteria: (1) study included convergence insufficiency (CI) patients, (2) virtual reality-based therapy was provided, (3) results published in English, (4) Data available for extraction.
We excluded studies for the following criteria: (1) VR therapy for other eye problems except for CI, (2) CI therapy except VR approach, (3) review articles or case reports, (4) extractable data was not available due to unclear or unreported, (5) duplicate article or repetitive article.
Data extractionData was extracted using a standardized extraction sheet using Microsoft excel. We included study characteristics (author, year, country, age, total participants, number and percentage of male and female participants in case and control group, case group and control group), near point of convergence (NPC), positive fusional vergence (PFV), convergence insufficiency symptoms survey (CISS), near phoria before therapy and after therapy.20,52-55 Although other parameters like positive fusional vergence, near phoria and convergence insufficiency symptoms survey (CISS) are also used for CI diagnosis, they are not reported or available in all our selected studies.18,56,57 We found a standard parameter NPC in all our selected study. Therefore, we used NPC during our analysis. Discrepancies in extraction were resolved by discussion with the co-author.
Quality assessmentWe used the Newcastle-Ottawa quality assessment scale (NOS) to assess the quality of each selected study.58,59 NOS has three categories: selection(representativeness of the exposed cohort, selection of the non-exposed cohort, ascertainment of exposure, demonstration that the outcome of interest was not present at the start of the study), comparability (comparability of cohorts/cases and controls based on design or analysis), outcome (assessment of outcome, was follow-up long enough for outcomes to occur?, adequacy of follow-up) with a total of eight items.58 Here, the selection has 0 to 4 points, comparability has 0–2 points, and outcome has 0–3 points. By adding points from each section, we quantify the quality of the articles.
Risk of bias assessmentWe used Cochrane risk of bias (RoB) tool which is widely used in systematic review and meta-analysis to evaluate the internal validity of trial results and to ensure that results are accurate and reliable.60,61 In short, it is a way of checking whether clinical trials are trustworthy and fair. This tool identifies and evaluates the biases that may arise during study design, data analysis, outcome assessment, reporting of data and other stages. Potential biases can overestimate or underestimate the results which may significantly impact the study outcome. This tool has six domains for assessment: selection bias (random sequence generation and allocation concealment), performance bias (blinding of participants), detection bias (blinding of outcome assessment), attrition bias (handling of incomplete data), reporting bias (selective outcome reporting) and other bias. Each domain is assigned a judgment such as: low risk, high risk, unclear risk. The assessment was done by the authors independently and discrepancies were solved by discussion.
StatisticsR studio was used for statistical analysis in this study.62 We used the mean and standard deviation of near point of convergence before and after VR therapy for statistical analysis as it was only available in all our selected studies.20,52,53 We used a random effect REML model and created a forest plot.63,64 The heterogeneity of the studies was calculated by the Q test and I2 statistics.65,66 We also calculated the sensitivity of the studies to ensure that findings are reliable and stable using the “Leave-One-Out Sensitivity Analysis” method.67 We created a funnel plot to visualize the publication bias.68,69 As the number of selected studies was low, we used Begg's test and Egger's test to get reliable publication bias.70-72
ResultsSearch resultsWe initially identified 649 potential records from four databases (Google scholar, Scopus, PubMed, and Science Direct). Then, after titles and abstracts, 636 records were excluded as they did not match inclusion criteria or meet exclusion criteria. Afterward, 13 records were fully assessed for eligibility. However, 10 records were excluded after being fully assessed as they did not match the inclusion criteria or meet the exclusion criteria. Finally, only 3 records were included in the study. The number of records is small as there are few records relevant to this topic, and it is a new emerging therapy for CI. The flow diagram for study selection is displayed in Fig. 1.
Study characteristics
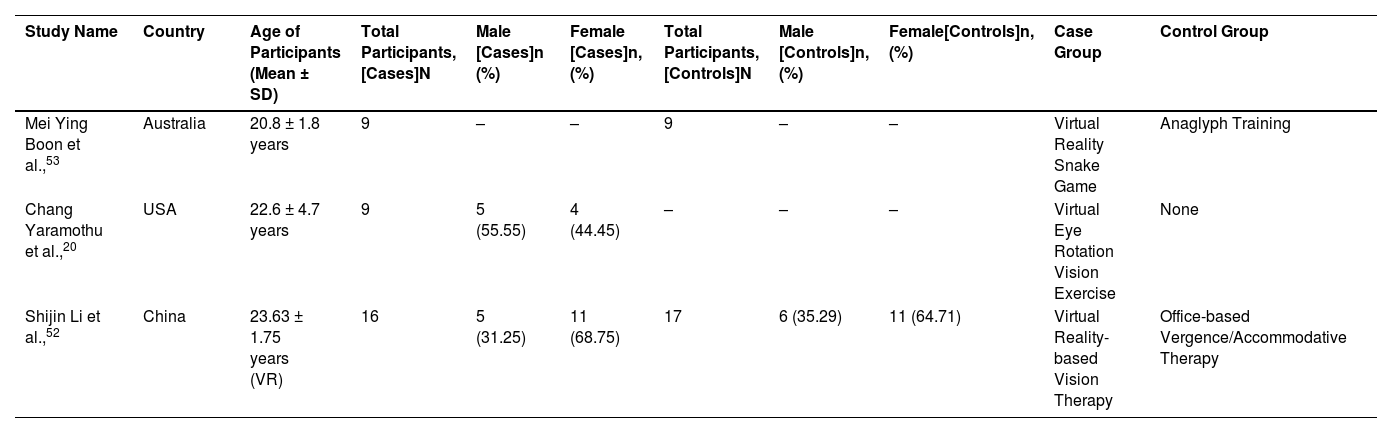
The three studies included in this study had a total of 60 patients from 3 different countries (Australia, USA and China). The participants were primarily young adults, and their average age ranged from 18 to 26. The studies included both male and female participants. Two studies had case and control group and one study had only case group. Number of total participants, number of male and female are reported in the Table 1. In addition, percentage of male and female participants are also reported in Table 1.
Patient's characteristics of included studies. “-” represents missing data, N represents total number of participants in each group, n (%) represents male and female participants and their percentage in the corresponding group. (VR, virtual reality; SD, standard deviation).
| Study Name | Country | Age of Participants (Mean ± SD) | Total Participants, [Cases]N | Male [Cases]n (%) | Female [Cases]n, (%) | Total Participants, [Controls]N | Male [Controls]n, (%) | Female[Controls]n, (%) | Case Group | Control Group |
|---|---|---|---|---|---|---|---|---|---|---|
| Mei Ying Boon et al.,53 | Australia | 20.8 ± 1.8 years | 9 | – | – | 9 | – | – | Virtual Reality Snake Game | Anaglyph Training |
| Chang Yaramothu et al.,20 | USA | 22.6 ± 4.7 years | 9 | 5 (55.55) | 4 (44.45) | – | – | – | Virtual Eye Rotation Vision Exercise | None |
| Shijin Li et al.,52 | China | 23.63 ± 1.75 years (VR) | 16 | 5 (31.25) | 11 (68.75) | 17 | 6 (35.29) | 11 (64.71) | Virtual Reality-based Vision Therapy | Office-based Vergence/Accommodative Therapy |
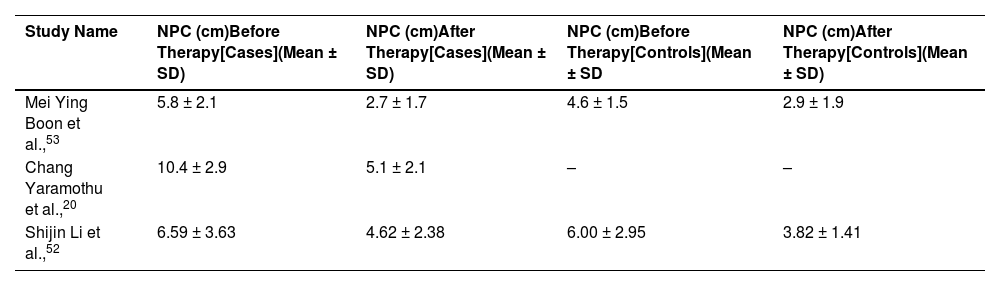
We found near point of convergence (NPC) value before and after therapy for all the selected study in cases group. Therefore, these data were used for meta-analysis in this study. Extracted NPC values are reported in Table 2. All the studies used centimeters (cm) as the unit of NPC. One study did not have a control group. However, as we found data for case groups in all selected study, it did not affect our study.
NPC (cm) value before and after therapy for case and control group. “-” represents missing data. (NPC, near point of convergence; SD, standard deviation).
| Study Name | NPC (cm)Before Therapy[Cases](Mean ± SD) | NPC (cm)After Therapy[Cases](Mean ± SD) | NPC (cm)Before Therapy[Controls](Mean ± SD | NPC (cm)After Therapy[Controls](Mean ± SD) |
|---|---|---|---|---|
| Mei Ying Boon et al.,53 | 5.8 ± 2.1 | 2.7 ± 1.7 | 4.6 ± 1.5 | 2.9 ± 1.9 |
| Chang Yaramothu et al.,20 | 10.4 ± 2.9 | 5.1 ± 2.1 | – | – |
| Shijin Li et al.,52 | 6.59 ± 3.63 | 4.62 ± 2.38 | 6.00 ± 2.95 | 3.82 ± 1.41 |
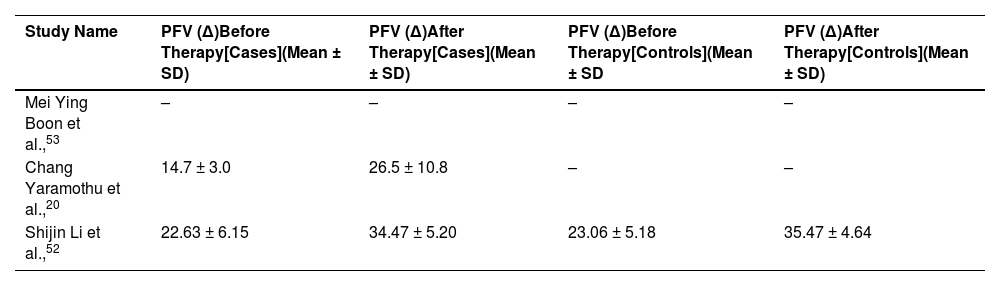
We found positive fusional vergence (PFV) value before and after therapy two selected study in cases group. One study did not report PFV in their study. Therefore, we did not perform meta-analysis using PFV. All the studies used prism diopters (∆) as the unit of PFV. Extracted PFV values are reported in Table 3.
PFV (∆) value before and after therapy for case and control group. “-” represents missing data. (PFV, positive fusional vergence; SD, standard deviation).
| Study Name | PFV (∆)Before Therapy[Cases](Mean ± SD) | PFV (∆)After Therapy[Cases](Mean ± SD) | PFV (∆)Before Therapy[Controls](Mean ± SD | PFV (∆)After Therapy[Controls](Mean ± SD) |
|---|---|---|---|---|
| Mei Ying Boon et al.,53 | – | – | – | – |
| Chang Yaramothu et al.,20 | 14.7 ± 3.0 | 26.5 ± 10.8 | – | – |
| Shijin Li et al.,52 | 22.63 ± 6.15 | 34.47 ± 5.20 | 23.06 ± 5.18 | 35.47 ± 4.64 |
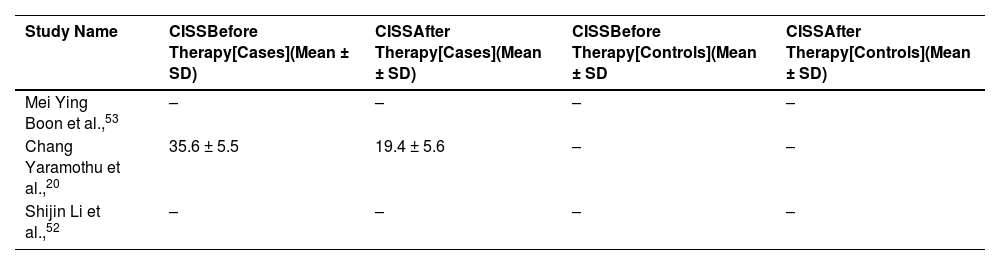
We found convergence insufficiency symptoms survey (CISS) for one study only in case groups before and after therapy. The other two studies did not report CISS score. Therefore, we did not perform meta-analysis using CISS. Extracted CISS values are reported in Table 4.
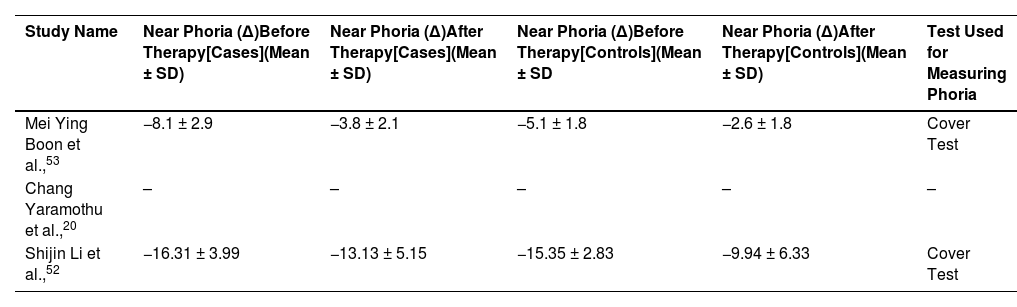
We found near phoria in two selected studies. One study did not report near phoria. Therefore, we did not perform meta-analysis using near phoria. Negative sign in the reported near phoria indicates exophoria. Extracted near phoria values are reported in Table 5.
Near phoria (∆) value before and after therapy for case and control group. “-” represents missing data. Cover test was used in these studies. Negative sign indicates exophoria (SD, standard deviation).
| Study Name | Near Phoria (∆)Before Therapy[Cases](Mean ± SD) | Near Phoria (∆)After Therapy[Cases](Mean ± SD) | Near Phoria (∆)Before Therapy[Controls](Mean ± SD | Near Phoria (∆)After Therapy[Controls](Mean ± SD) | Test Used for Measuring Phoria |
|---|---|---|---|---|---|
| Mei Ying Boon et al.,53 | −8.1 ± 2.9 | −3.8 ± 2.1 | −5.1 ± 1.8 | −2.6 ± 1.8 | Cover Test |
| Chang Yaramothu et al.,20 | – | – | – | – | – |
| Shijin Li et al.,52 | −16.31 ± 3.99 | −13.13 ± 5.15 | −15.35 ± 2.83 | −9.94 ± 6.33 | Cover Test |
We found that one study scored 5 points out of 9 in quality assessment. One study scored 6 points out of 9 in the quality assessment. Another study scored 7 points out of 9 in the quality assessment. All 3 studies scored fewer points in the comparability section and scored well in the selection section. Quality assessment values for the selected studies are reported in Table 6.
We also performed Risk of bias assessment using Cochrane risk of bias (RoB) tool for selected three studies. A graphical representation of the result was used to present the results for facile comprehension in Fig. 2.
Forest plot
The mean difference with 95% confidence intervals is shown for each included study in Fig. 3. The mean difference and 95% CI intervals were 3.10 [95% CI, 1.33–4.87], 1.97 [95% CI: −0.16–4.10], 5.30 [95% CI: 2.96–7.64] for the included 3 studies. The weight of each study is also shown, and we found Mei ying boon's study had a maximum weight of 44.28% and Chang yaramothu's study had lowest weight of 25.22%. The diamond represents the overall effect estimate at the bottom. The random-effects model indicates an overall mean difference of 3.38 (95% CI: 1.61–5.16).
Random-effects model resultsHeterogeneity statistics before and after virtual reality (VR) intervention for each study.")
tau² represents the estimated variance in actual effect size of the individual studies.73,74 Our analysis found tau² (Estimated Amount of Total Heterogeneity) is 1.3465 (SE = 2.4651). Here, the tau² value indicates moderate heterogeneity, but a large SE implies that there is a fair amount of uncertainty in the heterogeneity, which may be due to the small sample size. Tau is the square root of tau, which represents the standard deviation of the effect sizes. Tau (Square Root of Estimated tau² Value) is 1.1604 in our analysis. Here, a tau of 1.1604 indicates moderate variability among the selected studies. I² represents the percentage of variability in effect estimates due to heterogeneity rather than chance (or sampling error).66 We found that I² (Total Heterogeneity / Total Variability) is 54.82% in our study, which indicates moderate heterogeneity. H² represents the ratio of total variability to sampling variability. We found H² (Total Variability / Sampling Variability) is 2.21. H² = 2.21 implies that the observed variability in effect sizes is more than twice what would be expected from sampling variability. It confirms the presence of moderate heterogeneity among our selected studies in this analysis.
Test for heterogeneityThe Q-test (also known as Cochran's Q-test) is a statistical test used in meta-analysis to assess whether the observed heterogeneity among the selected studies results is more significant than would be expected due to chance alone.75 We found Q (df = 2) = 4.3593 and p-value = 0.1131.Q, which is the calculated value of Q statistics based on the overall difference among the study effect sizes. Df = 2 indicates a degree of freedom, and it is df = (n-1), where n represents the number of studies included in the analysis. Here, the p-value is 0.1131, more than 0.05, implying that the heterogeneity observed during our analysis is not statistically significant. In summary, we can conclude that there is some heterogeneity observed in our analysis, but it is not statistically significant, which means this variability may be due to the random chance rather than significant difference between included studies.
Model resultsThe estimated value we found was 3.3837, which implies the main effect size for our analysis. This estimate has a standard error of 0.9052, which indicates that there was some variability around the estimate. Then, we checked Z-value, which rendered more stronger evidence that the observed effect or relationship is real rather than just a random occurrence. A high z-value means that the observed result is far from what we would expect by chance and evidence that the result is likely meaningful. We found a Z-value 3.7382, which strongly suggests that the observed estimate value (3.3837) is statistically significant and unlikely to be due to random chance. In addition, it resulted in a very small p-value of 0.0002, which is very low and indicates that the result is statistically significant, meaning it is very unlikely to have occurred by chance. Additionally, we calculated a 95% confidence interval for our estimate, which ranged from 1.6096 to 5.1578. This interval suggests that we are 95% confident that the true effect size lies between these values.
Sensitivity analysisWe used “The Leave-One-Out” Sensitivity Analysis to show how the overall effect size and error change when we remove each study, one by one, from our analysis.67,76 We can learn from this sensitivity analysis how much each individual study influences the overall findings. For instance, when we removed Mei Ying Boon's study, the average effect size became 3.64 with an average error of 3.96. Then we removed Shinjin Li's study, the effect size increased to 4.20, and the error decreased to 3.14. Eventually, we also removed Chang Yaramothu's study resulted in an effect size of 2.54 with an error of 3.52.
We observed that the effect sizes and error changes are noticeable, but they are not extreme. Thus, it implies that each study contributes differently to the overall outcome, but no single study seems to extremely change the conclusions. Therefore, it indicates that the overall findings of our analysis are relatively stable and not excessively dependent on any single selected study.
Publication biasPublication bias is defined as when only studies with positive or interesting results get published, while studies with no effect or negative results are often not published.77 This creates a problem because we only see studies that show positive results and do not see negative results, which can make something more effective compared to actual effectiveness.
Funnel plotA funnel plot is a graphical representation used to evaluate publication bias. It shows whether the results of studies are skewed, or any study tends to show different outcomes compared to other studies.78,79 If publication bias is not present, the plot will look like an inverted funnel or triangle. Selected studies will be symmetrically distributed around the average effect within the inverted funnel. If there is a publication, the plot may look asymmetrical. This lack of symmetry in the funnel plot indicated that selected studies only partially represent all potential findings. Therefore, the conclusions drawn from the meta-analysis might be less reliable.
As the number of studies selected is low and it is tough to draw a reliable conclusion from this limited number of studies using funnel plots in Fig. 4. The somewhat asymmetry in the plot could be due to the small number of selected studies rather than actual publication bias. Therefore, we also conducted Begg's test and Egger's test to evaluate the publication bias.
Begg's test and the standard error.")
Begg's test did not show significant evidence of publication bias in the meta-analysis (Kendall's Tau = 1, p-value = 0.33). The p-value of 0.33 (P > 0.05) from Begg's test indicates that there is no statistically significant evidence of publication bias. (Kendall's Tau = 1) indicated a positive correlation between effect size and variance.
Egger's testEgger's test did not reveal significant evidence of publication bias in the meta-analysis (intercept = 2.45, p-value = 0.40). The p-value of 0.40 indicates that there is no statistically significant evidence of publication bias. Although the intercept was greater than zero, indicating some potential asymmetry in the funnel plot. However, since the p-value is not significant, this asymmetry is likely due to random variation rather than actual bias.
DiscussionFindingsWe used a random effect model with our selected 3 studies. Our estimated heterogeneity(tau2) is 1.3465, which indicates some variation between the selected studies. We also found moderate heterogeneity as I2 is 54.85%. Then, we conducted a Q test for heterogeneity, and it did not show significant evidence for heterogeneity as P value = 0.1131(P > 0.05). We found that the overall estimated effect size is 3.3837, which indicates that VR-based treatment has a positive effect on the outcome. The confidence interval varies from 1.6096 to 5.01578, which indicates that true effect size lies between them. The p value is 0.0002, which means that there are statistically significant effects of the treatment. However, statistical significance does not always indicate clinical significance. NPC improvement of at least 4–5 cm is generally considered clinically significant. Since the effect size in this study is 3.38 cm, it is approaching towards clinical significance. From “Leave-One-Out” Sensitivity Analysis, we observed that although there are some changes in mean difference but it is not excessive. Therefore, we can conclude that the overall result is reliable as result is relatively stable when the individual study is removed. Initially, we created a funnel plot, but publication bias was not clear. Therefore, we conducted Begg's test and Egger's test for further evidence. We did not find significant evidence of publication bias for our analysis as Begg's test (p-value = 0.33) and Egger's test (p-value = 0.40).
We found that different studies used different parameters for outcome assessment. We only found NPC as a common parameter in our selected three studies. We would find more reliable and robust data if we have more common parameters. However, VR-based CI therapy also showed improvement in other parameters (PFV, CISS, near phoria). The amount of therapy is not same for all included studies. The amount of therapy can significantly affect the outcome assessment. One study used three 20 mins per week session over 6 weeks.53 However, the other two study therapy times were same. One study used 12 one-hour sessions of therapy and another study 1 hour per week for 12 weeks.20,52 Included studies performed two types of outcome assessment: clinical (NPC, PFV, Near phoria) and questionaries (CISS). They are subjective assessment as they depend on patients’ reporting and clinicians ability to observe. This subjective assessment can be error prone. Although, we found positive effect from VR-based CI therapy, its initial cost can be a barrier to its application. Therefore, cost effectiveness analysis is important, which was not performed by any of the included studies. All the included studies were limited to young adults (ages 18–26) which leaves an uncertainty about the effectiveness of CI in children and older adults. However, the studies included participants from Australia, the USA, and China, suggesting cross-cultural feasibility.
Higher patient engagement in VR based CI therapy was mentioned in the study conducted by Li et al.72 On the other hand, real-time tracking and feedback was used by the study conducted by Chang et al.20 which may influence higher compliance level. However, Boon et al.53 study did not explicitly mention compliance data and we did not find anything which may help us to comment on compliance. We believe that this study also has higher compliance as it also used VR. Boon et al.53 used a VR snake game as a therapy modality. On the other hand, Chang et al.20 developed VERVE (virtual eye rotation vision exercise) and used in their study. Li et al.72 used a customized VR training module. A commercially available VR headset (oculus rift) was used in Boon et al.53 study. An eye tracking enabled VR headset was used in chang et al.20 study. On the other hand, Li et al.72 used a high resolution VR display.
ComparisonVR-based therapy for CI showed positive overall results. VR-based therapy has several advantages compared to others, such as more engagement, personalized, and virtual environment, which is not feasible with other traditional therapies. VR-based therapy may mitigate the drawbacks of other conventional therapy. For example. Office-based vision therapy requires expert clinicians, time, and resources. VR therapy may solve this dilemma by providing therapy at home without expert clinicians. On the other hand, home-based vision therapy is monotonous, has low patient compliance, no real-time feedback, and is less effective. VR therapy may also solve this problem and may provide more effective, real-time feedback and engaging therapy. However, the effectiveness of VR-based CI therapy is comparatively low with other traditional therapies. Total NPC changes after 12 weeks for home-based pencil push-up therapy is −6.4, [95% CI: −7.8, −5.0], for office based vergence accommodative therapy with home reinforcement is −10.4 [95% CI: −11.7, −9.0].80 For VR-based therapy the total average NPC changes for included studies was 3.38 (95% CI: 1.61, 5.16). The reason for less effectiveness may be different therapy periods and less sample size in VR therapy groups.
StrengthTo be best of authors knowledge, there are no systematic reviews and meta-analysis for VR-based therapy for CI patients. Our analysis will fill this critical gap. In addition, we are providing quantitative data from the multiple existing study, which renders the overall outcome of the VR-based therapy which was not available before. Sometimes, only positive results are published by some individual study, which may mislead the clinicians or researchers. Therefore, data from individual studies may sometimes be less reliable and less robust. However, quantitative data from multiple study by meta-analysis is more reliable because if there is any publication bias that can be identified.
LimitationsThe most important limitation of this review and meta-analysis is the small sample size, with only three studies included. Since it is an emerging therapy, the number of studies is low. Some included study quality was medium, and particularly for comparison, it was low. This may affect the robustness of our findings from the analysis. Although the analysis was conducted on 3 studies, significant evidence of publication bias was not found. We performed meta-analysis only on near point of convergence as it was the only common parameters and other parameters were not available for all selected studies. Additionally, we found variability in therapy protocols among the included studies which complicates drawing robust conclusions. For instance, one study employed three 20-minute sessions per week over six weeks, while others used 12 one-hour sessions spread across different timelines. The populations studied were often homogeneous, primarily involving young adults, which limits applicability to other age groups, such as children or older adults, who might respond differently. While VR-based therapies were found effective, the high cost and technical requirements (e.g., VR headsets, specialized software) limit accessibility, particularly in resource-limited settings. Lifestyle habits (e.g., screen time, occupation, near-work intensity) were not adequately controlled or quantified which may affect the outcome.
Assessment of quality and biasAssessing the quality and bias of studies is important for systematic reviews or meta-analysis. It ensures that the findings are trustworthy and reliable. We used Newcastle-Ottawa quality assessment scale (NOS) to assess the quality of our selected study. Our selected 3 studies scored 5, 6 and 7 points out of 9.20,52,53 All three selected studies scored 3 in the selection section which indicates that studies adequately addressed most aspects of participant selection. Two studies scored 1 in compatibility section as they had control group. However, one study did not have any control group. Thus, it scored 0 in comparability section.20 In addition, selected studies did not mention controlling for other confounding variables such as age, gender, or baseline severity of CI. One study scored 3 in exposure section as it had strong methods in exposure/outcome assessment and follow-up methods.52 However, other studies did not have clear follow-up methods.20,53
We used Cochrane risk of bias tool for risk of bias assessment. It has 7 domains for bias assessment. For random sequence generation domain, two studies had unclear risk, and one study had low risk as it mentioned a randomization process clearly. For allocation domain, 3 selected studies had unclear risk as they did not clearly mention the methods to conceal allocation. For blinding participant and researchers all 3 selected studies had high risk as it was not performed in the studies. For blinding of outcome assessment domain, 3 selected studies had low risk as they assessed outcome by masked examiner. For Incomplete outcome data domain and selective reporting domain, 3 studies had low risk as they satisfy this domain. For other bias domain, 3 selected studies had high risk due to the low number of participants.
Future researchWe did not find large-scale randomized trials which are required to get more reliable results. It may include diverse populations to see whether it is genuinely effective in diverse populations or not. While assessing the quality of the included study, comparison points were low for each study. Therefore, more study should be done with direct comparisons with other conventional therapy procedures. In addition, we did not find where therapy was provided on normal binocular people. It will also be interesting to include normal binocular people and provide VR-based therapy and see the outcome. Comparison with the normal group and CI group after providing VR-based therapy will provide more reliable data. We did not find the long-term effects of the therapy. It will be interesting if future study includes long-term follow-up to observe how VR-based therapy performs in the long-term. Future studies should include follow-ups at intervals of 6 months, 1 year, and beyond to assess whether the intervention's effectiveness is sustained over time. It may evaluate whether effectiveness is sustained over time or not, and if not, how it changes over time. Future studies should incorporate advanced technologies, such as functional MRI, to obtain objective metrics of therapeutic efficacy, thereby complementing subjective assessments. In future, studies should perform cost-effective analyses to evaluate the feasibility of integrating VR therapy into clinical practice, especially in economically challenged areas. In future studies, a similar amount of therapy should be provided to each therapy group to obtain actual comparison results. Future studies may also increase the quality of the research and make the VR-based therapy more reliable.
ConclusionThis study fills a critical literature gap as there was no systematic review and meta-analysis on VR-based CI therapy. While we found that VR-based vision therapy has positive overall outcomes for CI patients, the limited number of included studies and their moderate quality may not let us draw a concrete conclusion on the effectiveness of VR. Although there was moderate heterogeneity, it was not statistically significant. Further analysis with the Q test confirms that there is no significant evidence for heterogeneity. As we only found 3 relevant studies for our analysis, we did a sensitivity analysis to ensure the strength of the findings, and it confirms that the results are reliable. No significant evidence of publication bias was found by analyzing the funnel plot, Begg's test, and Egger's test. Therefore, the quantitative data that we found may be reliable. However, given the small sample size and variability in study methodologies, the current evidence is insufficient to draw definitive conclusions regarding the effectiveness of VR-based therapy for CI. However, further study is required to get more robust quantitative data on the effectiveness of VR therapy for CI patients. The findings of the study may provide preliminary insight, and it may also be helpful for future research study development.
Data availabilityNot required.
FundingNo funding was used for this study.
Ethics approval statementNot required.
Patient consent statementNot required.
Permission to reproduce material from other sourcesNot required.
Clinical trial registrationNot required.
Declaration of competing interestThe authors have no conflicts of interest to declare.
CRediT authorship contribution statementTorikul Islam: Conceptualization, Data curation, Formal analysis, Investigation, Methodology, Project administration, Resources, Software, Supervision, Validation, Visualization, Writing – original draft, Writing – review & editing. Amit Dutta Roy: Validation, Writing – review & editing.
The authors would like to thank Dr. Chang Yaramothu, an Assistant Professor at the New Jersey Institute of Technology, for his help in understanding convergence insufficiency and its therapy.


