


To compare refractive assessment results obtained with an aberrometer, an autorefractor, and manual subjective refraction (SR) in a healthy population with optimal visual potential.
MethodsSixty adults aged 18–59 years with visual acuity of 20/25 or better, no media opacity, and no known corneal or retinal abnormalities were recruited during the course of routine eye examination. Refractive error in both eyes of each patient was assessed by 3 methods: manual SR, a Nidek 530-A autorefractor (AR), and a Nidek OPD-II Scan wavefront aberrometer (OPD). The order of testing was randomized. One technician collected all OPD and AR measurements, and 1 optometrist performed manual SR. Refractive measurements were converted from spherocylindrical prescriptions to power vectors and compared between methods by 2-factor repeated measures and Bland–Altman analysis.
ResultsAnalysis of the power vectors followed by a log transformation showed no significant difference in refractive results between AR, OPD, and SR (P=.63). Bland–Altman analysis identified mean differences (95% CI of limits of agreement) of −0.06 (−0.67 to 0.55) for OPD vs SR, 0.001 (−0.522 to 0.524) for AR vs SR, and 0.06 (−0.541 to 0.662) for AR vs OPD.
ConclusionAgreement between all refractive assessments was comparable to previously reported agreement between repeated measures of SR. Agreement between AR and SR was slightly stronger than between OPD and SR. Although both the OPD and AR results, in general, showed a high level of agreement with SR, results beyond ±0.50D (5.8% for AR, 10% for OPD) would discourage prescribing spectacles directly from either instrument.
Comparar los resultados de la evaluación refractiva obtenidos mediante aberrómetro, autorefractómetro y refracción subjetiva manual (RS) en una población sana con un potencial visual óptimo.
MétodosSe reclutó a sesenta adultos de edades comprendidas entre 18 y 59 años, con agudeza visual de 20/25 o superior, sin opacidad de medios, y sin anomalías retinianas o corneales, en el curso de un examen ocular rutinario. Se evaluó el error refractivo en los dos ojos de cada paciente mediante tres métodos: RS manual, un autorrefractómetro (AR) Nidek 530-A, y un aberrómetro por frente de onda Nidek OPD-II Scan (OPD). El orden de las pruebas fue aleatorio. Un técnico recolectó todas las mediciones de OPD y AR, y un optometrista llevó a cabo la RS manual. Las mediciones refractivas se transformaron de prescripciones esferocilíndricas en vectores de potencia, comparándose entre sí los tres métodos mediante mediciones repetidas de dos factores y análisis de Bland–Altman.
ResultadosEl análisis de los vectores de potencia, seguido de una transformación logarítmica, no reflejó ninguna diferencia significativa de los resultados refractivos entre AR, OPD, y RS (P=0,63). El análisis de Bland–Altman identificó diferencias medias (95% de IC de los límites de acuerdo) de–0,06 (–0,67-0,55) D para OPD frente a RS, 0,001 (–0,522-0.524) D para AR frente a RS, y 0,06 (–0,541-0,662) D para AR frente a OPD.
ConclusiónLa concordancia entre todas las evaluaciones refractivas fue comparable a la concordancia previamente reportada entre las mediciones repetidas de RS. La concordancia entre AR y RS fue ligeramente superior que entre OPD y RS. Aunque en general los resultados de OPD y AR reflejaron un elevado nivel de concordancia con RS, los resultados que exceden la diferencia de ±0.50D (5.8% para AR, 10% para OPD) no permiten realizar la prescripción de gafas con cualquiera de ambos instrumentos.
Manual subjective refraction (SR), which is frequently based on manual retinoscopy or current spectacle prescription, is the standard for comparison of new instruments that assess refractive error in clinical practice.1–5 The status of SR as the standard for determination of spectacle prescription has been established by convention and by the definition of “endpoint” as the combination of lenses that provides the best-corrected visual acuity. However, the procedure is, by definition, subjective. Variability in patient responses to small changes in prescription, along with intraexaminer and interexaminer inconsistency, limits the precision and repeatability of the procedure.6–9 In addition, considerable practice is required to master the technique of manual SR, and the process of performing the test can be clinically time-consuming. Therefore, technology that could decrease the time required for refraction, or even allow for delegation of refractive data collection to technicians, could potentially increase efficiency in optometric practice.
Two such technologies are autorefractors and wavefront aberrometers. Autorefraction is widely accepted as a clinically valuable starting point for SR.1,2,8,9 Autorefractors offer rapid automated assessment of refractive error and are now commonly used in ophthalmic practice. Along with autolensometers and automated phoropters, they can be incorporated into comprehensive automated SR systems that allow technicians with minimal training to collect and refine refractive data. Both SR and autorefraction measure low-order aberrations: sphere (defocus) and astigmatism. However, higher-order aberrations (coma, trefoil, spherical aberration) can also degrade the quality of the optical image received by the retina. Wavefront aberrometers can measure both lower- and higher-order aberrations. If superior visual acuity can be achieved by correction of higher-order aberrations compared with a spherocylindrical prescription, aberrometry could eventually replace SR as the standard for refractive assessment.
The purpose of this study was to evaluate agreement in the spherocylindrical prescription generated by an aberrometer, refractive assessment by an autorefractor, and manual SR in an optometric clinic. If the data obtained by the different methods are comparable, use of an automated system may decrease the time needed to collect refractive data without loss of prescription accuracy. Because adult patients without significant eye problems represent the largest patient demographic group seen in our clinic for routine eye examination, use of an automated method may then substantially increase the productivity of our clinic.
MethodsPatientsThis study was approved by our institutional review board, and the research followed the tenets of the Declaration of Helsinki. Adults aged 18–59 years reporting to our department of ophthalmology for a routine eye examination were recruited for inclusion in the study between January 6 and February 28, 2009. Patients were excluded from study participation if they currently wore contact lenses, had best-corrected visual acuity of less than 20/25, or had a history of any corneal, lenticular, media, or retina abnormality. Patients also were excluded if they had clinically diagnosed cataracts at the time of enrollment or had undergone cataract extraction or refractive surgery. All included patients gave verbal consent and written Health Insurance Portability and Accountability Act authorization.
For each patient, 3 different refractive measurements were performed: manual SR, autorefraction with the Nidek 530-A autorefractor (Nidek Co, Japan, for Marco, Jacksonville, Florida), and aberrometry with the Nidek OPD-Scan II wavefront aberrometer. Both instruments are used in our clinical practice as part of the Marco EPIC Refraction System.
AutorefractionThe Nidek 530-A autorefractor (AR) uses zonal ring image technology to obtain refractive measurements. A ring of superluminescent diode light is projected through a fixed, 2.6-mm pupillary zone onto the retina and then reflected back onto sensors in the instrument. The sensors interpret the shape of the reflected rings as myopia, hyperopia, and astigmatism. The magnitude of each shape is then referenced as a spherocylindrical refraction. A single refractive result from this instrument consists of at least 3 measurements, which are then analyzed to produce a single spherocylindrical result.
AberrometryThe Nidek OPD-II Scan aberrometer (OPD) measures wavefront error using dynamic skiascopy.10 The instrument projects, (1,440) individual beams of light through the pupil onto the retina and measures differences in the time it takes for the beams to reach the instrument's sensors after being reflected off the retina. Beams projected along relatively hyperopic optical paths within the visual system will reach the sensors sooner than those passing along more myopic paths. This time-dependent analysis calculates wavefront errors for a visual system. Lower-order aberrations (sphere and astigmatism) are measured in a 2.6-mm zone in the pupil, just as with a traditional autorefractor. The OPD also measures the low-order wavefront error across a 4- to 6-mm zone in the pupil. From this blended zone of low-order wavefront analysis, a sphere, cylinder, and axis are determined by using Zernike vector analysis. Additionally, a root-mean-square wavefront error is calculated. The OPD compares the 2.6-mm autorefraction with the larger zone wavefront analysis, along with the root-mean-square value, to determine which of the 2 refractive error measurements should be used as a starting point for the SR. Theoretically, this combined process should create a measurement of greater accuracy than autorefraction alone.
Refractive assessmentThe order of the 3 refractive assessments (SR, AR, and OPD) was randomized for each patient. Patients’ eyes were neither dilated nor treated with cycloplegic drugs before refractive assessment. All measurements were obtained during a single examination. All measurements from the AR and OPD were acquired by 1 technician, and 1 successful measurement was taken on each instrument, in normal room illumination. The OPD was set to the 4-mm zone for all measurements. Each patient's visual acuity with the AR and OPD results was measured using a projected Snellen chart in a 20-foot-equivalent refracting lane. One optometrist performed SR (including binocular balance) on both eyes of all patients in the same refracting lane, using the same illumination (lights slightly dimmed to improve contrast on a projected eye chart) as for AR and OPD refractive assessments. The starting point for the refraction was either manual retinoscopy or the patient's habitual spectacle prescription. The optometrist was masked to the results of AR and OPD and the technician to the SR results. Each spherocylindrical lens result was converted to a power vector. The Pythagorean length of each power vector was measured using a spreadsheet formatted with the transposition formula designed by Thibos et al.11 This length, termed “B” by Thibos and Horner,12 is the overall blur strength of a spherocylindrical refractive error and was the sole refraction measurement data point used for statistical analysis.
Statistical analysisThe B measurements of both instruments were statistically compared with the SR. Measurements obtained by AR were also compared with those calculated by OPD. Our sample size (60 patients, 120 eyes) provided 90% confidence to detect a difference of 0.25D. The estimated parameters were compared among the 3 methods using a 2-factor repeated-measures analysis of variance, with the 2 factors being the eye and the method of measurement. A log transformation was used to run the models given the nature of the distribution. Bland–Altman plots showing mean and 95% CI of limits of agreement were also used to assess agreement between refraction methods. SAS software version 9.3 was used for statistical analysis.
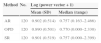
ResultsThe mean age of the 60 patients was 43.25 years (range, 21–58 years). A total of 360 spherocylindrical prescriptions (3 assessments of both eyes of 60 patients) were converted to a single power vector length as described above (Table 1). The 2-factor repeated-measures analysis of variance of the log power vector revealed no statistically significant difference in power (P=.63) among the 3 methods of assessment.
Log transformation of data for the repeated-measures analysis.
| Method | No. | Log (power vector+1) | |
|---|---|---|---|
| Mean (SD) | Median (range) | ||
| AR | 120 | 0.902 (0.514) | 0.757 (0.163–2.466) |
| OPD | 120 | 0.890 (0.501) | 0.770 (0.000–2.330) |
| SR | 120 | 0.901 (0.519) | 0.757 (0.000–2.399) |
Abbreviations: AR, Nidek 530-A autorefractor; OPD, Nidek OPD-II Scan aberrometer; SR, subjective refraction.
We also analyzed our data (B values) using Bland–Altman plots. Comparison between OPD and SR revealed a mean (SD) difference of −0.06 (0.31)D and 95% CI of −0.67 to 0.55D (Fig. 1). AR showed slightly better agreement with SR than did OPD; the mean (SD) difference was 0.001 (0.262)D (95% CI, −0.522 to 0.524D) (Fig. 2). When comparing AR with SR, 94.2% of measurements were within ±0.50D, approximately 80% were within ±0.25D, and 7 measurements differed by more than ±0.50D. Comparison of OPD and SR found 90% of measurements were within ±0.50D, approximately 73% were within ±0.25D, and 12 measurements differed by more than ±0.50D. Finally, comparison of AR and OPD revealed a mean (SD) difference of 0.06 (0.30)D (95% CI, −0.541 to 0.662D) (Fig. 3). Visual analysis of the Bland–Altman plots showed most of the points to be in the 2SD range and to scatter consistently around 0. The differences seem systematic and show that the 3 methods of refraction arrive at similar results.
 and subjective refraction (SR). The 95% limits of agreement are indicated by the upper and lower dashed lines, and the mean is indicated by the solid line.")
 and subjective refraction (SR). The 95% limits of agreement are indicated by the upper and lower dashed lines, and the mean is indicated by the solid line.")
 and the Nidek 530-A autorefractor (AR). The 95% limits of agreement are indicated by the upper and lower dashed lines, and the mean is indicated by the solid line.")
Mean differences of low magnitude, as found between all 3 measures of refractive error, indicated that there was no trend of overminus or underplus refraction for either AR or OPD as compared with SR on the Bland–Altman plots.
DiscussionIn this clinical study, the OPD and AR provided reliable information on lower-order aberrations. AR showed slightly closer agreement with SR than did OPD, but the difference was not statistically significant. Based on preliminary estimates, we powered this study to detect a 0.25-D difference in measurements. Approximately 80% of AR results and 72% of OPD results were within ±0.25D of SR values. The OPD can provide information that may explain the visual distortion that persists even after correction of spherical and cylindrical refractive error, but aberrometry does not provide a substantial advantage over autorefraction for determination of standard spherocylindrical spectacle prescriptions at this time.
Reliability and repeatability of SR, autorefraction,1–4,13–15 and aberrometry have been studied extensively. Both interobserver and intraobserver variability have been assessed, and data have been obtained both before and after cycloplegia or dilation. A review of several studies concluded that interobserver and intraobserver manual refractive error assessment generally reaches 80% agreement within ±0.25D and 95% agreement within ±0.50D.16 Comparison of AR and OPD versus SR in this study was similar to the interobserver and intraobserver agreement for manual refraction found in prior studies.
Autorefraction was found to be significantly more repeatable than SR by Bullimore et al.14 Another study showed refractive results obtained with 2 autorefractors to provide close agreement with SR.4 Because of excellent repeatability of autorefraction results with various instruments,1–3 and because the AR result for a single measurement is actually the mode of multiple refractive assessments, we believed that a single autorefractor measurement would suffice for the purpose of this clinical study.
Aberrometers create a map of higher-order aberrations of the eye expressed using Zernicke polynomials that are used to calculate a spherocylindrical refractive value. Early wavefront aberrometers, such as the Complete Ophthalmic Analysis System (COAS) were based on Shack–Hartmann methods of assessment, in which a pattern of discrete points of light was projected onto the retina. Deflection of individual points within the array as it was reflected from the retina back to the instrument's sensors allowed for position-based quantification of the higher-order aberration profile of the eye. Unlike early aberrometers, the OPD's assessment of the aberration profile of the human eye is based on time-dependent rather than position-dependent (Shack–Hartmann) optical analysis. Studies evaluating spectacle prescriptions generated by position-based aberrometers (e.g., COAS) have reported similar accuracy and repeatability to autorefraction.5,15,17 The COAS also measured higher-order aberrations in model eyes with minimal variation between repeated assessments.17 Pesudovs et al.18 compared the COAS aberrometer with autorefraction and SR and found similar levels of agreement between SR, autorefraction, and aberrometry as in the present study. Nissman et al.19 examined the accuracy and repeatability of a time-based aberrometer and found that the initial measurement did not significantly vary from the mean of 3 measurements. Thus, we concluded that a single measurement with the OPD would provide sufficient data for the purposes of this study.
Considerable variety exists in the methods by which refractive components have been statistically compared, and this variability confounds attempts to compare results between studies. Some studies1,8 reported the agreement between each component (sphere, cylinder power, cylinder axis) of a spectacle prescription. Others compared the spherical equivalent powers of multiple refractions, along with degrees of variability in cylinder orientation.1,2,6,8 Attempts to compare individual components of a spherocylindrical prescription are complicated by 2 factors: sphere and cylinder are not independent variables, and cylinder axis represents orientation rather than power. Conversion of spherocylindrical prescriptions into power vectors allows for all components of a spherocylindrical prescription to be accounted for and has become the standard by which refractive data are compared.4,5,11,14,20,21 The components of a power vector are spherical lens M and Jackson cross cylinders J0 and J45. M, J0, and J45 represent the coordinates of a power vector that can be plotted in a 3D rectangular space. The Pythagorean length of this vector, termed B, can be calculated using the Thibos spreadsheet11 and was the measure used in our study.
In our clinic, all AR and OPD measurements are obtained in normal room illumination, and SR is performed in slightly dimmer illumination to enhance the contrast of the projected visual acuity chart. Despite differences in illumination, we found no difference in mean refractive error between the 3 methods of assessment. This is probably due to the consistent pupillary zone measured for the AR and OPD, 2.6mm and 4.0mm, respectively. It is possible that differences may have been detected if a larger pupillary zone had been set for the OPD, but our primary concern was to assess agreement between methods of refractive error determination as obtained with our standard procedures.
Some reports have suggested that noncycloplegic autorefraction yields consistent bias toward overminused or underplussed refraction compared with SR.22 Because we wished to determine whether the instruments used in our clinical practice were subject to such bias, and to assess whether accommodation was controlled more accurately in SR than in automated assessments of refractive error, we chose to obtain noncycloplegic measurements. Similar to another study comparing SR with an aberrometer,23 our subjects’ pupils were not pharmacologically dilated for refractive measurements. Our study's design was to evaluate patients in our normal clinical setting, unlike a consistent, pharmacologically dilated pupil that would be measured in a scientific setting. Thus, our autorefractor and aberrometer results revealed no statistically or clinically significant bias toward overminused or underplussed correction compared with manual SR. A visual analysis of the Bland–Altman plots shows a relatively even distribution of results between +0.50D and −0.50D.
We did not include children in our study, since our clinical population consists primarily of adults. Therefore, we also cannot comment on the agreement between SR, AR, and OPD measurements in children.24 Furthermore, we excluded subjects older than 60 years, so we cannot state whether AR and OPD are similar to SR in that population.
Numerous authors have alluded to the subtle, but critical, differences between measuring refractive error and determining a spectacle prescription.18,20 Measuring refractive error is simply data collection; determining a spectacle prescription requires evaluation of multiple data points, including, but not limited to, assessment of refractive error. Several studies examining patient acceptance of spectacles based solely on autorefraction, compared with those incorporating SR, found better initial acceptance of SR,25,26 particularly during the first 2 weeks of wear.26 That study, however, reported considerably wider limits of agreement between autorefraction and SR26 than those noted in the present study. It is possible that spectacle prescriptions generated by current autorefractors or aberrometers may be more similar to SR than prescriptions generated by older instruments and therefore may be more acceptable to patients. Although differences between the mean values obtained with all 3 assessments are clinically insignificant, relatively wide limits of agreement (approximately ±0.50D) would, in our assessment, preclude prescribing spectacles directly from either the AR or OPD measurement. However, the limits of agreement between SR and either AR or OPD were at least as close as those reported for measures of repeated SR (either performed by the same person on multiple occasions or by 2 different observers). This suggests that it may be acceptable to prescribe autorefractor results directly if a review of objective refractive data is consistent with other data used in the determination of a spectacle prescription (patient's subjective assessment of vision, habitual spectacle prescription, and visual acuity through the habitual prescription).
Aberrometry may eventually change the way we measure and correct optical aberrations in the human eye; Thibos et al.27 suggested that it may eventually become the new standard for optimal correction of refractive error. Aberrometry can provide a tremendous amount of data on total aberration in the eye but appears to be no more accurate than autorefraction in its calculation of a spherocylindrical spectacle prescription. Currently, we can map refractive error on the basis of evaluation of higher-order aberration,28 but translation of this measurement into refractive correction has proved challenging. Although higher-order aberrations can be at least partially corrected in refractive surgery, methods to incorporate the personalized correction of higher-order aberrations into spectacle or contact lenses are still in early stages of development. Spectacle lenses currently marketed as having “digital” or “high-definition” optics do not use patients’ higher-order aberration maps to create truly customized lenses. Studies have examined some of the requirements for contact lens correction of higher-order aberrations,29 but such custom contact lenses currently are not commercially available. Scleral lenses may eventually provide an ideal platform for incorporation of aberrometry results into a refractive device; the lenses tend to be rotationally very stable and are made of rigid gas-permeable materials that can be lathed with great precision.30 As lens manufacturing technology evolves, it may be possible to use all of the data from wavefront analyzers to create lenses that truly provide outstanding visual clarity.
Both aberrometry and autorefraction can provide, at the very least, a reasonable starting point for SR. Although our AR and OPD results, in general, showed a high level of agreement with SR, the limits of agreement observed with both methods of automated data collection do not allow us to recommend prescribing spectacles directly from either the aberrometry or the autorefraction measurement without considering other refractive data. However, for cases in which data provided by these instruments are consistent with other information regarding a patient's refractive error, prescribing directly from a single AR or OPD measurement could eliminate the need for manual refraction in a healthy population with optimal vision.
Conflict of interestThe authors have no conflicts of interest to declare.
The study design was approved by our institutional review board, and all patients provided informed consent. This work was supported in part by Research to Prevent Blindness, New York, NY, through an unrestricted grant to the Department of Ophthalmology, Mayo Clinic.


www.publicationethics.org.


