


Individuals with attention-deficit/hyperactivity disorder (ADHD) are reported to manifest visual problems (including ophthalmological and color perception, particularly for blue–yellow stimuli), but findings are inconsistent. Accordingly, this study investigated visual function and color perception in adolescents with ADHD using color Visual Evoked Potentials (cVEP), which provides an objective measure of color perception.
MethodThirty-one adolescents (aged 13–18), 16 with a confirmed diagnosis of ADHD, and 15 healthy peers, matched for age, gender, and IQ participated in the study. All underwent an ophthalmological exam, as well as electrophysiological testing color Visual Evoked Potentials (cVEP), which measured the latency and amplitude of the neural P1 response to chromatic (blue–yellow, red–green) and achromatic stimuli.
ResultNo intergroup differences were found in the ophthalmological exam. However, significantly larger P1 amplitude was found for blue and yellow stimuli, but not red/green or achromatic stimuli, in the ADHD group (particularly in the medicated group) compared to controls.
ConclusionLarger amplitude in the P1 component for blue–yellow in the ADHD group compared to controls may account for the lack of difference in color perception tasks. We speculate that the larger amplitude for blue–yellow stimuli in early sensory processing (P1) might reflect a compensatory strategy for underlying problems including compromised retinal input of s-cones due to hypo-dopaminergic tone.
Se ha reportado que las personas con trastorno de déficit de atención e hiperactividad (TDAH) manifiestan problemas visuales (incluyendo oftalmológicos y de color, particularmente para estímulos azul-amarillo), aunque los hallazgos son inconsistentes. El presente estudio investigó la función visual y la percepción del color en adolescentes con TDAH, utilizando potenciales evocados visuales (PEV), que aportan una medición objetiva de la percepción del color.
MétodosParticiparon en el estudio treinta y un adolescentes (de edades comprendidas entre 13 y 18 años): 16 con diagnóstico confirmado de TDAH y 15 individuos sanos, equiparados por edad, sexo e IQ. Todos ellos fueron sometidos a examen oftalmológico y a pruebas electrofisiológicas de PEV, que midieron la latencia y amplitud de la respuesta neuronal P1 a los estímulos cromáticos (azul-amarillo, rojo-verde) y acromáticos.
ResultadosNo se hallaron diferencias entre los grupos en el examen oftalmológico. Sin embargo, se halló una amplitud significativamente mayor de P1 para los estímulos azul-amarillo, aunque no para los estímulos rojo/verde o acromáticos, en el grupo de TDAH (particularmente en el grupo medicado), en comparación a los controles.
ConclusiónLa mayor amplitud en el componente P1 para azul-amarillo del grupo TDAH, en comparación a los controles, podría explicar la falta de diferencia en las tareas de percepción del color. Suponemos que la mayor amplitud para los estímulos azul-amarillo en el proceso sensorial temprano (P1) podría reflejar una estrategia compensatoria para los problemas subyacentes, incluyendo el input retiniano comprometido de los conos S debido al tono hipo-dopaminérgico.
Attention-deficit/hyperactivity disorder (ADHD) is one of the most frequently diagnosed childhood psychiatric disorders, with worldwide prevalence rates estimated at 5.3%.1 However, despite the long history of research since its first medical description in 1775,2 to date, it remains unclear what are the ‘deficits’ in ADHD. Current theories posit that executive function deficits account for ADHD symptoms. However, according to a substantial number of studies, ADHD is also associated with visual perceptual problems that cannot be explained by executive dysfunction (appendix A). ADHD is a neuro-developmental disorder which is associated with delayed cortical maturation in many regions, including the occipital cortex.3,4 Specifically, color perception has been reported to be altered in ADHD population (appendix B). For instance, in our previous study, young adults with ADHD reported significantly more self-perceived visual difficulties in everyday tasks as well as poorer hue discrimination specifically for blue stimuli.5 Furthermore, children with ADHD have been found to score poorly on clinical tests of blue–yellow color perception, but not red–green,6,7 and showed decreased game performance in a virtual environment when important on-screen information was displayed predominantly in blue–yellow colors compared to performance with information displayed in red–green colors.8 Finally, several studies report decreased speed in color processing in the ADHD population.9,10 The possibility of color perception problems in ADHD is of clinical importance, given the extensive use of color in educational settings, as well as the frequent use of color stimuli in many of the standard neuropsychological tests used in the assessment for ADHD and related disorders (e.g. Color-Word Stroop Test, Wisconsin Card Sorting Test, A Quick Test of Cognitive Speed, Rapid Automatized Naming).
Color vision mechanisms, particularly the short-wavelength pathway, are particularly vulnerable to insult from toxins, and highly sensitive to CNS drugs and the neurotransmitter, such as dopamine. Accordingly, the “retinal dopaminergic” hypothesis of color vision11 proposes that the dopamine deficiency in central nervous system (CNS) in ADHD population may induce a hypo-dopaminergic tone in the retina, which in turn would have deleterious effects on short-wavelength (S) cones. S-cones are sensitive to blue–yellow light wavelengths and to dopamine (as well as other neurochemical agents), and relatively scarce in number. Thus, the purported low dopaminergic tone in ADHD may have a specific effect on blue color perception. To our knowledge, so far, testing this hypothesis in the ADHD population has solely relied on clinical tests of color perception. Clinical vision tests have been criticized for their requirements for sustained attention and motor coordination, which are known to be impaired in ADHD.12,13 Also these tests do not inform about mechanisms underlying poor performance on B–Y stimuli. In addition, most of these studies have focused on children with ADHD.5–7
Accordingly, this pilot study is aimed to explore the B–Y color mechanism in an extended population (adolescents with ADHD) using an electrophysiological technique (color visual-evoked potential; cVEP). cVEP provides a noninvasive, sensitive and objective measure of chromatic input in visual pathways.14 Participants are directed to stare at the stimuli that alternate between ‘on’ (100ms) and ‘off’ (400ms) while brain waves are measured in the occipital cortex. cVEP is suitable for individuals with ADHD, since it is a purely perceptual task in which the stimuli are presented very briefly, and does not require executive function, sustained or selective attention, or motoric response. To our knowledge, no previous studies examined color perception processing using cVEP in ADHD population. However, children with learning disability have been reported to show less alpha attenuation using parieto-occipital EEGs, suggesting that attention problems may influence learning disability.15 Poor readers have also been found to manifest significantly lower thresholds/higher sensitivity for B–Y stimuli than normal readers.16 By contrast, based on visual pattern electroretinograms, adults with ADHD were not found to show a significantly larger contrast gain than control group,17 nor were any latency differences (N75, P100, N145) found for children with ADHD using pattern reversal evoked potential.18
In this study, we measured the neural response (P1) to chromatic and achromatic stimuli, thereby providing a more direct assay of color processing in this population. The P1 component of the cVEP (peak latency 136–146ms) is an early response to the visual stimuli and it is mainly generated from the dorsal extrastriate cortex where color processing is localized.19–22 In addition, we conducted an ophthalmological exam (e.g., visual acuity, refraction, fundus exam) to test general visual functions in ADHD. We hypothesized that the adolescents with ADHD would show normal visual function on ophthalmological exam, but altered B–Y color vision as indexed by both latency and amplitude of P1. Specifically, we expected ADHD group to show deficient neural activity in response to B–Y stimuli shown as decreased amplitude and prolonged latency of P1 compared to control group.
MethodsParticipantsA total of 31 adolescents, aged 13–18 years, participated; 16 (81% male, mean age: 16) with a confirmed DSM-IV39 diagnosis of ADHD (described below) and 15 (67% male, mean age: 15) healthy controls matched for age, sex, and IQ. No significant differences were found in age and sex between the groups. Adolescents with confirmed ADHD diagnosis were recruited from a larger-scale study on working memory (Canadian Institutes of Health Research operating grant # 11398); those in the comparison group were recruited through notices posted in the research setting (a large pediatric hospital in an urban area). All adolescents participating in the study were native English speakers. Adolescents were excluded if mothers reported a history of major perinatal complications such as prematurity, low birth weight, any history or current presentation of psychosis, comorbid Tourette syndrome, phenylketonuria, autism, or other pervasive developmental disorders. Also adolescents were excluded if they had a history or current use of cocaine or other substances, or had below average intellectual functioning (defined as a standard score of at least 80 on either the Verbal or Performance Scale of the WISC-III). We chose to study adolescents, because they would be able to understand and comply with the cVEP requirements.
The DSM-IV diagnosis of ADHD had been confirmed by a systematic and comprehensive clinical diagnostic assessment conducted within the past one to 2 years, as a part of the larger scale study. Assessment consisted of a semi-structured clinical diagnostic interview [Schedule for Affective Disorders and Schizophrenia for School-Age Children-Present and Lifetime Version; K-SADS-PL23], as well as the Conners’ Rating Scales-Revised,24 completed by parents and teachers. The K-SADS had been conducted separately with the adolescent and parent, and the clinician summarized the information from both informants. Diagnosis of ADHD in adolescents had been based on the following algorithm: (1) met DSM-IV criteria according to the clinician summary based on the K-SADS-PL interviews; and (2) met the clinical cut-offs for inattentive or hyperactive/impulsive symptoms on the Conners’ teacher questionnaires (t-score>70) to confirm pervasiveness of symptoms across settings.
For the current study, parents of all participants were asked to complete the Strengths and Weaknesses of ADHD-symptoms and Normal Behavior Scale (SWAN25), using a 7-point likert scale for each item (score of ‘1’ indicating the child's abilities were far below those of peers; score of ‘7’ indicating abilities far above those of peers) to index current symptomatology. Total scores for inattention and hyperactivity/impulsivity were computed, with lower scores indicating more problems. Also, parents as well as teachers completed the Strengths and Difficulties Questionnaire (SDQ26) to obtain standardized ratings of current behavior. Adolescents in the comparison group who had any scores in the clinical range were excluded. Informed consent from the participating adolescents and their parents was obtained before the test.
Participants with ADHD who were being treated with stimulant medication (n=7; 35% of the sample) were requested to stop any stimulant medication for at least 24h prior to the study. However, since we had no reliable method for confirming that participants had indeed ceased their treatment for more than 24h, we opted to classify participants with ADHD into two groups: those with and without current medication treatment.
This study was approved by our institutional Research Ethics Board (The Hospital for Sick Children: REB file #1000003973); all participants (adolescents, parents) provided written informed consent prior to commencing the study.
MeasuresOphthalmological exam: a comprehensive vision exam, conducted under specified lighting conditions by a trained ophthalmologist, included the following measures:
- -
Contrast sensitivity27: Contrast sensitivity was measured by the Pelli-Robson Contrast Sensitivity Test, which provides a quick, reliable and widely accepted method used in clinical setting. Higher scores indicate better contrast sensitivity (i.e. can discriminate fainter letters better on a white chart). The highest possible score is 2.25.
- -
Visual acuity (Vistech Consultants, Inc. Dayton, USA): It was measured with the log MAR crowded test. Lower scores indicate better visual acuity/resolution. Lowest score is −0.3.
- -
Refraction28: It was measured using a near retinoscopy technique. Spherical correction and cylindrical correction are reported for left, right, and both eyes. Since uncorrected refractive error might confound the results, adolescents with uncorrected refractive error greater than 3.00 diopters spherical correction or 1.50 diopters cylindrical correction were excluded from the study.
- -
Fundus exam: A basic fundus examination was carried out with the ophthalmoscope to determine the ocular media, posterior pole and macular area of the retina.
Color Visual Evoked Potentials (cVEP; NeuroScan Acquire 4.0 program): cVEP is an objective, non-invasive technique that particularly reflects cone activity in the central 6–10 degrees in the retina.29 It permits recording of an occipital lobe brain wave in response to visual stimulation that begins in the retina and ends at the visual cortex.30 In the current study, three types of stimuli were used. The first, the achromatic grating was a white-gray luminance stimulus to verify that meaningful VEP signals could be collected. The second was an isoluminant grating for long and medium wavelength color mechanisms (red–green). The third type was an isoluminant S-grating specific for S-cone activation-deactivation (blue–yellow). Achromatic and chromatic stimuli were presented in a patterned onset-offset presentation. This means that the stimulus alternated between “on” (for 100ms) and “off” (for 400ms) at a repeated rate of 2Hz, until 60 sweeps were collected. The time of luminance presentation consistently occurred between chromatic stimuli so as not to saturate the color vision system.
Stimulus parameters were selected to optimize the chromatic response and differentiate between the chromatic and achromatic VEP response (see Elia et al.31 for the details). Chromatic and achromatic stimuli were produced using Vision Research Graphics (VRG) software (Durhan, NH). Specifically, the red–green color grating consisted of vertical bars varying from red to green with respective chromaticity coordinates of x=0.3574, y=0.3099 and x=0.3064, y=0.3372. The violet to yellow–green grating consisted of alternating violet (x=0.2893, y=0.2496) and yellow–green (x=0.3409, y=0.3523) bars. Each of the color stimuli pairs: red and green or blue or yellow were isoluminant. This was to ensure that the cortical responses being recorded arose predominantly from color selective cortical cells and not from luminance-responsive cells.32 These stimuli were presented on a 21-inch RGB color graphics monitor (FlexScan f930; Eizo, Cypress, CA) with 26°×20° field dimensions. Previous research has demonstrated good test–retest reliability using this large stimulus display with the NeuroScan Aquire 4.0 Program.33
We positioned 6-mm diameter gold disk electrodes (Genuine F-F5GH; Grass Instrument Division, Astro-Med, Inc., West Warwick, RI) with protected terminals (Safelead; Grass) on the scalp, as stated in the international 10–20 system of electrode placement, on the visual occipital cortex in positions Oz, O1, and O2 along with two additional electrodes on nonvisual areas of the cortex at Pz (ground) and Cz (reference), to obtain cortical responses to color stimuli. The Scalp-electrode impedance was measured after all electrodes are applied to ensure that the impedance was less than or equal to 10kΩ. Color VEPs were recorded at a viewing distance of 75cm. Each participant was tested binocularly. A fixation target (central dot) was presented to maintain participants’ visual attention. Also, a tester, who was positioned behind the computer, monitored participant's eye gaze and was responsible for starting and stopping the trial if the participant became tired and lost fixation on the stimulus. The trial was restarted once the participant had re-established his/her gaze on the stimulus.
For VEP data analysis, waveforms were recorded for achromatic, L-M and S patterns. Sixty presentations were acquired and averaged for each stimulus, which was presented twice. Thus, a total of 120 presentations per each condition were recorded. We measured both VEP latency as well as amplitude. Since latency of VEP waveform generated by chromatic stimuli (both red–green and blue–yellow) is typically negative wave, in adults,34 the latency of chromatic onset-offset VEP data was measured from pattern onset to the first negative component. Peak amplitudes were measured from the trough of the first negative wave to the peak of the preceding positive wave for wave generated by chromatic stimuli (Fig. 1 shows an example for a male participant in this study). The VEP system (NeuroScan Acquire 4.0 program) acquired averaged VEP data from the Synamps amplifier system (NeuroScan, Herdon, Virginia). The sampling frequency was 1000Hz. The noise level was 2μV peak to peak. The artifact reject was set to±100μV, thus, artifacts from non-visual sources such as muscle artifact (i.e. eye blink) would be eliminated.
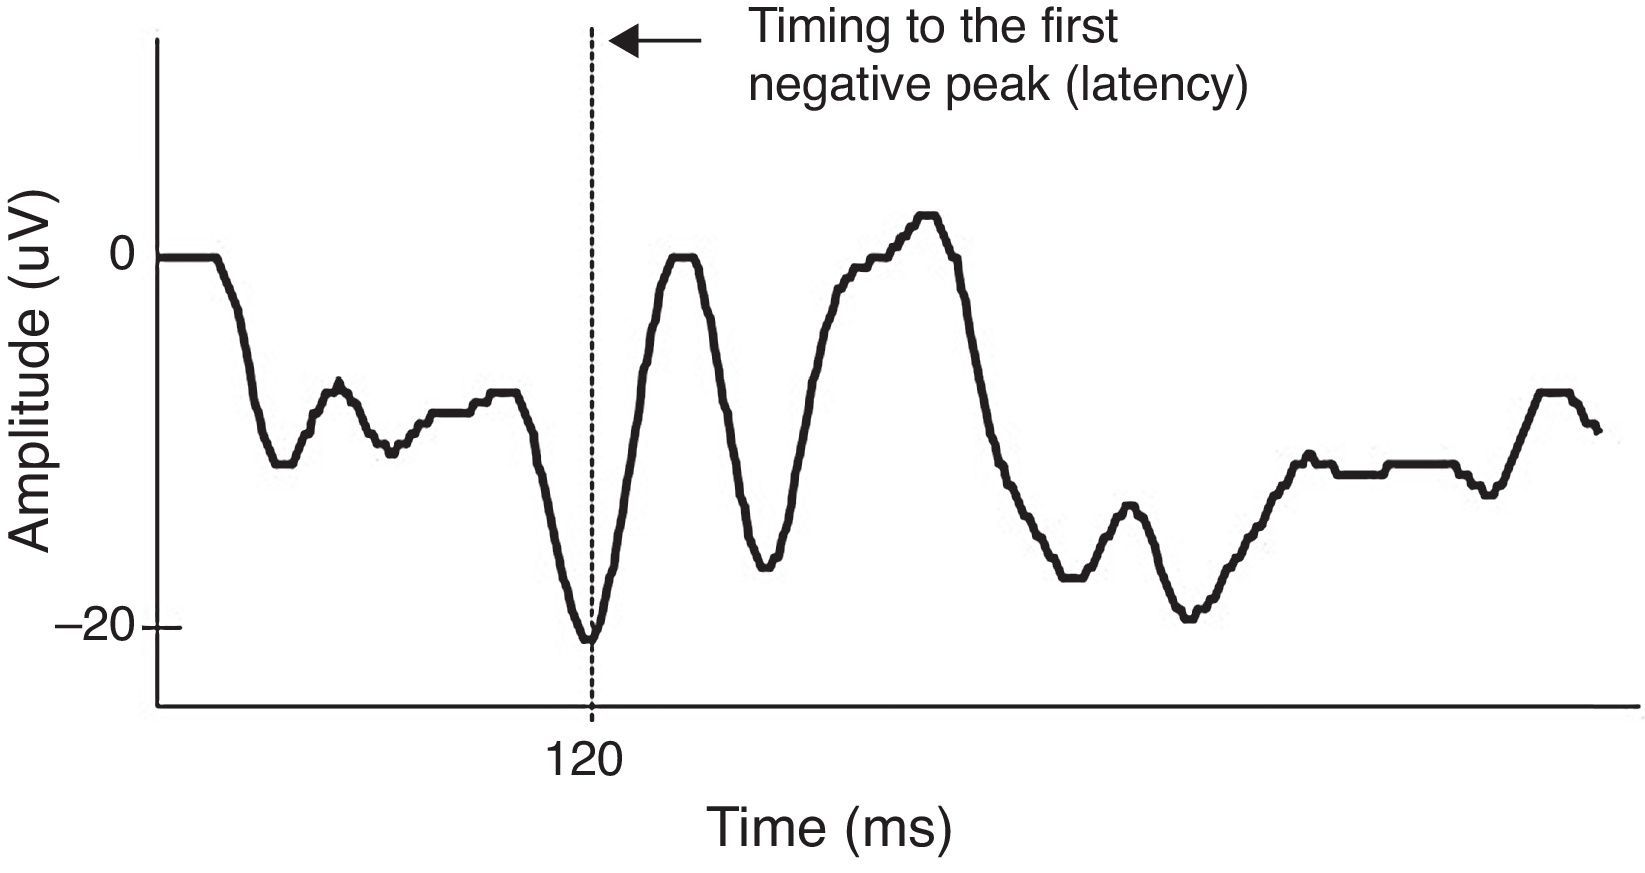
A color VEP data of a participant from blue–yellow (S-cone onset) stimuli. Latency (time of response to stimulus) for S response onset is measured from pattern onset (time of stimulus presentation) to the trough of the first large negative wave. Amplitudes of the waveforms were measured from the trough of the first negative wave to the peak of the positive wave.
Data points (behavioral and ERP) with SD's >3 were regarded as outliers and adjusted using a winsorizing technique.35 This was applied to a total of seven data points: one data point from Left Acuity, Left contrast sensitivity, right spherical correction, Left cylindrical correction, Right cylindrical correction, and 2 data points from red–green latency. Also, 3 control participants were excluded from VEP tests due to weak VEP signals and very low motivations (observed tiredness, boredom and lack of sleep). We used both relatives (difference in luminance to chromatic data) to control for inter-individual variability and also absolute values to analyze amplitude and latency. Planned orthogonal contrast analyses were used to test the hypothesized group differences in color perception and other visual functions. We first compared the ADHD and control groups, and then the medicated versus non-medicated ADHD subgroups. Effect sizes (ES) were calculated using Cohen's d.36 Conventionally, Cohen's d ranging 0.2–.03 is considered to be a small effect size, 0.5 as medium and 0.8 as large, respectively. No Bonferroni correction for multiple comparisons was applied since this was a pilot study and not adequately powered for repeated measures ANOVA.
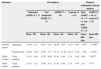
ResultsSample characteristics and performance on vision measures are summarized in Tables 1 and 2, respectively. As expected, adolescents with ADHD showed significantly more inattentive [t(27)=−6.627, p=0.000] and hyperactivity symptoms [t(27)=−2.990, p=0.006] than control adolescents based on parent's report on SWAN. Furthermore, the medicated ADHD subgroup tended to show more inattentive symptoms than non-medicated ADHD subgroup, (trend level difference), suggesting that medicated subgroup may present more severe ADHD symptoms (Table 1). Also, ADHD group showed significantly more overall difficulties in school [t(27)=−4.233, p=0.000] as well as in home settings [t(27)=3.304, p=0.003].
ADHD symptoms for ADHD and control group.
| Measures | Descriptives | Planned orthogonal contrast analysis | |||||||||
|---|---|---|---|---|---|---|---|---|---|---|---|
| Medicated ADHD (N=7) | Non medicated ADHD (N=9) | ADHD (N=16) | Controls (N=15) | Med. ADHD (N=7) vs. non med. ADHD (N=9) | ADHD (N=16) vs. control (N=15) | ||||||
| Mean | SD | Mean | SD | Mean | SD | Mean | SD | Mean diff. (sig.) | Mean diff. (sig.) | ||
| SWAN-parent | Inattention | 23.00 | 8.15 | 28.67 | 6.02 | 26.40 | 7.26 | 44.27 | 8.07 | −5.67* | −17.87*** |
| Hyperactivity | 32.00 | 15.32 | 35.56 | 9.77 | 34.13 | 11.90 | 45.73 | 9.38 | −3.56 | −11.60** | |
| SDQ-teacher | Total problem | 15.14 | 6.04 | 15.22 | 6.08 | 15.19 | 5.86 | 7.33 | 4.02 | 0.08 | 7.86*** |
| SDQ-parent | Total problem | 13.33 | 7.23 | 11.00 | 4.21 | 11.93 | 5.50 | 5.73 | 4.99 | 2.33 | 6.2** |
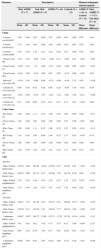
Summary scores on vision Table 1.
| Measures | Descriptives | Planned orthogonal contrast analysis | ||||||||
|---|---|---|---|---|---|---|---|---|---|---|
| Med. ADHD (N=7) | Non Med. ADHD (N=9) | ADHD (N=16) | Controls (N=12) | ADHD (N=16) vs. Control (N=12) | Med. ADHD (N=7) Vs. Non Med. (N=8) | |||||
| Mean | SD | Mean | SD | Mean | SD | Mean | SD | Mean difference | Mean difference | |
| Vision | ||||||||||
| Contrast sensitivity(R) | 1.69 | 0.08 | 1.65 | 0.09 | 1.67 | 0.09 | 1.64 | 0.06 | 0.03 | 0.04 |
| Contrast sensitivity(L) | 1.70 | 0.10 | 1.66 | 0.09 | 1.68 | 0.09 | 1.66 | 0.07 | 0.03 | 0.04 |
| Contrast sensitivity(Bi) | 1.85 | 0.10 | 1.79 | 0.11 | 1.82 | 0.10 | 1.81 | 0.09 | 0.01 | 0.06 |
| Visual Acuity (R) | −0.11 | 0.10 | −0.08 | 0.16 | −0.09 | 0.13 | −0.04 | 0.15 | −0.05 | −0.03 |
| Visual Acuity (L) | −0.09 | 0.10 | −.12 | 0.09 | −0.11 | 0.09 | −0.09 | 0.08 | −0.02 | −0.03 |
| Visual Acuity (Bi) | −0.16 | 0.05 | −0.18 | 0.08 | 0.07 | 0.02 | −0.15 | 0.08 | −0.02 | 0.02 |
| Spherical correction (R) | −0.38 | 1.05 | −0.09 | 0.94 | −0.21 | 0.96 | −0.16 | 1.32 | 0.05 | −0.29 |
| Cylindrical correction (R) | 0.08 | 0.20 | 0.03 | 0.28 | 0.05 | 0.24 | −0.07 | 1.04 | −0.02 | 0.05 |
| Spherical correction (L) | −0.25 | 0.88 | −0.19 | 1.67 | −0.21 | 1.34 | −0.01 | 1.60 | −0.21 | −0.06 |
| Cylindrical correction (L) | 0.17 | 0.26 | 0.09 | 0.19 | 0.13 | 0.21 | 0.17 | 0.41 | −0.04 | 0.08 |
| Color vision | ||||||||||
| Red Tritan (L) | 1.00 | 0.00 | 1.11 | 0.33 | 1.06 | 0.25 | 1.00 | 0.00 | 0.06 | −0.11 |
| Green Tritan (L) | 1.00 | 0.00 | 1.00 | 0.00 | 1.00 | 0.00 | 1.07 | 0.26 | −0.07 | 0.00 |
| Blue Tritan (L) | 1.00 | 0.00 | 1.11 | 0.33 | 1.06 | 0.25 | 1.07 | 0.26 | −0.01 | −0.11 |
| Red Tritan (R) | 1.14 | 0.38 | 1.00 | 0.00 | 1.06 | 0.25 | 1.13 | 0.35 | −0.05 | 0.14 |
| Green Tritan (R) | 1.00 | 0.00 | 1.00 | 0.00 | 1.00 | 0.00 | 1.00 | 0.00 | 0.00 | 0.00 |
| Blue Tritan (R) | 1.29 | 0.49 | 1.22 | 0.44 | 1.25 | 0.45 | 1.13 | 0.35 | 0.12 | 0.07 |
| VEP | ||||||||||
| Relative | ||||||||||
| Blue–Yellow latency(ms) | 145.54 | 4.66 | 149.56 | 10.20 | 147.80 | 8.27 | 152.42 | 9.22 | −4.62 | −4.02 |
| Red–Green latency (ms) | 140.55 | 9.08 | 143.13 | 6.17 | 142.00 | 7.42 | 141.36 | 6.30 | 0.64 | −2.58 |
| Blue–Yellow amplitude(μV) | 1.78 | 0.35 | 1.44 | 0.24 | 1.59 | 0.33 | 1.34 | 0.32 | 0.25* | 0.34* |
| Red–Green amplitude (μV) | 1.70 | 0.45 | 1.88 | 0.43 | 1.81 | 0.43 | 1.76 | 0.49 | 0.05 | −0.18 |
| Absolute | ||||||||||
| Blue–Yellow latency (ms) | 148.21 | 7.72 | 147.26 | 8.97 | 147.74 | 8.35 | 148.68 | 10.17 | −0.94 | −0.95 |
| Red–Green latency (ms) | 139.76 | 8.13 | 139.19 | 7.41 | 139.48 | 7.77 | 140.15 | 7.64 | −0.96 | −0.57 |
| Luminance latency (ms) | 149.87 | 10.87 | 144.77 | 12.69 | 147.32 | 11.78 | 147.81 | 10.14 | −0.49 | −5.11 |
| Blue–Yellow amplitude(μV) | 7.81 | 5.02 | 3.62 | 3.02 | 5.72 | 5.37 | 6.32 | 5.94 | −0.60 | 2.12* |
| Red–Green amplitude (μV) | 9.96 | 6.32 | 6.78 | 7.03 | 8.37 | 6.67 | 10.53 | 8.41 | −2.16 | 3.18 |
| Luminance amplitude (μV) | 10.89 | 5.85 | 9.95 | 5.93 | 10.42 | 5.89 | 13.33 | 8.20 | −2.91 | −0.94 |
(1) R: Right eye only, (2) L: Left eye only, (3) Bi: Binocular vision.
There were no group differences in general vision based on the ophthalmological tests including visual acuity, contrast sensitivity, and refraction. Clinical notes on the fundus exam suggested that the fundus was within normal limits for virtually all participants except 1 participant in each ADHD and Control group (see appendix C for detail).
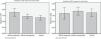
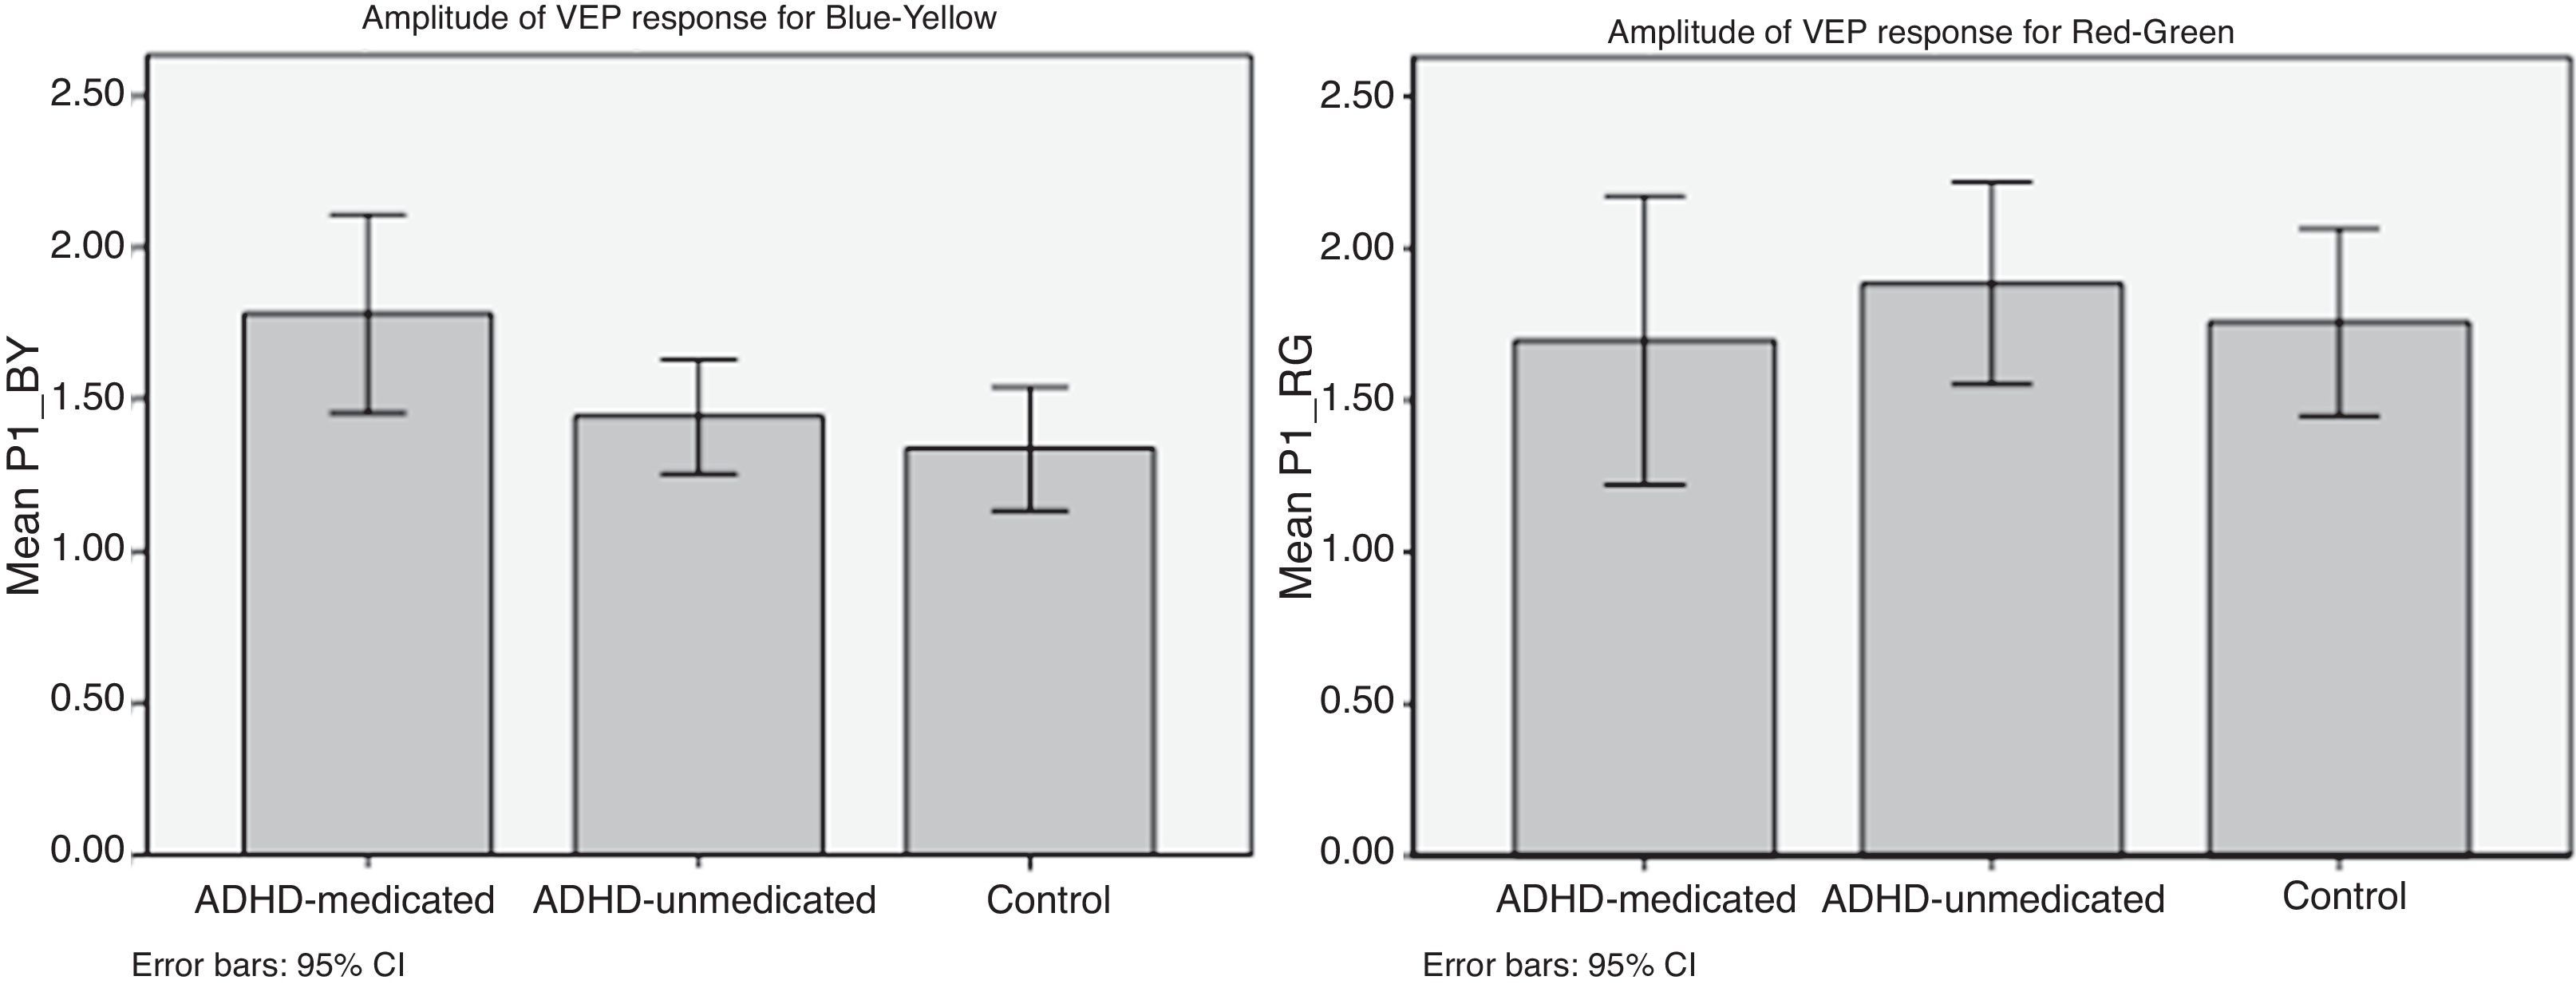
On VEP measures, using relative values, no significant group differences were found for the P1 latency, but the ADHD group (both medicated and non-medicated participants) showed significantly larger P1 amplitude in response to blue–yellow stimuli than did the comparison group [t(25)=2.35, p<0.05; Cohen's d=0.80, see Fig. 2], but the groups did not differ in either latency or amplitude in terms of the P1 response to red–green stimuli [t(24)=0.183, p=0.86; Cohen's d=0.11]. The group differences in P1 amplitude in response to blue–yellow stimuli appear to be driven primarily by the ‘medicated’ ADHD group, since their P1 amplitude was significantly larger compared to that of the non-medicated subgroup [t(25)=2.18, p<0.05; Cohen's d=0.77]. Similarly, using absolute values, the ‘medicated’ ADHD group showed significantly larger P1 amplitude for blue and yellow stimuli compared to the non-medicated ADHD group [t (46)=4.19, p<0.05; Cohen's d=1.01], but did not differ in latency [t(46)=−0.267, p=0.791; Cohen's d=0.11]. However, the ADHD group overall did not differ from controls in either amplitude or latency of response to blue–yellow and red–green stimuli (see Table 2). Moreover, the ADHD subgroups did not differ in either latency [t(46)=−0.189, p=0.765; Cohen's d=0.08] or amplitude [t(46)=1.09, p=0.28; Cohen's d=0.47] in terms of the P1 response to red–green stimuli.
Additional analysis was conducted using achromatic stimuli (luminance), although these stimuli were used primarily as an experimental control condition designed to prevent saturation of the color vision system. No significant intergroup differences were found in amplitude or latency for achromatic stimuli (see Table 2).
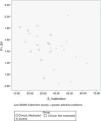
Inattentive symptoms from parent ratings on the SWAN correlated significantly with P1 amplitude in response to B–Y stimuli [r(27)=−0.386, p=0.046] but not for R–G stimuli [r(27)=−0.195, p=0.330], indicating that more severe inattention was related to greater P1 amplitude for B–Y (see scatter plot in Fig. 3). By contrast, there was no significant relationship between hyperactivity/impulsivity scores and the P1 amplitude for either B–Y [r(27)=−0.286, p=0.146 or R–G stimuli [r(27)=−0.132, p=0.495].
Discussion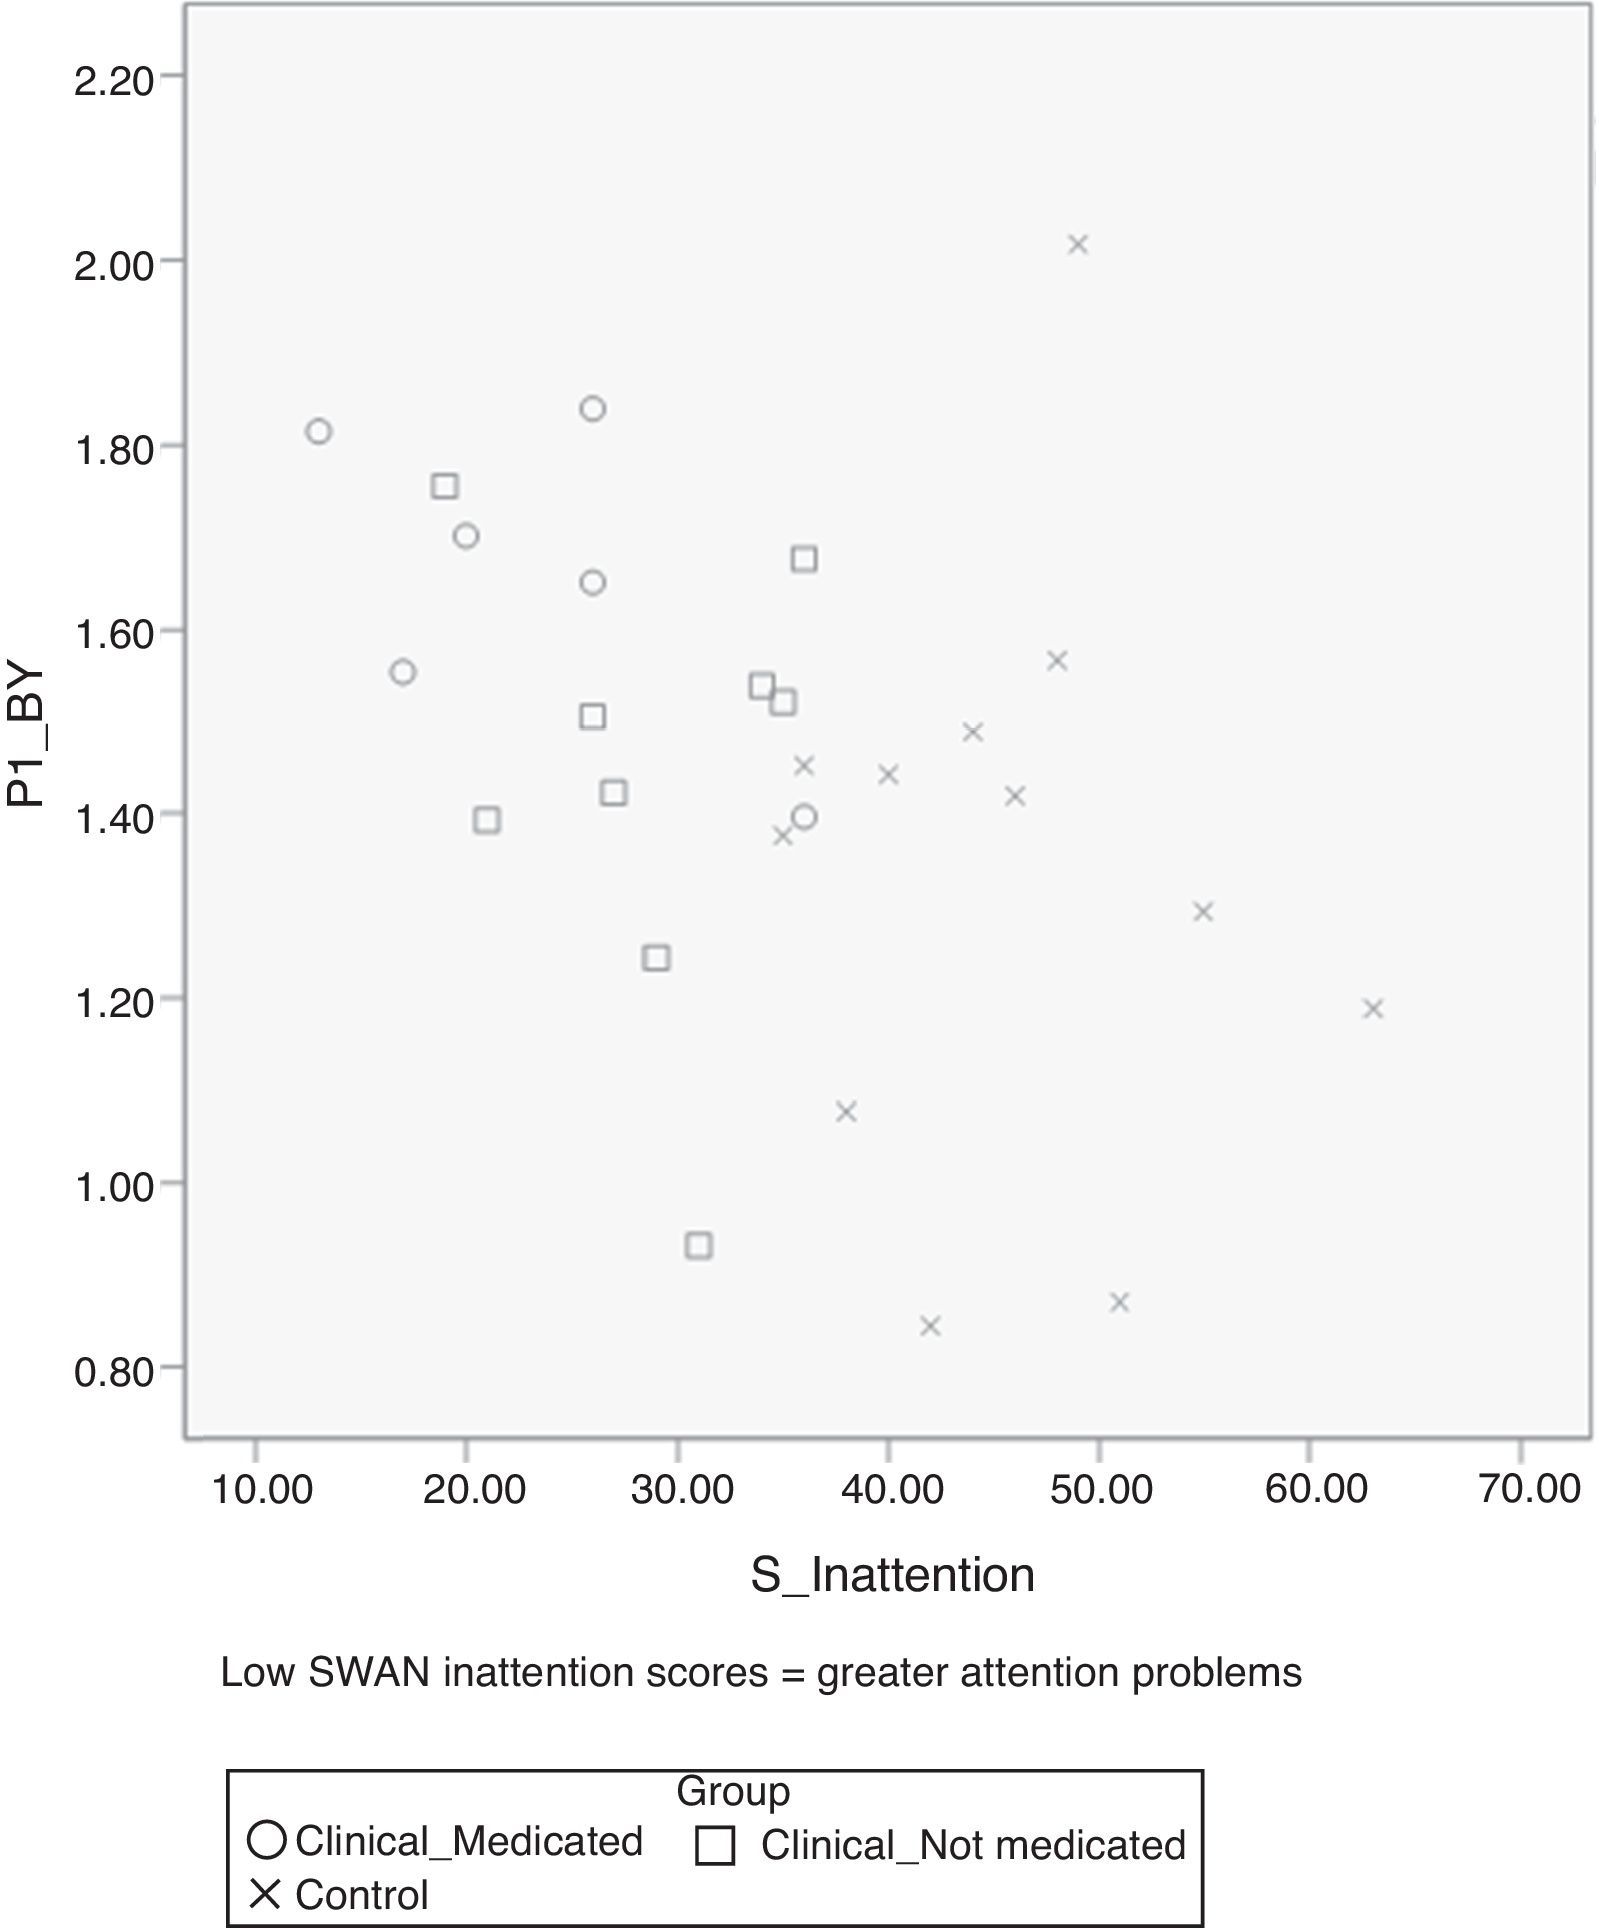
This study represents the first attempt to use cVEP to assay color perception in an ADHD sample. Moreover, we conducted ophthalmological testing to allow us to disaggregate color perception problems from problems in vision. The major findings in this pilot study were that: (1) the ADHD group (particularly the ‘medicated’ group) showed a much larger P1 amplitude in response to blue–yellow stimuli than did the comparison group, but did not differ in terms of the P1 latency; (2) there were no intergroup differences in the P1 amplitude or latency in response to red–green or achromatic stimuli; (3) inattention significantly correlated with the P1 amplitude, only for B–Y stimuli; and (4) there was no evidence in ophthalmological problems in the ADHD group based on the clinical measures.
The present study yielded several novel findings, including evidence of greater amplitude in the P1 component of the neural response to B–Y chromatic stimuli in the ADHD group, together with a significant positive relationship between severity of inattention symptoms and the P1 amplitude for B–Y stimuli. The magnitude of this group difference in P1 amplitude was notably larger for blue–yellow chromatic stimuli compared to that for red–green stimuli (e.g., Cohen's d for B–Y was 0.80; and for R–G was 0.11). This finding is in line with a previous finding that found hypersensitivity for the blue/yellow stimuli in children with reading disabilities.16 Although the intergroup difference in the P1 amplitude for B–Y stimuli appears to be driven primarily by the adolescents with ADHD who were being treated with stimulant medication, there are several reasons why we do not believe that this intergroup difference can be attributed to the effects of stimulant medication per se. First, P1 amplitude correlated positively with the SWAN inattention scores (see Fig. 3) and the medicated ADHD subgroup showed higher SWAN inattention scores than the non-medicated ADHD group albeit non-significantly (see Table 1), which may suggest that medicated ADHD group manifest more severe ADHD symptoms that required treatment with medication. Second, participants in the ‘medicated’ group had been asked to stop their medication for at least 24h before the test session and indicated that they had done so, although we were unable to confirm this was the case. Thus, we believe that our findings indicate that the ADHD group – particularly those with more severe inattentive symptoms – manifest greater P1 amplitude for B–Y stimuli than controls, but do not differ in P1 latency or amplitude for R–G stimuli. This interpretation is further supported by the specific and positive correlation between the severity of inattention and P1 amplitude for B–Y stimuli.
Evidence of greater amplitude in P1 in response to blue–yellow chromatic stimuli in the adolescents with ADHD suggests a greater involvement of their ventral extrastriate cortex of the fusiform gyrus.20 Based on the various brain imaging and cellular level studies that suggest that color perception and processing is localized in the extrastrate area,21,22 we can assume that adolescents with ADHD are challenged in processing color information, hence require greater activation in the area. The larger P1 amplitude for blue–yellow stimuli might be understood as a compensation mechanism for a color deficiency that ADHD adolescents developed over time. In other words, it might be a way of compensating for problems at the receptor level such as relatively scarce number of short wavelength sensitive cones and vulnerability due to low dopamine.37 Cortical maturation in ADHD population is delayed compared to healthy children.3
We acknowledge the limitations of this pilot study, which need to be taken into account when interpreting the findings. Sample sizes were small particularly for the comparison of the two ADHD subgroups, which limits the generalizability of the findings and necessitates their replication in larger samples. Furthermore, we acknowledge that high level of inter-subject variability in VEP measure has been reported,38 and that repeatability of the VEP responses was not tested, which weakens our findings for P1 amplitude. However, a previous study using the same VEP system and method reported good repeatability of test results.33 Also, in this pilot study, we were not able to disentangle the effects of medication and severity of ADHD symptoms (according to the SWAN scores). Although we were able to confirm which participants were being treated with medication, we were unable to confirm whether they had stopped medication at least 24h prior to the study as requested. Moreover, we acknowledge that this duration of washout may not be sufficient to eliminate any residual central (or retinal) effects of medication. We attempted to deal with the possible confound of medication by comparing those who were and were not being treated with medication. We believe that observed differences in the P1 response to B–Y stimuli in the two ADHD groups may not be attributable to the effects of medication, because it is quite possible that those receiving medication differ in a systematic way from those not receiving mediation (i.e. more severe ADHD symptoms). Also, it is possible that the VEP latency and amplitude measured in the occipital lobe may not capture the impairment at a receptor level caused by hypo-dopaminergic condition in ADHD group. For instance, use of a clinical electroretinogram technique, a tool to detect and quantify central cone function, especially in disease stages with no or subtle visible retinal changes, might be an option. That approach would provide direct observation of the effect of low dopamine condition in the retina, particularly to blue and yellow cones.
Despite the limitations, we believe our preliminary findings are provocative and provide a basis for future investigations on this topic. Future studies should include different age groups and more precise and effective tests to assess neural and behavioral components of color perception, and investigate the effects of attention on color perception of B–Y versus R–G chromatic stimuli.
Conflicts of interestMs. Kim has no conflicts of interest to declare. Dr. Tannock was a member of the DSM-5 Work Group on ADHD and externalizing disorders as well as a liaison member to the DSM-5 Neurodevelopmental Disorders Work Group, and has received speaker fees for unrestricted scientific talks, consultancy, from Eli Lilly, Purdue, and Shire in the past 3 years. Dr. Banachewski has served in an advisory or consultancy role for Hexal Pharma, Lilly, Medice, Novartis, Otsuka, Oxford outcomes, PCM scientific, Shire and Viforpharma; received conference attendance support and conference support or received speaker's fee by Lilly, Medice, Novartis and Shire; has been involved in clinical trials conducted by Lilly, Shire & Viforpharm; but declares the present work is unrelated to the above grants and relationships.
We thank Dr. Carol Westall for her support in data collection and valuable comments on the manuscript. This research was supported financially in part by a grant from The Hospital for Sick Children's Psychiatry Endowment Fund (RT), CIHR operating grant #11398 (RT) and by the Canada Research Chairs Program (RT).
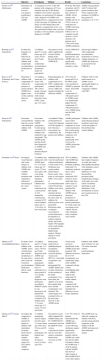
| Objective | Participants | Method | Results | Conclusions | |
|---|---|---|---|---|---|
| Granet et al.40 (Strabismus) | Determine any correlation between convergence insufficiency (CI) and ADHD | A retrospective review of the 266 patients with a diagnosis of CI was obtained from the UCSD Ratner Children's Eye Center's electronic database was performed1705 patients with a diagnosis of ADHD were identified from a computerized review of the University of California, San Diego (UCSD) Medical Records’ databaseA computerized review was also performed looking at the converse incidence of CI in patients carrying the diagnosis of ADHD | From the 266 charts of patients with CI, 26 patients (9.8%) had a history of ADHD. Of the patients with ADHD and CI, 20 (76.9%) were on medication for ADHD at the time of diagnosis for CIThe review of computer records showed a 15.9% incidence (28 patients out of 1705) of CI in the ADHD population | ADHD among patients with CI is three-fold greater incidence than when compared with incidence of ADHD in the general US population (1.8–3.3%) | |
| Borsting et al.41 (Optometry) | Evaluate the frequency of ADHD behaviors in school-aged children with symptomatic accommodative dysfunction or CI | 24 children aged 8–15 years (mean age 10.9 years), 9 boys and 15 girls, with symptomatic accommodative dysfunction and/or CI participated | One parent of each child completed the Connors Parent Rating Scale-Revised Short Form (CPRS-R:S) | On the CPRS-R:S, cognitive problem/inattention, hyperactivity, and ADHD index were significantly different from normative values | School-aged children with symptomatic accommodative dysfunction or CI have a higher frequency of ADHD-like behaviors as measured by the CPRS-R:S |
| Rouse et al.42 (Optometry and Vision Science) | Determine if children with symptomatic CI without the presence of parent-reported ADHD have higher scores on the academic behavior survey | 212 children (mean age 11.8 years) with symptomatic CI participated. The control group consisted of 49 children with normal binocular vision (NBV; mean age 12.5 years) | Parents/guardians of children with symptomatic CI or NBV completed the academic behavior survey (ABS) and reported whether the child had ADHD | 16% of the CI group and 6% of the NBV group were classified as ADHD by parental report. Total ABS score for symptomatic CI with parent report of ADHD group was significantly higher than the symptomatic CI with parent report of no ADHD group and the NBV group | Children with CI with parent report of no ADHD scored significantly higher on the ABS when compared to children with NBV |
| Farrar et al.47 (Optometry) | Document visual problems that may coexist with medicated children with ADHD | Forty-three children with ADHD participated. Control group consisted of 43 children with matched for age and gender. The ADHD group had previously been diagnosed as ADHD and was under pharmacological treatment | A modified College of Optometrists in Vision Development (COVD) Quality of Life Outcomes Assessment was conducted by the parents and children | ADHD participants report and/or experience more symptoms of visual system dysfunction than control group. Fourteen of the 33 symptoms were found to be significantly more severe in the ADHD group than in the control group | Children with ADHD, under pharmacological treatment, report more visual and quality of life problems than control children |
| Grönlund et al.43 (Eye) | Investigate visual function and ocular features in children with ADHD and establish whether treatment with stimulants is reflected in functioning of the visual system | 42 children and adolescents with ADHD aged 6.3–17.6 years (mean age 12 years), 37 boys and 5 girls, who were being treated with stimulants participated. Children had been on medications for a mean period of 19.5 monthsThe control group consisted of 50 school children (mean age of 11.9 years), 44 boys and 6 girls | Ophthalmologic tests were first performed without medication:- Visual acuity (VA)- Strabismus and ocular motility (heterotropia)- Stereo acuity- Near point of convergence (NPC)- New point of accommodationAfter at least 60min that children were given their regular stimulant all tests were performed in the same order. In addition, the following tests were performed:- Refraction under cyclopegia- Assessment of ocular dimensions- Examination of anterior segment, media, and ocular fundus- Photography of the ocular fundus for quantitative digital image analysis- History taking of visual perception | 76% of children with ADHD had ophthalmologic problems including subnormal VA, strabismus, reduced stereo vision, absent or subnormal NPC, refractive errors, small optic discs and/or signs of cognitive visual problemsThe children with ADHD had an increased proportion of heterophoria and poorer performance on visual acuity and convergence tests without, but not with, stimulants when compared with controls | Children with ADHD had a higher frequency of ocular and visual abnormalitiesTreatment with stimulants caused no significant difference in visual functionThey presented subtle morphological changes of the optic nerve and retinal vasculature, indicating an early disturbance of the development of neural and vascular tissues in the CNS |
| Martin et al.44 (ActaOphthalmologica) | Evaluate visual function in children with ADHD, and to correlate these data with the morphology of the optic nerve, and to find out if and how psychostimulant medication affects visual functions | 18 children aged 6–17 years (mean age 11.9 years), 16 boys and 2 girls, diagnosed with ADHD and treated with stimulants participated. Children had been on medication for a mean period of 14.7 months. ADHD diagnoses were determined according to DSM-IV criteria by one physician in all patientsThe control group consisted of 24 children aged 7–18 years (mean age 11.7 years), 15 boys and 9 girls | Both groups underwent an ophthalmological examination including best corrected distance visual acuity (BCVA), visual field examination, and fundus photographyThe ADHD children did not take medication on the morning of the initial examination. Two hours later, the children were given their regular drug doses and the examinations were repeated. The control group was examined twice, at the same time intervals as the ADHD group | Visual acuity increased significantly in the ADHD group after treatment. The difference between the two VF examinations was significantly larger in the ADHD compared with the control groupSignificantly more ADHD subjects had subnormal VF results without stimulants, compared with controls, but with stimulants the difference was no longer significant | Children with ADHD showed better VA and VF results with than without psychostimulant medication |
| Chung et al.45 (Yonsei Med J) | Investigate the symptoms of ADHD as reported by parents in children with intermittent exotropia [X(T)] and to determine whether strabismus surgery for X(T) affects ADHD symptoms | 51 children undergoing muscle surgery for X(T) aged 3–9 years (mean age 5.96 years), 22 boys and 29 girls, participated. All patients had either divergence excess or basic type X(T) | One parent of each child completed the ADHD rating scale IV (ADHD RS-IV) assessment, based on the DSM-IV home version, consecutively before and one year after surgery (symmetric lateral rectus recession on both eyes) | 8 (15.7%) of the 51 patients demonstrated the ADHD trait. ADHD RS-IV scores following strabismus surgery significantly decreased in patients with the ADHD trait, while they did not differ in patients without the ADHD trait. 7 of the 8 patients with the ADHD trait showed improvement in their ADHD RS-IV scores after surgery | The ADHD trait was relatively common in children with X(T), and the parent-reported symptoms of the children with the ADHD trait improved after strabismus surgery |
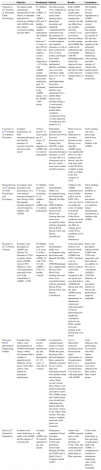
| Objective | Participants | Method | Results | Conclusions | |
|---|---|---|---|---|---|
| Tannock et al.9 (Journal of Abnormal Child Psychology) | Investigate rapid automatized naming (RAN) and effects of stimulant medication in school-age children with ADHD with and without concurrent reading disorder (RD) | 67 children with ADHD, 21 with ADHD+RD, and 27 healthy comparison children participated. All children were between 7–12 years of age, 80% of which were maleIn a second study, a subgroup (n=47) of the total ADHD sample participated in an acute medication trial, 35 belonging to the ADHD group, 12 to the ADHD+RD group | The three groups were compared on: color naming speed, letter naming speed, phonologic decoding, and arithmetic computationIn the medication trial, the subgroup of children completed several academic and cognitive measures as well as three of the RAN Tests: Colors, Letters, and Digits. Each child completed a randomized, placebo-controlled, cross-over trial with three single doses (10, 15, 20mg) of methylphenidate. The active medication and placebo were administered in a double-blind manner each morning during a 1-week period. Testing under double-blind conditions commenced about 1h after ingestion of medication and lasted for 2h | Both ADHD groups were significantly slower in color naming than controls, but did not differ from one another, showing evidence of an association between deficits in color naming and ADHD that could not be attributed to the comorbidity with RD. Methylphenidate selectively improved color-naming speed but had no effect on the speed of naming letters or digits | The findings of color naming impairments in ADHD challenge the current assumption that naming speed deficits are specific to RD and also provide some support for the purported processing differences underlying color naming and letter naming, of which color-naming speed is improved by stimulant medication |
| Lawrence et al.10 (Journal of Attention Disorders) | Compare performance on both neuropsychological and real-life measures of executive function and processing speed | 44 boys aged 6–12 years (mean age 9.7 years), 22 with a diagnosis of ADHD and 22 controls participated | Participants completed the Stroop Color-Word Test and Wisconsin Card Sorting Task (WCST), which were selected as neuropsychological measures, as well as route tasks in a videogame and at the zoo, which were used to index real-life measures | There were no group differences in executive function on the Stroop or zoo tasksThe ADHD group was significantly slower in color naming on the Stroop, and also took more trials on the WCST to complete sorting cards according to the first category of color | Color naming and color processing deficits may exist in children with ADHD |
| Banaschewski et al.6 (Journal of Child Psychology and Psychiatry) | Investigate color perception and performance on a conventional neuropsychological task (Stroop Task) that requires speeded naming of colored stimuli in children with ADHD | 27 children aged 8.0–13.0 years, consisting of 14 children with ADHD and 13 controls participated | Color discrimination ability was investigated using the Farnsworth-Munsell 100 Hue Test (FMT)Children completed the Stroop-Color-Word Task. Naming time and errors were recorded for three subtests separately: Stroop-Word, Stroop-Color, and Stroop-Color/Word | Children with ADHD committed more errors in blue–yellow axis in FMT. They were also slower in naming the colors of stimuli on both the Color and Color-Word conditions of the Stroop, but did not differ in naming speed on the Word condition, nor in Stroop interference | These findings indicate problems in the blue–yellow perception which may be accounted by retinal dopaminergic mechanisms in children with ADHD |
| Roessner et al.7 (J Neural Transm) | Examine color perception in ADHD and Chronic Tic Disorders (CTD) to clarify which factor (ADHD versus CTD) influences color vision parameters especially in the case of the comorbidity of ADHD+CTD | 69 children aged 8.0–12.6 years, 14 with a diagnosis of ADHD, 22 with CTD, 19 with ADHD+CTD, 14 healthy controls | Color discrimination ability was investigated using the Farnsworth-Munsell 100 Hue Test (FMT)Participants also completed the Stroop-Color-Word Task. Naming time and errors were recorded for three subtests separately: Stroop-Word, Stroop-Color, and Stroop-Color/Word. | Color perception deficits were found for both main factors (ADHD and CTD), but there were no interaction effectsA deficits on the blue–yellow compared to the red–green axis was detected for ADHDIn the Stroop task only the ‘pure’ ADHD group showed impairments in interference control and other parameters of Stroop performanceNo significant correlations between any FMT variable and color naming in the Stroop task were found | Basic color perception deficits in both ADHD and CTD were suggested, and these deficits are additive in the case of comorbidity (ADHD+CTD)The influence of color perception deficits on Stroop task performance might be negligible |
| Silva and Frère8 (Biomedical Engineering Online) | Examine blue–yellow color discrimination in ADHD individuals using a virtual environment that is capable of quantifying the influence of red–green versus blue–yellow color stimuli on participant performance | 20 ADHD and 20 control matched for age and gender participated (15–25 years, 17 men and 23 women) | An interactive computer game based on virtual reality was used. Within the game, the player must find and interpret hints scattered in different scenarios. In one version, hints and information boards were painted using red and green colors. In the second version, these objects were painted using blue and yellow colors. The ADHD group and control group were divided into subgroups and played either the red–green version or the yellow–blue version. The time spent to complete each task of the game was measured | Use of blue/yellow instead of green/red colors decreased the game performance of all participants. However, a greater decrease in performance was observed with participants with ADHD | Color influences the performance of executive tasks that require attention. ADHD participants were more influenced by blue–yellow than control group |
| Kim et al.5 (Journal of Optometry) | Evaluate color vision deficiency in adults with ADHD and the impact of everyday life | 30 adults with ADHD and 30 controls matched for age and gender | Participants completed Visual Activities Questionnaire (VAQ) and performed Farnsworth-Munsell 100 Hue test (FMT) and A Quick Test of Cognitive Speed (AQT) | Adults with ADHD reported more visual activities problems on VAQ. They also committed more errors in FMT, particularly in Blue spectrum | Color vision problem, particularly in blue spectrum is replicated in adult with ADHD. A comprehensive research on mechanism underlying color vision deficit is warranted |
| [ADHD, N=16] |
| Media clear, disk natural, macula well developed |
| Disk Normal, Macula Normal |
| RE-Myopic crescent at disk – rest; LE within normal limits |
| Disk and vessels normal, macular reflex – well developed |
| Both eyes optic disk normal, vessels normal, macular reflex well developed |
| Disk normal and macula normal |
| Fundus within normal limits |
| Fundus natural |
| Disk normal; macula normal |
| Disk normal; macular reflex normal |
| Fundus normal both eyes |
| Fundus BE Norms |
| Disk and macula normal both eyes |
| Disk and macula normal |
| Disk normal both eyes, Macula normal both eyes |
| Fundus normal both eyes |
| [Control, N=15] |
| Disk and macula normal |
| Fundus normal both eyes |
| Fundus – tilted disk both eyes; Macular reflex positive |
| Fundus normal both eyes |
| Fundus – No abnormality detected both eyes; CL prescription R.E.: −4.5, L.E. −5 |
| Fundus both eyes normal |
| Disk and vessels normal. Macular reflex well developed |
| BE – disk, vessels and macula normal |
| Disk, macula, vessels normal |
| Fundus OK |
| Disk, vessels, and macula normal |
| Disk, macula, vessels normal |
| Disk, macula, vessels normal both eyes |
| Fundus (disk, vessels, and macula) normal |
| Fundus (Disk, Macula, Vessels) Normal |


