


This research aims to comprehensively compare the outcomes of anterior segment optical coherence tomography (CASIA2) and Scheimpflug imaging (Pentacam) for computational reconstruction of the anterior and posterior corneal surfaces. A secondary objective is to evaluate their clinical relevance in estimating intraocular lens (IOL) power. Through this analysis, the distinct advantages of each technology are highlighted, providing insights into their complementary roles in enhancing ophthalmic modelling capabilities.
MethodsA total of 65 right eyes of 65 subjects (52 females and 13 males) with a mean age of 34 ± 8 years were studied across two separate sessions. Geometric parameters were extracted by fitting a biconic surface to the elevation maps obtained from both devices. Intra- and inter-session variability, as well as inter-device variability, were analyzed. Additionally, IOL power calculations were performed to evaluate the clinical applicability of each imaging system.
ResultsFor the anterior corneal surface, CASIA2 showed greater intra-session variability compared to Pentacam, whereas Pentacam demonstrated higher variability for the posterior surface. However, inter-session variability was similar for both devices on both surfaces.
Inter-device variability revealed close agreement for the anterior surface, while the posterior surface exhibited more variability. On the other hand, while IOL power calculations showed statistically significant differences (Δ = 0.35 D; p < 0.001), these were not clinically significant.
ConclusionsPentacam may offer greater precision in reconstructing the anterior corneal surface. However, its clinical impact on both anterior and posterior corneal surface reconstruction appears minimal, with both devices providing comparable results for IOL power calculations.
In vision sciences, precise imaging and assessment of anterior segment of the human eye plays a pivotal role in the diagnosis and management of ocular conditions. Among the advanced diagnostic technologies available, Pentacam (Optikgeräte, Wetzlar, Germany) has long been considered the gold standard for comprehensive corneal assessment. Meanwhile, CASIA2 (Tomey, Nagoya, Japan) has recently emerged as a promising tool for wide-angle anterior segment imaging, leveraging the unique capabilities of optical coherence tomography (OCT).
Pentacam utilizes the Scheimpflug principle to generate detailed three-dimensional reconstructions of the anterior segment.1 This method involves rotating a camera and slit illumination system to capture focused two-dimensional images at various depths. Pentacam has proven invaluable in corneal tomography,2 anterior chamber depth assessment,3 and lens opacity evaluation,4 making it a versatile tool for clinicians involved in refractive surgery planning, cataract surgery,5 and the diagnosis of corneal and anterior segment pathologies.6,7
In parallel, Anterior Segment Optical Coherence Tomography (AS-OCT), as implemented in devices like CASIA2, uses low-coherence interferometry to capture high-resolution cross-sectional images of the anterior segment structures.8 This technology has garnered recognition for its ability to non-invasively provide detailed insights into corneal morphology, anterior chamber parameters, and lens characteristics. With its dedicated anterior segment module, CASIA2 has become a notable player in the field of AS-OCT, offering clinicians the capability to obtain precise measurements and quantitative data crucial for ophthalmic diagnostics.9
While both Scheimpflug-based imaging (Pentacam) and AS-OCT (CASIA2) significantly enhance anterior segment imaging, understanding their respective strengths, limitations, and clinical applications is essential for optimal use. Scheimpflug technology employs a blue-light visible source, which can lead to high scattering in translucent or mildly opaque tissues outside the cornea, limiting its effectiveness in certain conditions. In contrast, OCT uses a long-wavelength monochromatic light source, which is better suited for imaging through translucent and non-transparent tissues, making it potentially more robust in cases of media opacities. This study aims to systematically compare the corneal reconstruction capabilities of CASIA2 and Pentacam, focusing on their imaging principles, performance, and clinical utility. Specifically, the interchangeability of each modality in estimating IOL power as use case was explored. By highlighting the complementary roles of these technologies, insights into their potential to enhance the diagnostic armamentarium of ophthalmic practitioners is provided.
Material and methodsThis study included 65 right healthy eyes of 65 subjects (52 females and 13 males) with a mean age of 34 ± 8 years. The average refractive values of the participants (mean ± SD) were as follows: M=−1.05±2.11D, J0=−0.06±0.29D, and J45=−0.07±0.14 D. This represents a young, predominantly female population with mild myopia and low levels of astigmatism. Exclusion criteria included ocular disease, a history of ocular surgery, corneal abnormalities, and a history of ocular trauma. The study was conducted in accordance with the Declaration of Helsinki and approved by the Research Ethics Committee of the Principality of Asturias (Spain).
Six measurements were performed across two separate sessions using both CASIA2 (Tomey, Nagoya, Japan) and Pentacam (Optikgeräte, Wetzlar, Germany). All data were collected and provided by the Ophthalmologic Institute Fernández-Vega (Oviedo, Spain). All measurements were made by an experimented examiner who had received prior training to perform the measurements according to the study protocol. Prior to each measurement, subjects were repositioned, and the instruments were reset to their original settings. Measurements with both devices were made in the same room and under the same lighting conditions (mesopic conditions). Standardized protocols were followed for both devices to ensure accurate and reliable corneal topography assessments, with CASIA2 using the corneal map mode.
To evaluate the reconstruction capabilities of each device, elevation maps were fitted to an 8 mm diameter circular zone using a biconic surface model described by the implicit equation10,11:

Here, cx,y and px,y represent the curvatures and shape factors of the reconstructed surface, centered and aligned along its principal meridians. Related to the radius of curvature and the conic constant as follows: Rx,y=1/cx,y and Qx,y=px,y−1, respectively. To mitigate potential misalignment discrepancies between the two devices, a sixth-order Zernike polynomial surface was initially fitted to extract symmetric and astigmatic terms. This approach accounts for the fact that Pentacam uses the keratometric axis, while CASIA2 employs the optical axis, leading to tilts (θx,θy,θz) that can affect the estimation of geometric parameters (Rx,Ry,Qx,Qy). By applying a consistent fitting method to the raw data, we aimed to minimize these discrepancies and allow for a more accurate comparison between the two devices. The motivation for using this method lies in the advantages of performing a linear fit, which provides faster computational speed and a unique solution without the need for an initial value or boundary in the fitting process. This eliminates the risk of reaching a suboptimal solution. Furthermore, by applying Zernike polynomials, tilts and surface irregularities are removed, resulting in a more robust fit and more reliable geometric parameters, enabling better comparison of the reconstructed corneas.
Geometric parameters were used to calculate intra-session variability (R coefficient, 1.96√2σ), inter-session and inter-device variability (ICC coefficient, "Two-way mixed effects", absolute agreement) using MATLAB 2023a.12,13 Bland-Altman plots were generated to assess agreement between the devices, and Pearson correlation coefficients (r) were used to evaluate correlations. For statistical analysis, normality was tested with the Shapiro-Wilk test, followed by either a paired t-test or Wilcoxon signed-rank test, depending on the data distribution.
In addition, axial length measurements from 26 of the subjects (mean ± SD: 23.54 ± 0.82 mm) were obtained using the IOLMaster 700 (Carl Zeiss Meditec AG, Jena, Germany) to compare IOL power estimation between the two devices. According to the axial lengths observed in the sample, the SRK/T formula was selected for IOL power calculation. Using the average corneal power (K), axial length (AL), and an anterior chamber depth (ACD) derived from the A-constant as inputs for each eye, IOL power was calculated.14 Following standard clinical practice, the average corneal power was obtained by fitting a best-fit sphere with radius R to the central 3 mm zone of the elevation map, using a keratometric refractive index of 1.3375.
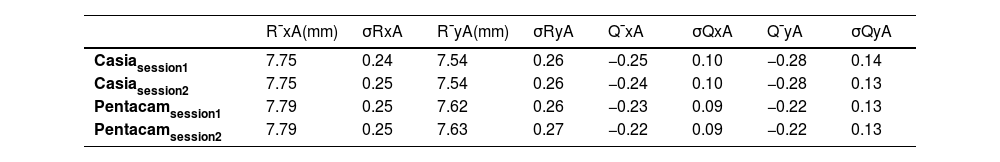
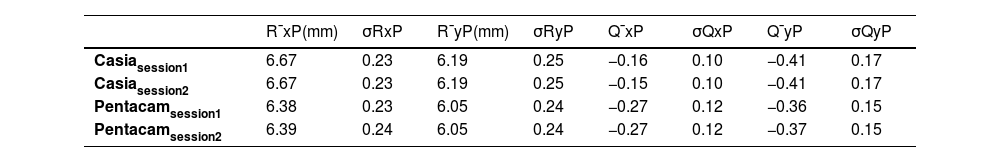
ResultsBefore delving into the comparison, the anterior and posterior corneal geometric parameters from both sessions, obtained after fitting the biconic surface, are presented in Tables 1 and 2.
The following comparison is carried out from the previously presented values. Table 3 shows the variability within a single session (R), the variability between two sessions (ICCC,P), and the variability between both devices in one session (ICCC−P). The first two are displayed as ratios to highlight the extent of variation between the devices.
The correlation of the geometric parameters and the Bland-Altman plots for the anterior and posterior corneal surfaces were then analyzed. The results are shown in Figs. 1 and 2. In all comparisons presented in these figures, the difference between the measurements (ΔR or ΔQ) represents the values from CASIA2 minus those from Pentacam.
 and correlation plots (right), illustrating the differences and relationships between corneal geometric parameters obtained from elevation maps using CASIA2 and Pentacam.")
 and correlation plots (right) comparing posterior corneal Rx, Ry, Qx, and Qy values between CASIA2 and Pentacam, based on elevation-derived corneal geometric parameters.")
The three measurements from the first session were used to assess whether the observed differences were statistically significant. The Bland-Altman plots revealed differences in the radii of curvature for the anterior and posterior surfaces ranging from 0.05 to 0.08 mm and 0.14 to 0.29 mm, respectively, corresponding to approximately 0.25 to 0.50 D and 0.15 to 0.25 D These differences in all geometric parameters for both the anterior and posterior corneal surfaces were found to be statistically significant (p < 0.001).
Finally, the corneal power calculated over a 3 mm zone was KC=43.98±1.47D with CASIA2 and KP=43.74±1.44D with Pentacam, resulting in IOL power values of PC=15.91±2.58 D and PP=16.24±2.62 D, respectively. These differences were statistically significant (p<0.001), and a typical A-constant of 118.8 was used for the IOL power calculation (Fig. 3).
Discussion and IOL power calculations between CASIA2 and Pentacam, shown in Bland-Altman plots (left) and correlation plots (right). Mean corneal power was calculated from a 3 mm central corneal zone, and IOL power was estimated using the SRK/T formula.")
A comparison of the outcomes from CASIA2 and Pentacam was performed, emphasizing the unique advantages of each technology and providing insights into their respective roles.
The standard deviation of the geometric parameters across sessions for the same device was comparable, as shown in Tables 1 and 2. Notably, CASIA2 measured a flatter posterior corneal surface than Pentacam, consistent with findings from the previous CASIA SS-1000 model.15 This discrepancy warrants further investigation. However, its clinical relevance may be limited, as the posterior corneal surface contributes significantly less to overall refractive power than the anterior surface. Additionally, previous studies have found no clinically significant differences in IOL power estimation when using standard versus individualized posterior corneal values.16 In Table 3, CASIA2 demonstrated greater intra-session variability for the anterior surface compared to Pentacam. Conversely, for the posterior surface, CASIA2 exhibited lower variability, aligning with the findings of Schröder et al.,17 who reported that Pentacam showed lower intra-session variability in anterior surface elevation maps, while CASIA2 was more consistent for the posterior surface. Since our calculations were based on elevation maps, these differences are justified. Importantly, variability on the anterior surface is of greater clinical relevance, as small changes can significantly affect refractive outcomes.
In terms of inter-session variability, both devices showed similar performance on both the anterior and posterior surfaces. This suggests that variability due to external factors, rather than the devices themselves, affects both instruments equally. For inter-device variability, the agreement on the anterior surface was close to unity, whereas more notable differences were observed for the posterior surface. Based on these findings, Pentacam appears preferable to CASIA2 in terms of inter-session variability. However, both devices offer similar intra-session performance. While inter-device agreement is strong for the anterior surface, discrepancies can be expected for the posterior surface.
To further assess agreement between the devices, Bland-Altman and correlation plots were analyzed. The anterior surface showed a higher correlation across parameters (0.90 < ranterior < 1.00) compared to the posterior surface (0.70 < rposterior < 1.00), indicating stronger agreement for anterior measurements. Bland-Altman plots revealed differences in radii of curvature, translating to refractive power differences of about 0.25–0.50 D for the anterior surface and 0.15–0.25 D for the posterior surface. These differences were statistically significant (p < 0.001) for all parameters.
The increased intra-session variability observed with CASIA2, an OCT-based system, could be attributed to several factors inherent to the optical principles and scanning process of OCT technology. Unlike Scheimpflug-based systems like Pentacam, which capture multiple images through a rotating camera, OCT relies on light reflections from different tissue layers to create cross-sectional images of the cornea. Changes in the alignment of the eye during imaging or shifts in the relative position of the scanning beam to the corneal surface can lead to inconsistent results within the same session contributing to higher variability. Furthermore, device-specific scanning features of OCT systems could also play a role. CASIA2 may employ a more complex scanning method, where the scan pattern or speed could influence the consistency of measurements. In contrast, Pentacam, captures images through a rotating camera system, making it less sensitive to small variations in alignment or optical properties. This could contribute to the more stable results observed with Pentacam in anterior surface measurements. Despite these challenges, CASIA2 offer significant advantages in providing more comprehensive information about the anterior segment as a whole, including the cornea, iris, and lens, while Pentacam is more specialized for detailed corneal analysis.
When estimating IOL power using the SRK/T formula, Pentacam produced, on average, lens power values approximately 0.35 D higher than those calculated with CASIA2. The only work we are aware of comparing IOL estimation with the same instruments in healthy subjects is that presented by Asawaworarit et al. where differences of 0.10 D were found.18 Both results remain below the clinically acceptable threshold of 0.50 D, suggesting that the differences between the devices are not clinically significant.19 It is important to note that although the average difference obtained between devices is around 0.35 D, the standard deviation is 0.60 D This indicates that a percentage of cases show differences greater than 0.50 D, reaching clinically significant values. These discrepancies are associated with individuals where the corneal reconstruction provided by CASIA2 and Pentacam differs significantly. It is also worth highlighting that this study was conducted on healthy eyes. However, in certain scenarios, such as post-refractive surgery, keratoconus, high astigmatism, or cataracts with media opacity, those differences may become clinically more relevant.
It is important to note that the algorithm used by the device for IOL power calculation is typically unknown, which means that results obtained using the SRK/T formula cannot be directly transferred to clinical practice. This is a common limitation when working with clinical devices: due to the lack of access to the manufacturers’ proprietary algorithms, we must rely on approximations using our own methods. While these approaches are not identical to those used in commercial systems, they remain valuable for improving our understanding of the underlying processes and their clinical relevance. Furthermore, from both a technical and design standpoint, it is standard practice to combine data obtained from these devices with one of the commonly used formulas for IOL power calculation.
In eyes with altered corneal anatomy, accurate measurement of anterior and posterior corneal profile becomes crucial. Post-refractive surgery alters the anterior-posterior corneal curvature relationship, making these differences potentially significant and increasing the risk of refractive surprise when targeting emmetropia. In keratoconus, irregularities on both corneal surfaces further complicate calculations, emphasizing the need for precise surface data. Similarly, in high astigmatism, accuracy relies on exact measurements of total corneal astigmatism, where small errors can impact both power and axis selection. In cases with media opacities, compromised imaging quality may limit reliability, highlighting the importance of choosing the most suitable imaging technology.
In conclusion, despite variations in inter- and intra-session variability along with inter-device variability, the differences between CASIA2 and Pentacam appear to have minimal clinical impact. Therefore, it may be reasonable to consider both technologies as potentially interchangeable for corneal analysis and assessment. However, considering the limitations of this study, it would be valuable to conduct future research with a larger sample size, a more balanced sex distribution, a broader range of refractive errors, and older participants to better assess differences in the presence of lens opacities. Additionally, including eyes with corneal pathologies would allow for a more comprehensive comparison of the performance of both devices in less ideal, but clinically significant, scenarios.
FundingH2020 Marie Skłodowska-Curie Actions (956720).
Authors have no conflict of interest to declare.
This project has received funding from the European Union’s Horizon 2020 research and innovation programme under the Marie Skłodowska-Curie grant agreement No 956720.


