


To evaluate the corneal Functional Optical Zone (FOZ) and the Effective Optical Zone (EOZ) of the ablation, among eyes that underwent LASEK/Epi-LASEK treatments for hyperopic astigmatism.
MethodsTwenty LASEK/Epi-LASEK treatments with mean defocus +2.21±1.28 D performed using the SCHWIND AMARIS were retrospectively evaluated at 6-month follow-up. In all cases pre-/post-operative Corneal-Wavefront analyses using the Keratron-Scout (OPTIKON2000) were performed. FOZ-values were evaluated from the Root-Mean-Square of High-Order Wave-Aberration (RMSho), whereas EOZ-values were evaluated from the changes of Root-Mean-Square of High-Order Wave-Aberration (ΔRMSho) and Root-Mean-Square of the change of High-Order Wave-Aberration (RMS(ΔHOAb)). Correlations of FOZ and EOZ with Planned Optical Zone (POZ) and Defocus correction (SEq) were analyzed using a bilinear function.
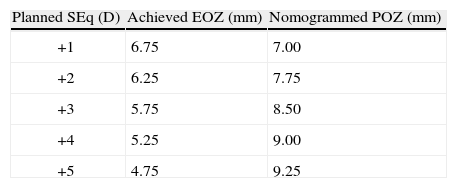
ResultsAt six-month, defocus was −0.04±0.44 D, ninety percent eyes were within±0.50 D from emmetropia. Mean RMSho increased 0.18±0.22μm, SphAb −0.30±0.18μm, and Coma 0.07±0.18μm 6-month after treatment (6-mm diameter). Mean FOZPre was 7.40±1.48mm, mean POZ was 6.76±0.22mm, whereas mean FOZPost was 5.53±1.18mm (significantly smaller, p<0.0001; bilinear correlation p<0.005), mean EOZΔRMSho 6.47±1.17mm (bilinear correlation p<0.005), EOZRMS(ΔHOAb) 5.67±1.23mm (significantly smaller, p<0.0005; bilinear correlation p<0.05). EOZ positively correlates with POZ and declines steadily with SEq. A treatment of +3 D in 6.50-mm POZ results in 5.75-mm EOZ (7.75-mm NPOZ), treatments in 7.00-mm POZ result in about 6.25-mm EOZ (8.25-mm nomogrammed POZ).
ConclusionsFOZPost was significantly smaller than FOZPre. EOZΔRMSho was similar to POZ, whereas EOZRMS(ΔHOAb) was significantly smaller. Differences were larger for smaller POZ or larger Defocus. SEq up to +2 D result in EOZ, at least, as large as POZ. For SEq higher than +2 D, a nomogram for OZ can be applied.
Evaluar la zona óptica funcional (ZOF) y la zona óptica eficaz (ZOE) de la ablación de la córnea en ojos sometidos a tratamientos LASEK/Epi-LASEK para astigmatismo hipermetrópico.
Métodosse evaluaron retrospectivamente, a los 6 meses de seguimiento, 20 tratamientos LASEK/Epi-LASEK con un desenfoque medio de +2,21±1,28 D realizados con el SCHWIND AMARIS. En todos los casos se llevaron a cabo análisis de frente de onda de la córnea (Wavefront) preoperatorios y postoperatorios utilizando el Keratron-Scout (OPTIKON2000). Los valores de la ZOF se evaluaron a partir de la raíz cuadrática media de la aberración de frente de onda de orden superior (RMSho), mientras que los valores de la ZOE se evaluaron a partir de los cambios de la raíz cuadrática media de la aberración de frente de onda de orden superior (nRMSho) y la raíz cuadrática media del cambio de la aberración de frente de onda de orden superior (RMS(RHOAb)). Se analizaron las correlaciones de la ZOF y la ZOE con la zona óptica planificada (ZOP) y la corrección del desenfoque (SEq) utilizando una función bilineal.
ResultadosAl cabo de 6 meses, el desenfoque era de −0,04±0,44 D; el 90 % de los ojos se encontraban dentro de±0,50 D de la emetropía. La RMSho media aumentó en 0,18±0,22μm, SphAb −0,30±0,18μm y Coma 0,07±0,18μm 6 meses después del tratamiento (diámetro de 6mm). La ZOFPre media fue de 7,40±1,48mm, la ZOP media de 6,76±0,22mm, mientras que la ZOFPost media fue de 5,53±1,18mm (significativamente inferior, p<0,0001; correlación bilineal, p<0,005), la ZOE(RMSho) media fue de 6,47±1,17mm (correlación bilineal p<0,005), la ZOERMS(HOAb) 5,67±1,23mm (significativamente inferior, p<0,0005; correlación bilineal p<0,05). La ZOE se correlaciona positivamente con la ZOP y disminuye de manera constante con la SEq. Un tratamiento de +3 D en ZOP de 6,50mm resulta en ZOE de 5,75mm (7,75mm ZOPN); los tratamientos en ZOP de 7,00mm resultan en una ZOE de unos 6,25mm (8,25mm ZOP nomogramada).
ConclusionesLa ZOFPost fue significativamente inferior a ZOFPre. LA ZOE(RMSho fue similar a la ZOP, mientras que la ZOERMS((HOAb) fue significativamente inferior. Las diferencias fueron mayores para la ZOP inferior o desenfoque mayor. Una SEq de hasta +2 D da lugar a una ZOE, como mínimo, tan grande como la ZOP. Para una SEq superior a +2 D, puede aplicarse un nomograma para ZO.
The profiles etched onto the cornea and their optical influence greatly differ between myopic and hyperopic corrections1. Complaints of ghosting, blur, haloes, glare, decreased contrast sensitivity, and vision disturbance2 have been documented with small optical zones in hyperopia, especially when the scotopic pupil dilates beyond the diameter of the surgical optical zone3, and these symptoms may be a source of less patient satisfaction 4. This is supported by clinical findings on night vision with small ablation diameters5 as well as large pupil sizes3,5 and at tempted correction6. Although increasing the size of the planned ablation zone has reduced the incidence of these complaints7, it has not eliminated them. Refractive procedures tend to induce aberrations that affect visual performance8. Special ablation patterns were designed to preserve the preoperative level of high-order aberrations9, if the best-corrected visual acuity, in a given patient, has been unaffected by the pre-existing aberrations10. Thus to compensate for the aberrations induction observed with other types of profile definitions11, some of those sources of aberrations are those related to the loss of efficiency of the laser ablation for non-normal incidence12. Methods for determining functional o ptical zones (FOZ) after hyperopic refractive surgery have been used previously1,13.
Laser refractive surgery generally reduces low order aberrations (defocus and astigmatism), yet high-order aberrations, particularly coma and spherical aberration, may be significantly increased14. It is important to investigate the ch anges in high-order aberrations in optimized hyperopic laser refractive surgery15, not only to characterize the effects on vision outcome, but also to provide valuable information for the design of customized ablation algorithms, which should eliminate both existing and surgically-induced high-order aberrations.
We recently published our findings concerning EOZ for myopia16, now we investigated the postoperative corneal wavefront (CW) of eyes that underwent successful refractive surgery for hyperopia and objectively determined the FOZ and EOZ at the 6-month (6M) postoperative examination.
Patients and methodsThe first consecutive 20 compound hyperopic astigmatism (HA) treatments (10 patients), treated by MC using the AMARIS Aberration-Free™ aspheric ablation with LASEK17 or Epi-LASEK18 techniques which completed 6M follow-up were retrospectively analyzed.
Six-month follow-up was available in the 20 of these eyes (100 %), and their preoperative data were as follows: mean manifest spherical defocus was +2.21±1.28 D (range, +1.00 to +5.00 D); mean manifest astigmatism was 3.12±1.71 D (range, 0.50 to 6.00 D). In all eyes, we measured corneal topography and derived corneal wavefront analyses (Keratron-Scout, OPTIKON2000, Rome, Italy), manifest refraction, and uncorrected and best spectacle-corrected Snellen visual acuity (UCVA and BSCVA, respectively). Measurements were performed preoperatively and at one, three, and six months after surgery.
All ablations were non-customized based on “aberration neutral” profiles19 and calculated using the ORK-CAM software mo dule version 3.1 (SCHWIND eye-tech-solutions, Kleinostheim, Germany).
Mean planned optical zone (POZ) was 6.76±0.22mm (range, 6.25 to 7.25mm) with a variable transition size (TZ) automatically provided by the laser related to the planned refractive correction of 2.04±0.71mm (range, 0.96 to 2.50mm) leading to a total ablation zone (TAZ) 8.81±0.41mm (range, 7.99 to 9.22mm). The ablation was performed using the AMARIS excimer laser (SCHWIND eye-tech-solutions, Kleinostheim, Germany).
Since the Scout system has an eight images buffer, we acquire systematically four topographic maps per eye and visit. We have analyzed the results for all topographies and taken the median value. We calculated a value for the repeatability for each of the methods.
Analysis of the functional optical zone (FOZ)For our analysis, the concept of equivalent defocus (DEQ) has been used as a metric to minimise the differences in the Zernike coefficients due to different analysis diameters20. Seiler et al.21 described an increase in spherical aberration with pupil dilation in corneas that have undergone photorefractive keratectomy but not in healthy corneas.
By analyzing corneal Wave Aberrations for diameters starting from 4-mm, we have increased the analysis diameter in 10mm steps and refit to Zernike polynomials up to the 7th radial order, until the corneal RMSho was above 0.375 D for the first time. This diameter minus 10mm was determining the FOZ for that case (Figure 1):
Analysis of the effective optical zone (EOZ)

Effective Optical Zone (EOZ) can be defined as the part of the corneal ablation area that actually conforms to the theoretical definition. Again, the definition implies that the optical zone don’t need to be circular.
ΔRMSho methodBy comparing postoperative and preoperative corneal Wave Aberrations increasing the analysis diameter until the difference of the corneal RMSho was above 0.375 D for the first time (Figure 2, Top):

 method: By analyzing the differential corneal Wave Aberrations for a diameter starting from 4-mm, we have increased the analysis diameter in 10μm steps, until the root-mean-square of the differential corneal Wave Aberration was above 0.375 D for the first time. This diameter minus 10μm was determining the EOZ for that case.")
Top: Concept of the ΔRMSho method: By comparing postoperative and preoperative corneal Wave Aberrations analyzed for a common diameter starting from 4-mm, we have increased the analysis diameter in 10μm steps, until the difference of the corneal RMSho was above 0.375 D for the first time. This diameter minus 10μm was determining the EOZ. Bottom: Concept of the RMS(ΔHOAb) method: By analyzing the differential corneal Wave Aberrations for a diameter starting from 4-mm, we have increased the analysis diameter in 10μm steps, until the root-mean-square of the differential corneal Wave Aberration was above 0.375 D for the first time. This diameter minus 10μm was determining the EOZ for that case.
By analyzing the differential corneal Wave Aberrations increasing the analysis diameter until the root-mean-square of the differential corneal Wave Aberration was above 0.375 D for the first time (Figure 2, Bottom):
Mean value analyses
We analyzed the mean values of these metrics and assessed the statistical significance of the FOZPost compared to the FOZPre, as well as, of the EOZ compared to the POZ using paired Student's T-tests.
Regression analysesWe have analyzed the correlations of FOZPost with FOZPre and with defocus correction, as well as, of EOZ for each of the methods with POZ and with defocus correction, using a bilinear function (linear with POZ and defocus) of the form:
where a is a general bias term, b the partial slope for the linearity with FOZPre or POZ, c the partial slope for the linearity with the norm of the U-vector, and d the partial slope for the linearity with the product FOZPre or POZ and the norm of the U-vector. The ideal cases, for which FOZPost equals FOZPre and EOZ equals POZ independently on the defocus correction, are represented by the coefficients:


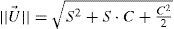
The U-vector22 can be represented as the vector in the 3-dimensional double angle astigmatism space with C+/2, M, and Cx/2 as components. The norm of this vector correlates to the dioptric blur and to visual acuity23 and can be formulated in sphero-cylindrical prescription as:
We assessed the statistical significance of the correlations using Student's T-tests, the Coefficient of Determination (r2) and the standard deviation on the individual terms were used, and the significance of the correlations has been evaluated considering a metric distributed approximately as t with N–4 degrees of freedom where N is the size of the sample. Statistics have been reported considering 20 eyes (as if they were independent) as well as considering 10 patients (considering the dependency).
Calculation of the bilateral (OD vs. OS) correlations for FOZ/EOZWe assessed the statistical significance of the correlations using Student's T-tests, the Coefficient of Determination (r2) was used, and the significance of the correlations has been evaluated considering a metric distributed approximately as t with N–2 degrees of freedom where N is the size of the sample.
Calculation of proposed nomogram for OZWith the obtained parameters (a to e), we have calculated the nomogram planned OZ (NPOZ) required to achieve an intended EOZ (IEOZ):
ResultsRefractive outcomes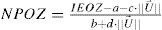
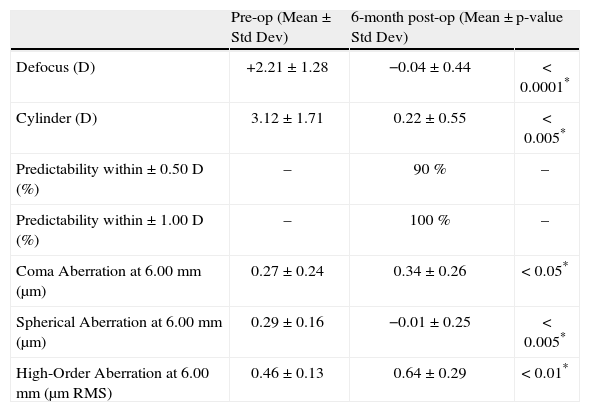
Concerning refractive outcomes, we merely want to outline that both, the SEq and the cylinder were significantly reduced to subclinical values at 6months postoperatively [mean residual defocus refraction was −0.04±0.44 D (range −1.00 to +0.63 D) (p<0.0001) and mean residual astigmatism magnitude 0.22±0.55 D (range, 0.00 to 1.50 D) (p<0.001)] and that 90 % of eyes (n=18) were within + 0.50 D of the attempted correction (Table 1).
Refractive outcomes and induced aberrations at 6-month.
| Pre-op (Mean ± Std Dev) | 6-month post-op (Mean ± Std Dev) | p-value | |
| Defocus (D) | +2.21±1.28 | −0.04±0.44 | < 0.0001* |
| Cylinder (D) | 3.12±1.71 | 0.22±0.55 | < 0.005* |
| Predictability within ± 0.50 D (%) | – | 90 % | – |
| Predictability within ± 1.00 D (%) | – | 100 % | – |
| Coma Aberration at 6.00mm (μm) | 0.27±0.24 | 0.34±0.26 | < 0.05* |
| Spherical Aberration at 6.00mm (μm) | 0.29±0.16 | −0.01±0.25 | < 0.005* |
| High-Order Aberration at 6.00mm (μm RMS) | 0.46±0.13 | 0.64±0.29 | < 0.01* |
Preoperative corneal coma aberration (C[3,±1]) was 0.27±0.24mm RMS, corneal spherical aberration (C[4,0]) (SphAb) was +0.29±0.16mm, and corneal RMSho was 0.46±0.13mm RMS (Table 1). Postoperatively, corneal coma magnitude changed to 0.34±0.26 [jm RMS (p<0.05), corneal SphAb to −0.01±0.25mm (p<0.005), and corneal RMSho changed to 0.64±0.29mm RMS (p<0.01) (Table 1).
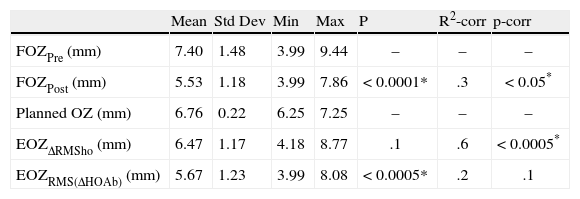
Mean value analysesWe analyzed the mean values of FOZ and EOZ and assessed the statistical significance of the FOZPost compared to the FOZPre, as well as, of the EOZ compared to the POZ using paired Student's T-tests (Table 2). FOZPost was significantly smaller (p<0.0001) than FOZPre. EOZΔRMSho was similar to POZ, whereas EOZRMS(ΔHOAb) was significantly smaller (p<0.05) than POZ and EOZΔRMSho. Figure 3 shows the evolution and change of the OZ with time. FOZ and EOZ showed smaller values for shorter follow-up times and continues increasing from 1, to 3 and 6-months after treatment.
Effective optical zone 6-month after surgery vs. planned optical zone.
| Mean | Std Dev | Min | Max | P | R2-corr | p-corr | |
| FOZPre (mm) | 7.40 | 1.48 | 3.99 | 9.44 | – | – | – |
| FOZPost (mm) | 5.53 | 1.18 | 3.99 | 7.86 | < 0.0001* | .3 | < 0.05* |
| Planned OZ (mm) | 6.76 | 0.22 | 6.25 | 7.25 | – | – | – |
| EOZΔRMSho (mm) | 6.47 | 1.17 | 4.18 | 8.77 | .1 | .6 | < 0.0005* |
| EOZRMS(ΔHOAb) (mm) | 5.67 | 1.23 | 3.99 | 8.08 | < 0.0005* | .2 | .1 |

Figure 4 shows the repeatability of the FOZ and EOZ. FOZ and EOZ showed similar values for repeatability 6-months after treatment of about 0.3mm. The only statistically significant difference in repeatability was between FOZPre, FOZPost and EOZRMS(ΔHOAb) method.
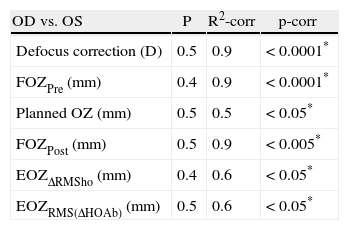
Calculation of the bilateral (OD vs. OS) correlations for FOZ/EOZ
All metrics were bilaterally well correlated between OD and OS eyes (Table 3).
Regression analysesWe have analyzed the correlations of FOZPost with FOZPre and with refractive correction (r2=0.7, p<0.0001 for 20 eyes, r2=0.7, p<0.005 for 10 patients) (Figure 5), as well as, of EOZ for each of the methods with POZ and with defocus correction (r2=0.7, p<0.0001 for 20 eyes, r2=0.6, p<0.005 for 10 patients for the DRMSho method; and r2=0.6, p<0.005 for 20 eyes, r2=0.5, p<0.05 for 10 patients for the RMS(ΔHOAb) method) (Figure 6).
. FOZPost correlates positively with FOZPre, and declines steadily with increasing defocus corrections. Example of double-entry graphs: A treatment of +2.5 D in a cornea with 6.75mm FOZPre results in ∼5.75mm FOZpost.")
Bilinear regression analyses for the correlations of FOZPost with FOZPre and defocus correction (derived from Eq. 5). FOZPost correlates positively with FOZPre, and declines steadily with increasing defocus corrections. Example of double-entry graphs: A treatment of +2.5 D in a cornea with 6.75mm FOZPre results in ∼5.75mm FOZpost.
: ΔRMSho method (r2=0.7, p<0.005) (top) and RMS(ΔHOAb) method (r2=0.5, p<0.05) (bottom). EOZ correlates positively with POZ, and declines steadily with increasing defocus corrections. Example of double-entry graphs: A treatment of +3 D in 6.5mm POZ results in ∼5.5mm EOZ when analyzed with the ΔRMSho method, but in ∼5.25mm EOZ when analyzed with the RMS(ΔHOAb) method.")
Bilinear regression analyses for the correlations of EOZ with POZ and with defocus correction for each of the methods (derived from Eq. 6): ΔRMSho method (r2=0.7, p<0.005) (top) and RMS(ΔHOAb) method (r2=0.5, p<0.05) (bottom). EOZ correlates positively with POZ, and declines steadily with increasing defocus corrections. Example of double-entry graphs: A treatment of +3 D in 6.5mm POZ results in ∼5.5mm EOZ when analyzed with the ΔRMSho method, but in ∼5.25mm EOZ when analyzed with the RMS(ΔHOAb) method.
FOZPost and EOZ correlate positively with FOZPre and POZ, respectively, and decline steadily with increasing defocus corrections (Tables 4 and 5).
Calculation of proposed nomogram for OZWith the obtained parameters (a to e), we have calculated the nomogram planned OZ (NPOZ) required to achieve an intended EOZ (IEOZ) (Figure 7, Tables 3 and 4).
 required to achieve an intended EOZ (IEOZ) for defocus correction for each of the methods (derived from Eq. (12): ΔRMSho method (top) and RMS(ΔHOAb) method (bottom). Example of double-entry graphs: A treatment of +3 D with intended EOZ of 6.5mm results in ∼8.25mm nomogrammed OZ when planned for the ΔRMSho and RMS(ΔHOAb) methods.")
Calculated nomogram planned OZ (NPOZ) required to achieve an intended EOZ (IEOZ) for defocus correction for each of the methods (derived from Eq. (12): ΔRMSho method (top) and RMS(ΔHOAb) method (bottom). Example of double-entry graphs: A treatment of +3 D with intended EOZ of 6.5mm results in ∼8.25mm nomogrammed OZ when planned for the ΔRMSho and RMS(ΔHOAb) methods.
Limitations of our study include that the clinical evaluation was performed over only 20 eyes, reducing the statistical power of the conclusions; and the lack of a control group. It is difficult for us (as a private practice) to find a similar cohort and evaluate them at different time stamps to simulate the timing after refractive surgery, but without having (any kind of) surgery on those.
The low number of eyes can be explained by several reasons:
- –
Hyperopic treatments are in our centre much less often than myopic ones (∼1:4)
- –
Hyperopic treatments are treated in our centre much less often in aspheric mode and more often in customized mode since they either:
- •
show larger aberrations, or
- •
large angle kappa (or alpha or lambda),
- •
are secondary treatments, or
- •
suffer from presbyopia as well.
- •
- –
We have already reported and published an essentially similar study for myopia also with another 20 eyes (and we wanted to compare to those as well).
The clinical evaluation was limited to HA treatments. Evaluation was limited to LASEK/Epi-LASEK techniques, thus results cannot be extrapolated to LASIK treatments without further clinical evaluations. Finally, in our sample, POZ significantly correlated with defocus (r2=0.7, p<0.0001), indicating that the two variables of the bilinear fit were interdependent.
A limitation of the study is its observational nature, since no controls are included. However, considering a historic control group treated a few years ago with a different system using a Munnerlyn algorithm we determined a −5 % smaller EOZ diameters or −9 % smaller EOZ areas compared to our current results.
Until today, there is no proof that the asphericity alone plays a major role in the visual process24. We still do not know whether an asphericity Q –0.25 is better than Q +0.50, we only know that the asphericity of the “averaged” human cornea is about −0.2825. As well, no absolute optimum has been found, despite of some remarkable theoretical works26–28. When a patient is selected for non customi zed aspherical treatment, the global aim of the surgeon should be to leave all existing high order aberrations (HOA) unchanged because the best corrected visual acuity, in this patient, has been unaffected by the pre-existing aberrations29. Hence, all factors that may induce changes in HOA's30,31, such as biomechanics, need to be taken into account prior to the treatment to ensure that the preoperative HOA's are unchanged after treatment.
Jiménez et al.32 found that binocular function deteriorates more than monocular function after LASIK, and that this deterioration increases as the interocula r differences in aberrations and corneal shape increase.
One of the most significant side effects in laser corneal refractive surgery with classical approaches is the induction of spherical aberration33, which causes halos and reduced contrast sensitivity34, resulting in deviations from the optimal corneal line-shape post-operatively. Anyway, from the literature is reported a significant decreasing in the Q-Value after two months post surgery, and after three months the asphericity data can be considered stable35.
Jiménez et al.36 deduced a mathematical equation for corneal asphericity after refractive surgery, when the Munnerlyn formula is used. Equations for corneal asphericity may be of clinical relevance in quantitatively studying the role of different factors (decentration, type of laser, optical role of the flap, wound healing, biomechanical effects, technical procedures) during corneal ablation.
The measurement technique used in this study actually imposes restrictions on optical zone size that may underestimate it for decentrations. On the other hand, topographical data may not fit to Zernike polynomials up to the seventh radial order (36 Zernike coefficients). It is known that the residual irregularity of the cornea not fit by Zernike's may have a significant impact on visual quality37. Ignoring this effect might bias the effective optical zone size determined leading to an overestimate that can be significant.
Comparing this result with our previous study for myopic astigmatism16, we observed that EOZ is significantly smaller in hyperopic astigmatism compared to myopic astigmatism. In myopic astigmatism, we observed a mean EOZ of 6.74-mm analyzed with the ΔRMSho method and 6.42-mm analyzed with the RMS(ΔHOAb) method, whereas in hyperopic astigmatism the values were 6.47-mm for the ΔRMSho method and 5.67-mm analyzed with the RMS(ΔHOAb) method. The mean relative ratio between EOZ and POZ diameters was 0.97±0.06 for myopia and 0.90±0.12 for hyperopia, whereas the mean relative ratio between EOZ and POZ surfaces was 0.95±0.12 for myopia and 0.81±0.26 for hyperopia. Determined EOZ for hyperopic astigmatism were more scattered than the ones for myopic astigmatism. For equivalent corrections, mean EOZ were smaller for hyperopia than for myopia by −8 %±8 % in diameter, or by −15 %±13 % in surface. As well, the impact of the defocus correction in reducing the size of the EOZ is much stronger in hyperopia than in myopia.
Multivariate correlation analysis showed that absolute and relative differences between FOZPost and FOZPre, as well as, between EOZ and POZ were larger for smaller POZ or for larger Defocus corrections.
For our analyses, the threshold value of 0.375 D for determining EOZ was arbitrarily chosen based upon the fact that with simple spherical error, degradation of resolution begins for most people with errors between 0.25 D and 0.50 D, and a similar value can be found for astigmatism. If other value was used, the general conclusions derived in this study will still hold. However, the numerical values can be a bit larger for threshold values larger than 0.375 D, and smaller for values below 0.375 D. We have actually re-run the analyses for 0.25 D and 0.50 D thresholds, and found −18 % smaller EOZ and +10 % larger EOZ respectively.
For all methods, our search algorithm is an “increasing diameter” analysis, this ensures that the smallest EOZ condition is found. Finally, our search was set to start from 4-mm upwards, i.e. 3.99mm is the smallest EOZ that could be found. We have done that because for very small analysis diameters, the Zernike fit seems to be less robust, mostly due to the decreasing sampling density within the unit circle.
The magnitude of astigmatism corrected could affect the diameter at which the EQ of RMSho is greater than 0.375 D. For example, an eye with 1 DS/+3 D of hyperopia vs. 2.5 DS of hyperopia would have different EOZ and FOZs based on the definition. Argento et Cosentino5 reported that larger optical zones decrease postoperative high-order aberrations. They found the measured high-order aberrations to be less in eyes with larger optical zones.
We have used a similar approach to the one used by Tabernero et al.38 to determine the functional optical zone (FOZ) of the cornea pre and postoperatively. They observed a reduction from FOZPre of 9.1-mm to FOZPost of 6.9-mm. Noteworthy and opposed to our findings, they did not find a greater contraction of FOZ for increasing corrections.
Qazi et al.1 using a different approach observed over a sample of eyes similar to ours, that hyperopic treated eyes, on average, had larger topographic FOZs after LASIK, but with less uniformity of curvature and power change than myopic eyes.
Although POZ, TZ, and TAZ are parameters defined by the laser treatment algorithms, EOZ must be determined postoperatively (from the differences to the baseline) and may change with time because of healing and biomechanical effects. In the same way, it would be possible that the FOZ were larger postoperatively than it was preoperatively, or that the FOZ could be larger than the POZ or even than the TAZ. Figure 3 shows the evolution and change of the OZ with time. FOZ and EOZ showed smaller values for shorter follow-up times and continues increasing from 1, to 3 and 6-months after treatment. This behaviour is consistent with other observations of the change of induced aberrations and quality of vision with time39, in which the amount of induced aberrations reduces with time getting closer to the original aberration pattern for longer follow-up times. Long-term follow-up on these eyes will help determine whether these accurate results also show improved stability compared to previous experiences.
In conclusion, our results suggest that wave aberration can be a useful metric for the analysis of the effective optical zones of refractive treatments or for the analysis of functional optical zones of the cornea or the entire eye by setting appropriate limit values.
Conflict of interestDr. Camellin has no proprietary interest in the materials presented herein.
Arba-Mosquera is employee at SCHWIND eye-tech-solutions.


