


Digital eye strain (DES; computer vision syndrome) is a common cause of symptoms when viewing digital devices. Low-powered convex lenses (adds) have been recommended for the condition and “accommodative support” designs developed on this premise. The present research reports the extent to which dry eye is present in this population and the effect of convex lenses on symptoms and visual performance.
MethodsThe CVS-Q instrument was used to select pre-presbyopic adults with the symptoms of DES. Participants received a full eye examination including an assessment of dry eye with a modified SANDE questionnaire and using DEWS I criteria. The immediate effect of low-powered convex lenses (low adds: +0.50D, +0.75D, +1.25D) was investigated using subjective preference and a double-masked comparison with plano lenses with the Wilkins Rate of Reading Test (WRRT). Throughout this testing, participants wore their full distance refractive correction, based on non-cycloplegic retinoscopy and subjective refraction.
ResultsThe signs and symptoms of dry eye were frequently present. Most participants reported a subjective preference for low adds, with +0.75D the most commonly preferred lens. Low adds (+0.50D and +0.75D; but not +1.25D) were associated with significantly improved performance at the WRRT. One quarter of participants read more than 10% faster with these additional convex lenses.
ConclusionsThe study population was aged 20–40y and mostly worked on desktop computers. It is possible that +1.25D add may be more advantageous for people who are older or work more at closer viewing distances. Many symptomatic users of digital devices report a preference for low adds and use of these lenses is often associated with an improvement in reading performance.
La fatiga digital (DES; síndrome visual informático) es una causa común de síntomas, a causa de la visualización de dispositivos digitales. Se han recomendado lentes convexas de baja potencia para esta situación, así como diseños de “apoyo acomodativo” desarrollados sobre la base de este principio. Los informes de investigación actuales reportan el alcance de la presencia de ojo seco en esta población, así como el efecto de las lentes convexas en los síntomas y el desempeño visual.
MétodosSe utilizó el instrumento CVS-Q para seleccionar adultos pre-presbiópicos con síntomas de DES. Se realizó un examen visual completo a los participantes, incluyendo valoración de ojo seco con un cuestionario SANDE modificado, y utilizando los criterios DEWS I. Se investigó el efecto inmediato de las lentes convexas de baja potencia (adiciones bajas: +0,50D, +0,75D, +1,25D) utilizando la preferencia subjetiva y una comparación doble ciego con lentes planas mediante la prueba Wilkins Rate of Reading Test (WRRT). A lo largo de esta prueba, los participantes utilizaban su corrección refractiva de distancia completa, basada en retinoscopia no ciclopéjica y refracción subjetiva.
ResultadosLos signos y síntomas del ojo seco estuvieron frecuentemente presentes. Muchos participantes reportaron una preferencia subjetiva de bajas adiciones, siendo las lentes de +0,75D las más comúnmente preferidas. Las bajas adiciones (+0,50D y +0,75D, pero no +1,25D) se asociaron a un desempeño significativamente mejorado en la prueba WRRT. Un 25% de los participantes leyeron un 10% más rápido con estas lentes convexas adicionales.
ConclusionesLa edad de la población de estudio fue de 20 a 40 años, trabajando la mayoría de dichos sujetos en ordenadores de mesa. Es posible que la adición de +1,25D sea más ventajosa para personas de mayor edad, o que trabajen más con distancias de visualización más próxima. Muchos usuarios de dispositivos digitales sintomáticos reportan una preferencia por bajas adiciones, asociándose a menudo el uso de estas lentes a una mejora del desempeño lector.
Computer vision syndrome (CVS) describes the collection of ocular and visual symptoms experienced by users of visual display units. This term is often nowadays replaced with digital eye strain (DES). Up to 40% of adults and 80% of teenagers report significant symptoms associated with using digital devices.1 There has been a plethora of research on DES, summarised in excellent reviews.1–5
DES symptoms include eyestrain, ocular discomfort, tired eyes, headaches, blurred vision, double vision, and dry eyes.2–6 These symptoms have been classified as external, associated with dry eyes (burning, tearing, dryness, irritation); or internal, related to refractive, accommodative or binocular vision anomalies.7,8 There are several reasons why dry eye is a significant contributor to DES: the office environment tends to be dry, screens often are not in the usual downward gaze reading positions associated with hard copy reading, and computer use is associated with incomplete blinks9 and reduced blink rates.10–12
Low levels of uncorrected astigmatism (0.50–1.00DC) produce a significant increase in DES symptoms whilst reading computer screens,13 and in contact lens wearers.14 Accommodative problems can cause asthenopia.15,16 Clinically, there is little evidence of a difference between accommodation viewing digital devices and hard copy tasks,3 but visual fatigue may be related to low-frequency micro-fluctuations of accommodation.6 Vergence problems also can cause asthenopia,15,16 and have been implicated in DES.6
Other possible causes of DES include changes in pupil size during and after computer tasks which may result in spasms of the sphincter pupillae.17 Blue light exposure from digital screens has also been suggested as a possible mechanism of discomfort.18 For susceptible individuals, the pattern caused by lines of text, and flicker from monitors, can cause a sensory form of visual stress that may be alleviated by coloured filters or modifying the spectral output of the display,19–22 although this is controversial.23
To quantify the prevalence of visual and ocular discomfort many studies have employed questionnaires,24–27 whilst others8,9,28–30 have followed the approach developed by Hayes et al.31 The Computer Vision Syndrome Questionnaire (CVS-Q),32,33 is a validated questionnaire, has psychometric properties that fit the Rasch model, and has adequate validity and reliability. Whilst the CVS-Q is a tool for both diagnosis and analysis of severity of DES, it does not differentiate the proportion of internal or external factors responsible.
Validated questionnaires have been used to diagnose and monitor dry eye disease.34 The two most commonly used questionnaires are the McMonnies Dry Eye Index and The Ocular Surface Index (OSDI), with the latter thought to be the more reliable.35–37 The “Symptom Assessment iN Dry Eye” (SANDE) is a brief questionnaire comprising two questions and has been shown to have good correlation and negligible score differences from those found with the OSDI.38 The original SANDE questionnaire involved visual analogue scales (VAS) addressing two questions: “How often, on average, do your eyes feel dry and/or irritated?” (VAS ranges from Rarely to All The Time) and “How severe, on average, do you feel your symptoms of dryness and/or irritation are?” (VAS ranges from Very Mild to Very Severe). For the present research, this was modified (mSANDE) to use a verbally described scale of 1–100.
Whilst validated questionnaires are useful in the diagnosis of dry eye, these should be complemented with a battery of clinical tests as subjective symptoms do not always match objective assessment. In this study we employed criteria based on the 2007 DEWS report39 to estimate the severity of dry eye. The updated DEWS II outcomes were published after out experimental work started.
Treating DES may involve treating either a single cause (e.g., dry eye) or a combination of causes such as dry eye and refractive error. Interventions for dry eye include artificial tears39 and dietary supplements.40,41 Significant refractive errors should be corrected, including the appropriate near addition for presbyopes. If accommodative and vergence anomalies are believed to be causing significant symptoms they should also be managed appropriately.15,16
In recent years, several new spectacle lens designs have been introduced for pre-presbyopes that have a progressive power profile aimed at alleviating symptoms in the modern workplace. Typically, these “accommodative support” or “power boost” designs have “adds” ranging from +0.50DS to +1.25DS, with the aim of easing the accommodative demand of long hours on digital devices, some of which may be held closer than conventional reading materials.42 This raises the question of whether low adds are likely to alleviate some of the symptoms of DES in pre-presbyopes.
An early review of research on the effects of low power plus lenses found insufficient evidence.43 Some studies show no benefit from low plus lenses.44,45 Interestingly, some masked studies show an effect of plus lenses whilst this has not been the aim of the study.46,47 However, there have been few double-masked randomised controlled trials and the benefits of low-powered adds remain controversial.48
DES is detected by symptoms and it is understandable that research on this topic often concentrates on symptoms. However, most workers use computers to aid productivity and it seems relevant to consider whether interventions might also improve performance.
The Wilkins Rate of Reading Test (WRRT)49 was designed to test the effect of coloured overlays on reading in children with sensory visual stress.50 The test is designed to be visually demanding but requires only very basic reading skills so performance is minimally affected by language skills. The WRRT has been used in a variety of research topics, including: sensory visual stress,19 head tilt,51 prismatic corrections,52 autistic children,53 low refractive corrections,45 dry eye,54,55 and low dose atropine.56 The WRRT has emerged as a useful test for assessing visual performance when reading and has shown that dry eye disease impacts on reading rate.54
The aim of the present research is to carry out a double-masked investigation of the effect of low adds on reading rate and subjective preference in pre-presbyopes with symptoms of DES.
MethodsDesignThe research is a cross-sectional study of factors relevant to DES incorporating a double-masked randomised controlled cross-over experiment using the WRRT. This cross-over phase is an investigation of the immediate effect of convex (low plus) lenses.
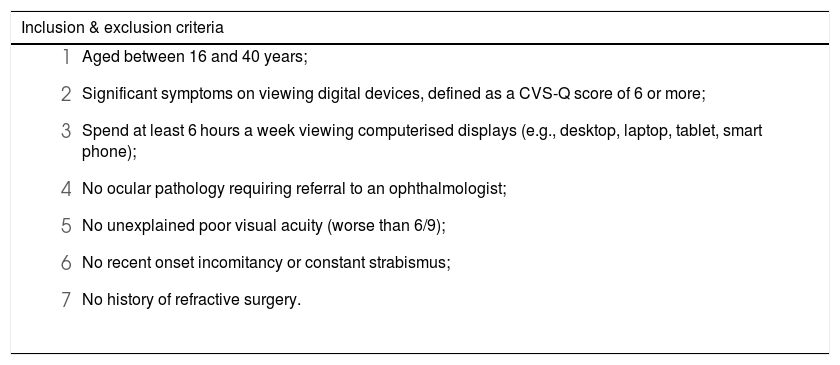
ParticipantsParticipants were recruited from local employers, newspaper advertisements, posters (e.g., at a local university), leaflet drops, and by “snowball effect” from participants spreading the word to colleagues. The inclusion and exclusion criteria are given in Table 1.
Participant inclusion & exclusion criteria.
| Inclusion & exclusion criteria |
|---|
|
The research followed the tenets of the Declaration of Helsinki and was approved by the Institute of Optometry Research Ethics Committee.
Potential participants who consented to participate completed the CVS-Q and mSANDE questionnaires and those who fulfilled entry criteria 1–3 (Table 1), were asked to attend for an appointment when the tests in Table 2 were carried out. Participants were asked to estimate the typical number of hours per day they used digital devices.
Clinical tests. DEWS,57 dry eye workshop.
| Category | Test |
|---|---|
| Questionnaire | CVS-Q (validated DES/CVS questionnaire)32mSANDE (dry eye questionnaire)38 |
| Ocular pathology | Direct and indirect ophthalmoscopy (dilation if required) & biomicroscopy |
| Dry eye assessment | Slit lamp biomicroscopy, DEWS grading57 and protocols for assessment |
| Refractive error | Non-cycloplegic retinoscopy & subjective refraction. For participants who habitually wear contact lenses, an over-refraction was performed. |
| Visual acuity (VA)a | LogMAR on computerised LogMAR chart |
| Ocular motility | Pen torch in cardinal positions of gaze |
| Ocular alignmenta | Cover test |
| Ocular alignment and vergencea | Cover test recovery, Mallett fixation disparity test, fusional reserves, dissociated phoria measurement, vergence facility, near point of convergence |
| Accommodationa | RAF rule±1.50D flippersMEM retinoscopy |
During the eye examination, in the unlikely event that any pathology was detected that requires medical attention, the participant was referred according to local protocols and excluded from the research study.
At the end of the eye examination, participants underwent an investigation of the immediate effect of convex lenses. Participants were informed that the purpose of this part of the research is to compare different types of reading lenses. This comprised two parts; the first part involved testing speed of reading and the second part investigated subjective preference. Throughout this testing, participants wore the subjective refractive findings of the research optometrist (maximum accepted plus for distance vision), in addition to the “adds” specified below.
A workstation was set up to simulate the participant’s workplace. This consisted of a laptop computer, placed at the distance the participant selected as matching their work monitor viewing distance and direction of gaze. Participants then undertook the WRRT (standard paper version) at this distance and direction of gaze, after a practice run, under four different conditions.45,49,52,56 The four conditions consisted of 4 pairs of trial lenses of powers plano (control condition), +0.50, +0.75, and +1.25 (not presented in this order). The lenses were standard bi-convex full-aperture optometric trial lenses inserted in a typical optometric trial frame, which also included a correction for the participant’s refractive error (subjective findings at the research appointment). The identity of the interventions was not known to either the researcher or the participant. Each intervention was randomly assigned a letter (A–D), and the order of the interventions was ABCDDCBA. The researcher was positioned out of sight but within earshot (to record results) of the participant, so the process was double-masked.
The second part involved the participants viewing the WRRT text through the four conditions, as above, and at the same working distance. They were asked to decide whether each pair of lenses (identity still masked) made their perception of text better or worse, and by how much on a scale of 0–5 where 0 indicates no difference.
The placebo control condition was a plano lens with a visible anti-reflection coating (the experimental interventions were all uncoated trial lenses). The rationale behind using a visible anti-reflection coating as a placebo is as follows. When the lenses for the plus lens conditions are introduced, participants may experience a slight magnification effect that could psychologically generate a placebo effect, even if the intervention is ineffective from an optical perspective. Plano control lenses would not create such an effect, and so participants may realise these were an inert control, compared with low plus interventions. If so, the placebo effect resulting from the magnification might be misinterpreted as a treatment effect. Therefore, we sought to use a control condition with a feature that would, from casual inspection, have a property that may be expected to generate a minimal placebo effect. An early generation anti-reflection coating was used that provides a “coloured bloom” reflection from the front of the lens. Care was taken not to use a modern anti-reflection coating whose properties have been developed to filter out blue light to potentially benefit computer users. This was because the goal of the control intervention was to act as an inert placebo control.
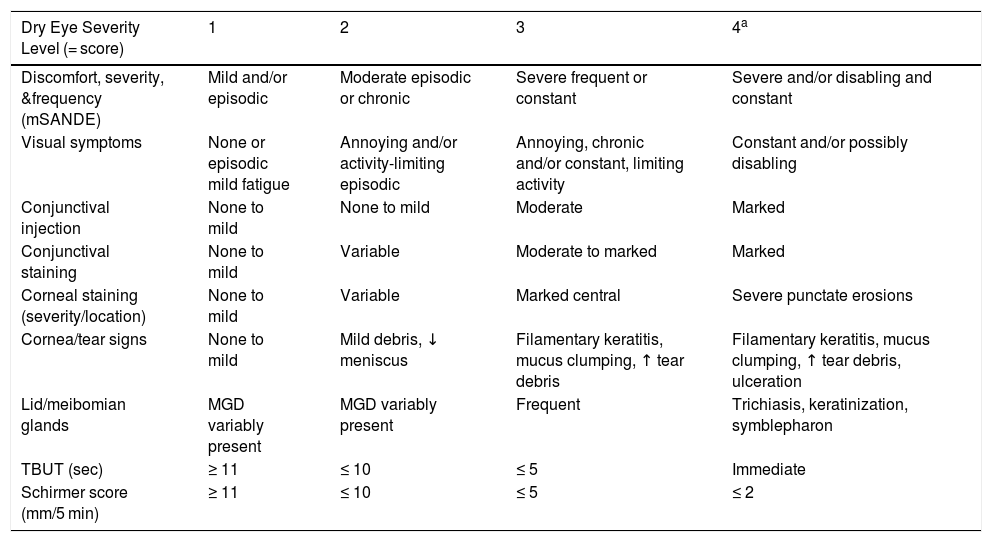
Statistical analysisThe DEWS (I) study criteria57 were used for the assessment and grading of dry eye (Table 3). Each participant was given a score by calculating the sum of each dry eye severity level reached (grades 1–4; the columns in Table 3) for the 9 items investigated (the rows in Table 3). Since there are 9 symptoms and signs (the rows) and four levels of each of these (the columns), the maximum score is 36. Data for the first row, relating to discomfort, originate from the mSANDE questionnaire.
Dry eye grading, developed from DEWS gradings.57
| Dry Eye Severity Level (= score) | 1 | 2 | 3 | 4a |
|---|---|---|---|---|
| Discomfort, severity, &frequency (mSANDE) | Mild and/or episodic | Moderate episodic or chronic | Severe frequent or constant | Severe and/or disabling and constant |
| Visual symptoms | None or episodic mild fatigue | Annoying and/or activity-limiting episodic | Annoying, chronic and/or constant, limiting activity | Constant and/or possibly disabling |
| Conjunctival injection | None to mild | None to mild | Moderate | Marked |
| Conjunctival staining | None to mild | Variable | Moderate to marked | Marked |
| Corneal staining (severity/location) | None to mild | Variable | Marked central | Severe punctate erosions |
| Cornea/tear signs | None to mild | Mild debris, ↓ meniscus | Filamentary keratitis, mucus clumping, ↑ tear debris | Filamentary keratitis, mucus clumping, ↑ tear debris, ulceration |
| Lid/meibomian glands | MGD variably present | MGD variably present | Frequent | Trichiasis, keratinization, symblepharon |
| TBUT (sec) | ≥ 11 | ≤ 10 | ≤ 5 | Immediate |
| Schirmer score (mm/5 min) | ≥ 11 | ≤ 10 | ≤ 5 | ≤ 2 |
In view of the sample size of >100, Kolmogorov–Smirnov tests were used to test the normality of continuous variables, and parametric and non-parametric analyses were used as appropriate. When correlations were investigated, if one or more of the variables had a non-parametric distribution, the Kendall tau correlation was used. Proportions and cross-tabulations (contingency tables) were analysed with Pearson’s chi-squared test.
The effect of different lens options on WRRT was investigated using a repeated measures ANOVA, when appropriate corrected for lack of sphericity. A significant correlation was investigated further with post hoc analyses.
Primary analyses were planned analyses of the key variables to address the research aim. Secondary analyses were exploratory in nature, for example to explore the relationship between the key variables.
ResultsDescriptive summary of study populationA total of 107 participants were seen in the research, of whom 36% were male. The mean age was 31y (SD 5.25; range 20–40y).
No participants were excluded for criteria 4–6 in Table 1 and only one was excluded for criterion 7. The refractive data are summarised in Table 4. Other optometric characteristics will be described in a separate publication, which will also consider the impact of different criteria for prescribing optometric interventions on the proportion of participants who would have been prescribed optometric interventions. The dry eye questionnaire (mSANDE) and DEWS data are considered here, and the relationship between these data and results of CVS-Q, WRRT, and subjective preference for convex lenses.
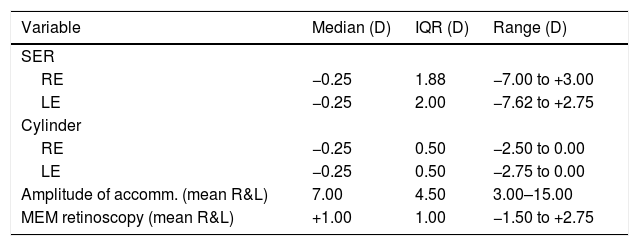
Summary of refractive data. SER, spherical equivalent refraction; accomm., accommodation; MEM, monocular estimate method. The amplitude of accommodation and MEM retinoscopy were measured through spectacles or contact lenses if these were habitually worn.
| Variable | Median (D) | IQR (D) | Range (D) |
|---|---|---|---|
| SER | |||
| RE | −0.25 | 1.88 | −7.00 to +3.00 |
| LE | −0.25 | 2.00 | −7.62 to +2.75 |
| Cylinder | |||
| RE | −0.25 | 0.50 | −2.50 to 0.00 |
| LE | −0.25 | 0.50 | −2.75 to 0.00 |
| Amplitude of accomm. (mean R&L) | 7.00 | 4.50 | 3.00–15.00 |
| MEM retinoscopy (mean R&L) | +1.00 | 1.00 | −1.50 to +2.75 |
The CVS-Q data differ significantly from a normal distribution (Kolmogorov-Smirnov test, p = 0.012). The median is 16 (IQR 12, range 6–36). The mSANDE data also differ significantly from a normal distribution (Kolmogorov-Smirnov test, p = 0.009). The median is 53 (IQR 31, range 1–90).
The data on number of hours digital device use per day differ significantly from a normal distribution (Kolmogorov-Smirnov test, p < 0.0001). The frequency distribution was inspected, and the non-normality arises because a disproportionately high number of participants (nearly 40%) spend between 7.5 and 8.5 h a day on the computer. Clearly, this artefact results from a typical working day. The median is 8 h a day (IQR 3, range 1–13).
Is there a subjective preference for low adds?The process of asking participants which of the lens options they preferred when viewing text on a computer display was introduced after the start of the research. Of the 84 participants for whom these data were available, 57 (68%) were able to choose one option as preferable, 17 chose two options as jointly preferable, 7 chose 3 equally as best and two could not choose. These data are summarised in Fig. 1. To determine the frequency of lens choice and to allow for participants who chose more than one lens, a ‘weighted’ system was used where a score of 1.00 was given when only one lens was chosen, 0.50 when 2 lenses were equally chosen, a score of 0.33 for 3, and a score of 0.25 when 4 lenses were chosen as equally preferred. Using this method, it was found that 20% preferred the control lens; 25%, +0.50; 47%, +0.75; and 8%, +1.25.

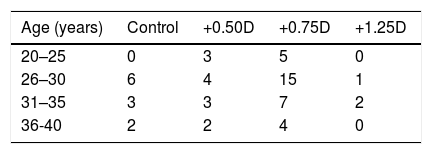
Participants were divided into four age categories: 20–25y (N = 8); 26–30y (N = 26); 31–35y (N = 15); and 36–40y (N = 8). These categories only include those who chose one lens power as their preferred (68% of the total who performed the subjective preference test) and the remainder chose two or more lenses as their preferred lens. The relationship between lens choice and age is shown in Table 5.
Chi-square analysis of the data in Table 5 reveals that there is a significant relationship between subjective lens choice and age (Pearson Chi-Square, p < 0.05; Phi and Cramer’s V symmetric measures both also gave p < 0.05). This is illustrated in Fig. 2, revealing that a disproportionate number of the age group 26–30y chose the +0.75D lens option.
Do low adds improve reading speed?
The WRRT data for each of the four conditions does not significantly depart from a normal distribution (Kolmogorov–Smirnov test, p = 0.20). The minimum and maximum WRRT for any participant in any condition were 97 and 264 wpm. WRRT data are summarised in Fig. 3.

A repeated measures ANOVA was carried out to determine the effect of different add options on WRRT performance. Using a Greenhouse-Geisser correction for the lack of sphericity (Mauchly’s test of sphericity, p = 0.044), the mean scores of WRRT for the different conditions were statistically significantly different (F = 16.531 p < 0.0001). Post hoc analyses, adjusted for multiple comparisons, revealed that the +0.50 (p < 0.001) and +0.75 (p < 0.0001) conditions were significantly different from the control condition, but the +1.25 condition did not differ significantly from the control condition (p = 1.00). The +0.50 differed from the both the +0.75 and +1.25 lens (p < 0.05), whilst the +0.75 format also differed from the +1.25 condition (p < 0.0001).
The frequency for which lens condition gave the best reading rate was analysed. Of the 107 participants, 12% read fastest with the control lens, 19% with +0.50, 51% with +0.75 and 18% with +1.25. These figures take into account when subjects read equally well under more than one condition using the same method as described above for subjective choice (5 participants read equally fast with more than one lens; see Fig. 4).

The WRRT data were also analysed by comparing the proportion of participants who read faster with any plus power compared to the control lens (participants did not know which was the control intervention), using previously published criteria for significant performance improvement with the WRRT (see Discussion). Of the 107 participants, 24% read more than 10% faster with convex lenses and 8% read more than 15% faster with adds than control.
The influence of age was investigated using the four age categories described above. Since there were very few ties for the fastest lens condition (5 participants out of 107 read equally fast with more than one lens condition), only the data for participants who read fastest with one lens (N = 102) were analysed. This is illustrated in Fig. 5 and Chi-square analysis reveals that there is a significant relationship between the lens that gave the fastest reading speed and age (Pearson Chi-Square <0.001, Phi and Cramer’s V symmetric measures both p < 0.001). As with subjective preference, the graph clearly reveals that there is a disproportionate number of participants who perform best with the +0.75D lens in the 26–30 age group.
 and age group.")
Participants’ subjective choice for preferred lens was compared with the lens that gave them best performance with the WRRT. Data on subjective preference were available for 84 of the 107 participants. First, if one only considers the 57 participants who were able to decide on one lens as preferred, there was a tendency for the ranking of lens preference to correlate with WRRT performance (Kendall correlation 0.711, p = 0.052). The subjectively preferred lens agreed with the lens to give best WRRT performance in 28% of cases. Second, including the participants who ranked more than one lens as their equal best lens, this agreed with the lens that gave best WRRT performance in 49% of cases and the Kendall correlation was 0.356 (p = 0.072).
DEWS dataThe combined DEWS score differs significantly from a normal distribution (Kolmogorov-Smirnov test, p < 0.0001). The median is 12 (IQR 2.00, range 9.00–17.00).
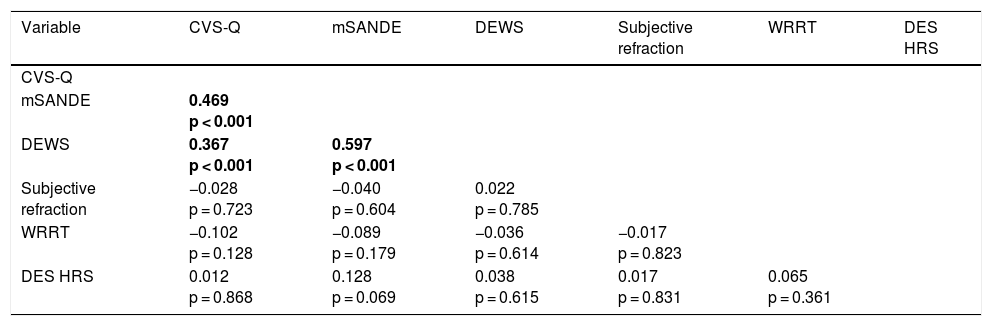
Correlations between main variablesIn view of the non-parametric nature of some variables, correlations were tested using the non-parametric Kendall tau correlation, which also allows the inclusion of subjectively preferred lens and the add power that gave best performance at WRRT. The correlations are illustrated in Table 6. Multiple correlations in a correlation matrix of this type need to be viewed with caution and only significance at the level of p < 0.001 is highlighted (in bold) in the table.
Correlation matrix (Kendall tau) between key variables. Correlations that are significant at p < 0.001 are in bold the first time they occur. For the DEWS correlations with CVS-Q and mSANDE, discomfort (which was derived from the SANDE) was excluded from the DEWS scores to prevent spurious high correlations. DES HRS, number of hours DES use per day.
| Variable | CVS-Q | mSANDE | DEWS | Subjective refraction | WRRT | DES HRS |
|---|---|---|---|---|---|---|
| CVS-Q | ||||||
| mSANDE | 0.469 p < 0.001 | |||||
| DEWS | 0.367 p < 0.001 | 0.597 p < 0.001 | ||||
| Subjective refraction | −0.028 p = 0.723 | −0.040 p = 0.604 | 0.022 p = 0.785 | |||
| WRRT | −0.102 p = 0.128 | −0.089 p = 0.179 | −0.036 p = 0.614 | −0.017 p = 0.823 | ||
| DES HRS | 0.012 p = 0.868 | 0.128 p = 0.069 | 0.038 p = 0.615 | 0.017 p = 0.831 | 0.065 p = 0.361 |
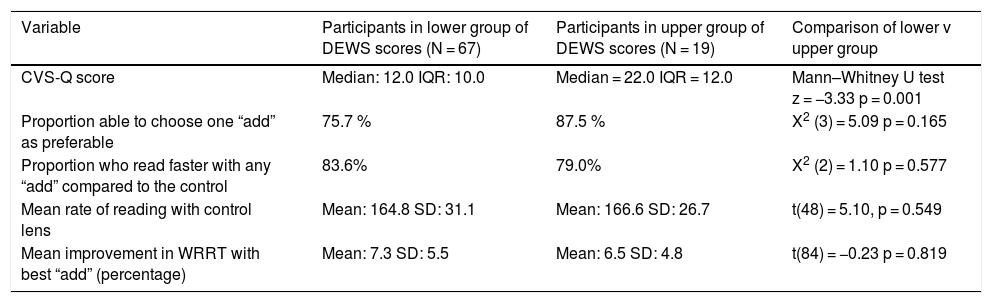
The contribution of dry eye to DES was further explored by contrasting the participants with most marked dry eye with those exhibiting least symptoms and signs of dry eye, based on the DEWS scores (including mSANDE symptoms; Table 3). The initial plan was to divide the participants into tertiles, but this was problematic because the range of DEWS scores is narrow (9–17), with 20% of participants having an identical score of 13. After careful consideration of Table 3 and the distribution of scores, the participants were divided into three groups: negligible dry eye (score 0–12, N = 67); borderline dry eye (score 13, N = 21); and significant dry eye (score >13, N = 19). The borderline group were not considered further. The key findings in this research were contrasted between the participants in the negligible dry eye and significant dry eye groups. The results of these analyses are reproduced in Table 7.
Comparison of key findings, comparing participants with negligible dry eye to those with significant dry eye (based on DEWS scores).
| Variable | Participants in lower group of DEWS scores (N = 67) | Participants in upper group of DEWS scores (N = 19) | Comparison of lower v upper group |
|---|---|---|---|
| CVS-Q score | Median: 12.0 IQR: 10.0 | Median = 22.0 IQR = 12.0 | Mann–Whitney U test z = −3.33 p = 0.001 |
| Proportion able to choose one “add” as preferable | 75.7 % | 87.5 % | X2 (3) = 5.09 p = 0.165 |
| Proportion who read faster with any “add” compared to the control | 83.6% | 79.0% | X2 (2) = 1.10 p = 0.577 |
| Mean rate of reading with control lens | Mean: 164.8 SD: 31.1 | Mean: 166.6 SD: 26.7 | t(48) = 5.10, p = 0.549 |
| Mean improvement in WRRT with best “add” (percentage) | Mean: 7.3 SD: 5.5 | Mean: 6.5 SD: 4.8 | t(84) = −0.23 p = 0.819 |
The participants’subjective lens choice was inspected in the two new subgroups to see if either subgroup departed from the trend observed in the whole sample and illustrated in Fig. 1. Both subgroups showed a similar trend to Fig. 1, with +0.75D the most popular choice and +0.50D the second most popular choice. Similarly, the WRRT mean performance with each lens (Fig. 3) was replotted in the two new subgroups. These revealed a similar trend to that in Fig. 3, with no diminishing of the pre-eminence of +0.75 in either sub-group.
DiscussionSummary of main findingsThe finding that approximately two thirds of our population with DES were female is in agreement with the literature.1,5 The CVS-Q data highlight the symptomatic nature of our sample, who used digital devices for a median of 8 h a day.
Considering subjective preference, the most popular add is +0.75, preferred by almost half of participants, with one quarter preferring +0.50 and only 8% preferring +1.25. Fig. 1 shows that approximately half of those whose preference was for +1.25 placed this joint first choice with +0.75. It is interesting that a consideration of the relationship between age and subjective lens preference (Fig. 2) did not reveal any tendency for older participants to choose higher power adds.
The WRRT data confirmed the subjective preference, with half the participants performing best with +0.75 (Fig. 4). Analysis by repeated measures ANOVA revealed that performance with both the +0.50 and +0.75 options was significantly better than with the control lens, but performance with the +1.25 option was not significantly better than with the control lenses (Fig. 3). As with subjective preference, the data do not indicate a tendency for older participants to perform better with higher power convex lenses (Fig. 5), although it should be noted that the age range is pre-presbyopic.
Although the correlation between the add power that was preferred and the add power that gave best performance was higher than one would expect from chance, there were clearly some participants whose subjective preference differed from the add that gave them best performance. This is not surprising, since the factors that would influence subjective preference (including perceived comfort) may differ from those affecting performance.
The influence of dry eyeThe SANDE questionnaire is typically used to monitor change,38,58,59 although the correlation matrix supports previous research60 indicating a role in detecting dry eye. Indeed, considering the well-known challenge in dry eye practice of clinical tests only poorly predicting symptoms,61 it is encouraging that the present study obtained a significant correlation (Table 6) between the mSANDE questionnaire result and the DEWS signs (rtau = 597, p <0.001; note, the discomfort score was excluded from the DEWS score for this correlation).
The significant correlation between the CVS-Q and mSANDE questionnaires (rtau = 0.469, p < 0.001) replicates previous work highlighting the importance of dry eye in the aetiology of DES. In 2003 Sheedy and colleagues identified two different causes of asthenopia, external symptom factor (dry eye) and internal symptom factor (refractive, accommodative, and binocular anomalies).7 This classification has subsequently been applied to DES.2,5 It seems likely that, within a cohort of patients with DES, there will be some whose symptoms are wholly attributable to external factors (dry eye), some with symptoms wholly attributable to internal factors, and some with a combination of internal and external aetiology. The low correlations between most of the variables in Table 6 supports a multifactorial aetiology for DES. Therefore, it should not be expected that convex lenses will help all people with DES.
This issue was further explored with the subgroup analysis, comparing participants whose DEWS scores indicate negligible dry eye with those whose scores indicate significant dry eye. Unsurprisingly, the subgroup with significant dry eye had statistically significantly worse CVS-Q scores. However, in key variables relating to the effect of low adds, the two subgroups did not differ significantly (Table 7). These results support previous findings that dry eye is in some cases a contributory factor to DES, but indicate that it is independent of the benefit from low plus lenses.
Why is the +0.75 add best for so many participants?An interesting finding is the statistically significant tendency for the add that gives best performance and that is subjectively preferred to be +0.75. It is perhaps not surprising that almost twice as many participants preferred +0.75 (47%) to +0.50 (25%), since both powers are similar in effect, but +0.75 would be likely to give more magnification and possibly clarity than +0.50. It is perhaps more surprising that only 8% of participants preferred +1.25. This is unlikely to be a chance finding because it is strongly supported by the WRRT data. With the WRRT test, care was taken for the procedure to be double masked, for the lens options to be presented randomly rather than in order of ascending lens power, and for the sequence of testing (ABCDDCBA) to be counterbalanced to control for practice or fatigue effects.
Fig. 2 and Fig. 5 reveal that participant age does not explain the plus addition that is preferred or that gives best performance. A detailed analysis of accommodative and binocular vision variables will be presented in a future publication that investigates the influence of different approaches to classifying and diagnosing binocular vision and accommodative anomalies. Suffice it to say here the pre-eminence of +0.75 is not explained by accommodative amplitude or lag, nor by any consistent pattern in the results of binocular vision tests. As noted in the preceding section, dry eye does not account for the pre-eminence of +0.75. It seems likely that two factors explain the supremacy of +0.75 over +1.25. First, the pre-presbyopic age range of the participants, 20–40 years, is likely to be relevant. We speculate that if participants had been included who were aged in the early presbyope category (e.g., aged 40–45 years), an age effect may have been apparent with +1.25 more likely to help this age group.
Second, the method that was used for the subjective preference and for the WRRT test was to view text on a computer placed at a distance that the participant selected as matching their typical viewing distance for digital devices. This viewing distance was measured (but was not recorded) and ranged from approximately 40−110 cm. For the participants where the monitor was further than 80 cm, the lens power of +1.25 would have been too strong. Also, proximal accommodation is likely to play a role, so even for some participants for whom the text was placed at a distance close to 80 cm, the combined effect of +1.25 lenses and proximal accommodation may have caused them to be over-plussed with this lens.
Our recruitment concentrated on office workers, with some university students also included. Most of these people predominantly used desktop computers, with a significant minority using laptops and very few predominantly using tablets or smartphones for work. We speculate that if our sample had included more people whose use of digital devices predominantly involved tablets or smart phones, which tend to be held closer,42 we would have found more participants preferring the +1.25 option.
Comparison with previous research using the WRRTThe Wilkins Rate of Reading Test (WRRT)49 is designed to assess the impact of visual factors on reading and requires only very basic reading skills, so performance is minimally affected by language skills. The WRRT has been used in a variety of research studies.45,51–56 Early research with this test used a “within subjects” improvement in performance of 5% as a meaningful improvement.49 However, although in research using repeated measures statistics an improvement as small as 2.9% can be statistically significant,49 Kriss and Evans questioned the clinical significance of a 5% criterion and suggested a 10% criterion.62 More recently, a 15% criterion has emerged in research on coloured filters for visual stress as indicating an improvement that is likely to exceed any due to random variation.20 This has been applied retrospectively to earlier research19 and has been used in recent proposed diagnostic criteria for sensory visual stress.63 In the present research, we use both the 10% and 15% criteria. The fact that approximately one quarter of our population with DES read more than 10% faster with low adds indicates a performance benefit in some cases.
Previous research has used the WRRT to investigate the effect of low refractive corrections on reading performance.45 This study showed that correcting small hypermetropic refractive errors, up to +2.00D, in pre-presbyopes does not significantly improve performance at the WRRT. This study differed from the present research in that size lenses were used as the control intervention, although this is unlikely to be a factor because the size lenses were shown to be inert.52 A more likely explanation of the absence of a treatment effect of low powered convex lenses in that research in contrast to the presence of an effect in the present research, is that in the previous study participants were not selected as having symptoms whereas in the present research all participants had symptoms of DES.
Strengths and limitationsA strength of the research is the large sample size of over 100 individuals. Also, the individuals came from a variety of workplaces and, unlike some previous research on DES, were not predominantly drawn from a young student population.
It is possible that a cycloplegic refraction may have detected latent hypermetropia in a few cases that was not detected by the non-cycloplegic refraction used in this research. However, this seems unlikely for a population aged 20–40y. Additionally, the research sought to produce results that are transferable to routine optometric practice, where cycloplegia is typically not used in the optometric assessment of pre-presbyopic adults.
Participants viewed the WRRT through standard full-aperture trial lenses in an optometric trial frame and it is conceivable that aberrations or prismatic effects could have influenced the results or impacted on binocular vision. This seems unlikely because the trial frame was horizontally and vertically centred to align with the visual axis. The size of the WRRT paragraphs (7 × 3.5 cm) does not require eye movements that are far off-axis. Additionally, most participants had low refractive errors (Table 4). The standard paper version of the WRRT was used because it was not possible to use the type of monitor each patient habitually viewed.
In the WRRT the participant is only required to read the text for a maximum of one minute at a time. The test designer implied that the visually intensive nature of the WRRT allows it to detect a beneficial effect that would otherwise require longer test periods,64 and this seems to be the case for investigating sensory visual stress, where the symptoms typically only occur after reading normal sized text for longer periods.65 However, a limitation of the present research is that there may be long-term benefits from low adds in DES that are not identified in this study. Also, for adult skilled readers it is possible that there is a “ceiling effect” with the test, which could mean that small variations in motivation/attention have a disproportionate effect on performance compared with the interventions under investigation. However, the significantly faster performance with +0.50 and +0.75 additions indicates that such a confounder did not greatly impair the usefulness of the test.
The main goal of this paper is to investigate whether, in a broad cross-section of symptomatic pre-presbyopic adult computer users, low adds are helpful, in addition to full distance refractive error correction. Our finding that in many cases low adds are helpful, raises questions about prescribing criteria and the prevalence in our sample of accommodative and binocular vision anomalies. These questions are not straightforward to address because of the lack of agreement on optometric prescribing criteria66–68 and will be the subject of a further publication.
ConclusionsOur data support the multi-factorial nature of DES, with dry eye playing an important role in the aetiology of DES. Most pre-presbyopic adults suffering from DES report a subjective preference for low adds over a control (plano) lens for near vision (with distance refractive error corrected), with +0.75D the most often preferred add in this research. This is supported by data from a double-masked placebo-controlled investigation of the effect of low adds on reading rate. It is concluded that +0.75D lenses may be beneficial for many people suffering the symptoms of DES, especially if in the age range from 20 to 40 years and predominantly using desktops and laptops. It is speculated that stronger additions (e.g., +1.25D) may be useful for older pre-presbyopes, and smartphone and tablet users. Although most pre-presbyopes with DES benefit from low adds, this is not a universal finding and clinicians should confirm this on an individual basis.
DisclosureThe research was funded by Hoya Holdings NV, the Netherlands. Hoya as funder had no role in the data collection and analysis or preparation of the manuscript.
The authors express their gratitude to Dr María del Mar Seguí and Dr Elena Ronda of the University of Alicante for permission to use the CVS-Q and to Mr Ojas Mehta of Massachusetts Eye and Ear for permission to use the SANDE questionnaire.


