


To analyze scientific research in the field of visual therapy through a bibliometric study.
MethodsThe database used in this bibliometric study was SCOPUS, the largest abstract and citation database of peer-reviewed literature, covering scientific journals, books, and conference proceedings. Using remote downloading techniques, articles published between 1946 and 2017 were selected by entering the main descriptors: "optometric vis* training", "optometric vis* therapy", "vis* therapy", "vis* training" limited to the title, key words and/or abstract. We applied the following bibliometric indicators: Price’s index, doubling time and annual growth rate, Price’s transience index, Lotka’s Law, h factor, and Bradford’s zones.
ResultsThe authors retrieved 294 original articles from the temporal interval 1946–2017 (articles, reviews, letters to the director, etc.), discarding 15 of them for not meeting the study requirements. Annual growth rate was 39.62%, the timeframe 1987-1983 containing the most number of documents. United States was the country with the highest production, with more than 60% of the records. The most productive institutions are State University of New York System, SUNY State College of Optometry, and Southern California College of Optometry. Classification of authors based on productivity is strongly concentrated in small producers, with a transient index of 80.53. The total number of authors was 488, representing a co-authorship index of 1.75.
ConclusionBibliometric studies have become essential tools for assessing scientific publications.
Analizar la investigación científica en el campo de la terapia visual, a través de un estudio bibliométrico.
MétodosLa base de datos utilizada en este estudio bibliométrico fue SCOPUS, la mayor base de datos de resúmenes y citas de la literatura revisada por pares, que cubre publicaciones científicas, libros y actas de conferencias. Utilizando técnicas de descargas remotas, se seleccionaron los artículos publicados entre 1946 y 2017 introduciendo los descriptores principales: "optometric vis* training", "optometric vis* therapy", "vis* therapy", "vis* training" limitados al título, las palabras clave y/o el resumen. Aplicamos los siguientes indicadores bibliométricos: índice de Price, tiempo de duplicado y tasa de crecimiento anual, índice de transitoriedad de Price, Ley de Lotka, factor h, y zonas de Bradford.
ResultadosLos autores recuperaron 294 artículos originales del intervalo temporal 1946-2017 (artículos, revisiones, cartas al director, etc.), descartando 15 de ellos por no cumplir los requisitos del estudio. La tasa de crecimiento anual fue del 39,62%, conteniendo el marco temporal 1987-1983 el mayor número de documentos. Estados Unidos fue el país más productivo, con más del 60% de los registros. Las instituciones más productivas son: State University of New York System, SUNY State College of Optometry, y Southern California College of Optometry. La clasificación de los autores basada en la productividad está fuertemente concentrada en pequeños productores, con un índice de transitoriedad de 80,53. El número total de autores fue de 488, lo cual representa un índice de co-autoría de 1,75.
ConclusiónLos estudios bibliométricos han resultado ser herramientas esenciales para evaluar las publicaciones científicas.
Optometric visual therapy is a non-invasive treatment based on sequential neurosensory and neuromuscular activities individually prescribed and monitored by eye care practitioners to develop, rehabilitate and enhance efficient visual skills and processing.1,2
A vision therapy program must be based on the results of standardized procedures included in a comprehensive eye examination, taking into account the age, symptoms and needs of the patient.1 It is performed in office sessions under the supervision of an optometrist, and complemented by a home-based exercise program in order to reinforce the developing visual skills.3 A visual therapy program may include the use of specific instruments, lenses, prisms, vectograms, filters, occluders and computer programs. The length of the visual therapy treatment varies depending on the diagnosis and the patient, typically ranging from several months to longer periods of time.
Optometric vision therapy has been used to treat binocular and accommodative dysfunctions, strabismus, amblyopia, oculomotor dysfunctions in acquired brain injury and visual information processing disorders.4–10 Vision therapy has also been studied to improve sports performance.11–12 However, under the name of visual therapy, a great variety of exercises without scientific basis have been developed2 and there are also some procedures that remain controversial.3,13 On the other hand, there are many well-conducted studies, including controlled clinical trials and experimental studies with a solid scientific basis.13 Most of these studies are related to the treatment of children and adults with convergence insufficiency.
Despite the increase in publications that show the effectiveness of visual therapy, its use is very heterogeneous. In order to overcome this limitation, the primary objective of this study was to analyze the state of scientific literature related to optometric VT that appeared from January 1946 to December 2017, in peer-reviewed journals indexed by Scopus. We also wanted to assess productivity, publication, types, sites and trends in journal choice.
Bibliometrics, through its indicators, focuses on calculation and analyze the quantifiable values of scientific production.14 Bibliometrics comprises obtaining, processing, and managing quantitative bibliographic data from scientific publications.15,16 Despite their methodological limitations, bibliometric studies are useful tools for assessing the scientific relevance of a given discipline and are widely used by universities to assess research performance.15
The objective of this study is to analyze scientific research in the field of visual therapy through a bibliometric study.
Material and methodsScopus was the database employed in this bibliometric study. This is the largest abstract and citation database of peer-reviewed literature, covering scientific journals, books and conference proceedings. It is composed of nearly 22.000 titles from over 5.000 publishers, of which 20.000 are peer-reviewed journals in scientific, technical, medical, and social sciences (including arts and humanities). Therefore, the decision on Scopus was based on its size, since it is larger than Pubmed or Web of Science.17
Using remote downloading techniques, we retrieved documents published from 1946 to 2017 (December 2017) to achieve the objectives of this study. The search terms entered in Scopus were "optometric vis* training", "optometric vis* therapy", "vis* therapy", "vis* training", in the fields TITLE-ABSTRACT-KEYWORDS. All subject areas were selected. The resultant search was: ( ( ( TITLE-ABS-KEY ( "optometric vis* training" ) OR TITLE-ABS-KEY ( "optometric vis* therapy" ) ) AND PUBYEAR < 2018 ) OR ( ( TITLE-ABS-KEY ( "vis* therapy" ) AND TITLE-ABS-KEY ( optomet* ) ) AND PUBYEAR < 2018 ) OR ( ( TITLE-ABS-KEY ( "vis* training" ) AND TITLE-ABS-KEY ( optomet* ) ) AND PUBYEAR < 2018 ) )
In the present study, the following bibliometric indicators were applied: Price’s index, doubling time and annual growth rate, Price’s transience index, Lotka´s Law, h factor and Bradford’s zones.
Of the available bibliometric indicators of production, Price’s law18 was applied. This law is the most widely used indicator to analyze the productivity of a specific discipline or a particular country, and it is also used to illustrate the fundamental aspect of scientific production, which is its exponential growth.
Other quantities related to growth are doubling time and annual growth rate. The first is the amount of time required for the subject matter to double its production; the annual growth rate represents how the magnitude has grown over the previous year, expressed as a percentage. The equation to calculate the doubling time (D) is expressed as follows:
Where b represents the constant that relates the rate of growth to the size of the science already acquired. To calculate the annual growth rate, we used the following equation:
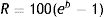
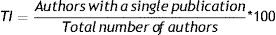
Additionally, it is also interesting to determine the number of authors with a single publication. This is known as the transience index or Price’s law. It is calculated as the percentage ratio of authors with one publication with respect to the total number of authors. Mathematically, it would be expressed as:
Lotka’s law expresses the frequency distribution of scientific productivity by the number of published articles, also known as the “inverse square law of scientific production”19 It analyzes the publication volume of authors and found that the number of authors who publish fewer papers is greater than those who publish many. (39) In mathematical terms, the original law is expressed by the formula:

Were A (n) is the number of authors publishing n articles and A1 the number of authors publishing a single article. It has also been calculated the Productivity Index (PI), as the decimal logarithm of the number of publications by an author. This index refers to the percentage of articles that correspond to each author and indicates their productivity over the study area.
According to this index, the authors are categorized into three levels of productivity: small producers (those who publish one article); medium-sized producers, (those who publish 2–9 articles); and large-scale producers (those who publish 10+ articles). To estimate the importance of the authors, we have used the index h obtained in the scopus database.20 This indicator is used to estimate the number of relevant papers published by an author; the higher the number of papers, the greater the author’s value. This indicator is easy to use and is the only one that combines production and impact; in addition, it eliminates biases caused by the tails of citation distribution.
We also used Bradford’s law as a bibliometric indicator for the dispersion of scientific information21 In order to show the distribution of the scientific literature in a particular discipline, Bradford proposed a model of concentric zones of productivity (Bradford zones) with decreasing density of information. Thus, each zone would contain a similar number of documents, but the number of journals in which these are published would increase on passing from one zone to another. This model is used to identify the most widely used journals with greatest weight in a given field of scientific production.
We used impact factor as an indicator of the publication’s repercussion.22 This indicator was developed at the Institute for Scientific Information (Philadelphia, Pennsylvania, USA), in its annual publication of the Journal Citation Reports (JCR) section of the Science Citation Index (SCI). The IF of a journal is calculated according to the number of times the journal is cited in the source journals of the SCI during the two previous years, and the total number of articles published by the journal in question in those two years. The JCR lists scientific journals by specific areas, ascribing to each of them their corresponding impact factor and establishing a ranking of “prestige.” We used the IF data of 2016 published in the JCR.
ResultsThrough the abovementioned search criteria, we retrieved 294 original articles from the temporal interval 1946–2017 (articles, reviews, letters to the director, etc.), 15 of which had to be discarded following a manual filtering process, due to non-fulfillment of the study requirements.
To assess whether the growth of scientific production in vision therapy follows Price’s law of exponential growth, we performed a linear fit with the acquired data, according to the equation y = 0.0854x – 165.34, followed by an adjustment to an exponential curve, according to the equation y = 7E-44e0.0504×.
Fig. 1 presents the resulting chronological distribution.

As this figure reflects, the mathematical adjustment to a linear curve reveals a correlation coefficient of 0.2631, indicating that 73.69 % cannot be explained by this adjustment. On the other hand, the exponential adjustment of the measured values provides a 0.4158 coefficient and therefore a residual variability percentage of 58.42 %. According to these results, we can conclude that the repertoire analyzed is more in keeping with an exponential fitting than with a linear one, and that the postulates of Price’s Law are fulfilled. However, it is important to take notice of the high degree of variability that exists, as the correlation coefficient is well below 1.
The distribution in five-year periods shows that the timeframe 1987-1983 contains the most documents, with a total of 15.77 %, as displayed in Fig. 2. An annual growth rate of 39.62 % was estimated.

To calculate doubling time, it was fitted the equation y = 3.8427e0,0694x with a correlation coefficient of 0.9325. This production corresponds to 72 years and a doubling time of 9.93 years.
The geographical and by affiliation distribution of the documents is presented in Fig. 3. It should be noted that a single country, the United States, has generated more than 60 % of the records, a long way ahead of the second-placed country, Australia, which accounts for only 4.30 % of the documents.

Fig. 4 shows the most productive institutions in relation to the material under study. We found that more than 30 % of total production was generated in three institutions: State University of New York System, SUNY State College of Optometry, and Southern California College of Optometry.

After applying Lotka’s law, the distribution of the authors was heavily concentrated in small producers, with a high index of transience (occasional authors): 80.53 (Table 1).
The total number of authors for 279 papers was 488, representing a co-authorship index of 1.75. The most usual number of signatures per document is 1, which indicates highly individualized research.
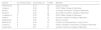
Among the most productive authors, there was great variability in the h index, ranging between 11 and 43 (Table 2).
Most productive authors.
| Authors | No. Of documents | Documents (%) | H-Index | Affiliation |
|---|---|---|---|---|
| Scheiman M. | 16 | 5.73 | 29 | Salus University |
| Cooper J. | 15 | 5.38 | 22 | SUNY State College of Optometry |
| Wick B. | 12 | 4.30 | 16 | University of Houston. College of Optometry |
| Kulp M.T. | 10 | 3.58 | 22 | Ohio State University. College of Optometry |
| Ciuffreda K.J. | 9 | 3.23 | 39 | SUNY State College of Optometry. |
| Cotter S. | 9 | 3.23 | 37 | Southern California College of Optometry |
| Gallaway M. | 9 | 3.23 | 16 | Salus University |
| Mitchell G.L. | 9 | 3.23 | 43 | Contact Lens Assessment in Youth (CLAY) |
| London R. | 8 | 2.87 | 11 | Pacific University. Forest Grove. College of Optometry |
| Rouse M.W. | 7 | 2.51 | 27 | Southern California College of Optometry |
In the scientific journals where the papers on vision therapy have been published, we applied Bradford’s model. The mean number of articles per Bradford zone was 93. Table 3 shows the division into Bradford’s areas of the material under study. The core is a single American journal, Optometry and Vision Science, with more than 45 % of records (127 documents) with an impact factor of 1.442, data for that core as of 2016.
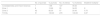
The total number of citations reached by the retrieved documents is 2869. Table 4 shows the most cited articles. Four of these articles deal with the treatment of nonstrabismic binocular disorders such as convergence insufficiency, two of them deal with the treatment of amblyopia and one of the articles is about vision therapy for oculomotor dysfunctions in acquired brain injury.
The most frequently cited articles.
| Article | Authors | Source | Cited | % | Year of publication |
|---|---|---|---|---|---|
| Anisometropic amblyopia: Is the patient ever too old to treat? | Wick, B., Wingard, M., Cotter, S., Scheiman, M. | Optometry and Vision Science | 88 | 3.07 | 1992 |
| The scientific basis for and efficacy of optometric vision therapy in nonstrabismic accommodative and vergence disorders | Ciuffreda, K.J. | Optometry | 82 | 2.86 | 2002 |
| A randomized clinical trial of vision therapy/orthoptics versus pencil pushups for the treatment of convergence insufficiency in young adults | Scheiman, M., Mitchell, G.L., Cotter, S., (…), London, R., Wensveen, J. | Optometry and Vision Science | 72 | 2.51 | 2005 |
| Principles of modern low vision rehabilitation | Markowitz, S.N. | Canadian Journal of Ophthalmology | 70 | 2.44 | 2006 |
| Vision therapy for oculomotor dysfunctions in acquired brain injury: A retrospective analysis | Ciuffreda, K.J., Rutner, D., Kapoor, N., (…), Craig, S., Han, M.E. | Optometry | 64 | 2.23 | 2008 |
| Visual therapy results for convergence insufficiency: A literature review | Daum, K.M. | Optometry and Vision Science | 61 | 2.13 | 1988 |
| Reduction of asthenopia in patients with convergence insufficiency after fusional vergence training | Cooper, J., Selenow, A., Ciuffreda, K.J., (…), Hokoda, S.C., Silver, J. | Optometry and Vision Science | 60 | 2.09 | 1987 |
| Success in amblyopia therapy as a function of age: A literature survey | Birnbaum, M.H., Koslowe, K., Sanet, R. | Optometry and Vision Science | 59 | 2.06 | 1977 |
Bibliometric studies have interesting tools for assessing the social and scientific importance of a given discipline over a specific period of time. The term “bibliometrics” was introduced in 1969 by Alan Pritchard to define the application of mathematical and statistical methods to the process of disseminating written communication in the area of scientific disciplines, by means of quantitative analysis of the different aspects of this type of communication.
Provided a suitable number of appropriate standardized indicators are used, this type of study can be very useful in assessing the activity of vision therapy and can provide information about the trend of this discipline over time. However, it should also be pointed out that this type of study has certain limitations, such as the fact that bibliometric studies do not take into account the quality of the publications, or the lack of consistency in the use of authors’ names.
The design of our analysis shows a general assessment of the growth of scientific literature about vision therapy. In this regard, the design of the present analysis still allows us to make an overall assessment of the growth of scientific literature related to vision therapy. Fig. 1 shows the number of scientific publications has undergone exponential growth over the last 72 years, up to the end of the period studied, without any evidence of approaching saturation as postulated by Price in his theory on expansion of scientific literature.18 The fact that the time of duplication of the scientific literature about vision therapy stands at 9.93 years should be seen as positive, demonstrating the great dynamism of this area of Optometry.
Bibliometric analysis can also compare the contributions of institutions, journals, authors and countries. We evaluated the contributions of different countries. The country that had the most publications was United States, as is also the case with other publications related to eye care conditions.23–25 Following the United States, the countries with the most publications are Australia, Canada and United Kingdom. The four main English-speaking countries, United States, United Kingdom, Canada and Australia, head the ranking of producer countries and among them generate more than half of the production (74.92 %) in this field. The fact that the standard of optometry in these countries is higher than in other countries of the world might explain this situation.
Of the 2869 total number of citations, the most cited publications are shown in Table 4. Most of these (9.59 %) are about the treatment of binocular anomalies, followed by the treatment of amblyopia (5.13 %). It is also worth highlighting that most of the authors of these articles are also the most productive, as shown in Table 2.
These eight most-cited articles were published in only three different Journals: Optometry and Vision Science, Optometry, and Canadian Journal of Ophthalmology, in descending order of number of citations. Two of these journals are American and the other is Canadian. Optometry and Vision Science is the official journal of American Academy of Optometry (impact factor: 1.5), Optometry is the Journal of the American Optometric Association has a 0.03 RG Journal impact in 2018, and the Canadian Journal of Ophthalmology is the official journal of the Canadian Ophthalmological Society. The first two fall within the optometry category, while the third one focuses on ophthalmology.
Although there are a large number of authors (n = 668), only 10 are “the most productive” (Table 2). Scheiman M, Cooper J and Wick B. were the top three authors with the most published about vision therapy. All of them focused on the treatment of convergence insufficiency. All these authors are from different north american universities. It is also worth noting that universities are the most productive institutions, as shown in Fig. 4.
Previous bibliometric studies have been shown to have many limitations when adopting the sociometric approach.26 Obviously, the international scientific production in a particular field such as vision therapy in this study is much more extensive (e.g. papers presented at scientific conferences, or certain journals, none of which are indexed in the usual databases). We could also mention the lack of standardization of authors’ names as well as other limitations arising from incorrect use of methodological filtering.27–29 However, the recognized quality and coverage of the publications included in the databases used in this study means that the papers chosen constitute a more than representative sample of international research on the area in question.
ConclusionsThis study presents the general trend in vision therapy research, the United States occupying the leading position in this field.
Finally, it can be asserted that, despite the limitations of bibliometric studies, our study offers a comprehensive picture of published scientific research on vision therapy.
Research in this field on topics such as amblyopia, binocular disorders and learning disabilities will probably grow in the coming years.
Conflict of Interest: All authors certify that they have no affiliations with or involvement in any organization or entity with any financial interest (such as honoraria; educational grants; participation in speakers' bureaus; membership, employment, consultancies, stock ownership, or other equity interest; and expert testimony or patent-licensing arrangements), or non-financial interest (such as personal or professional relationships, affiliations, knowledge or beliefs) in the subject matter or materials discussed in this manuscript.
Conflict of interestThe authors report no conflicts of interest. The authors alone are responsible for the content and writing of the paper.
The authors would like to thank Peter Bonney for proofreading the article.


