


To investigate the possibility of using a keratometer to check the specification of the conicoidal back surface of rigid contact lenses.
MethodsA conicoidal surface can be described by quoting two parameters. The most useful for the contact lens practitioner are the apical radius (curvature) and the P-value (asphericity). A keratometer was used to measure calibrated aspheric concave surfaces with the surfaces tilted in relation to the keratometer optical axis in order to acquire sagittal radii of curvature for various regions across the concave surface. The known surface characteristics were used to apply a correction factor to the results in order to allow derivation of the surface apical radius and P-value by keratometry.
ResultsThe 95% confidence limits suggest an estimate to within —0.014 to +0.011mm for apical radius and —0.011 to +0.009 for the P-value compared to the results derived by form Talysurf analysis. The coefficient of repeatability was 0.029mm for apical radius and 0.031 for the P-value.
ConclusionsThe investigation supports the notion that the keratometer could be used to check both the curvature and the asphericity of conicoidal back surface rigid contact lenses.
Investigaron la posibilidad de utilizar un queratómetro para verificar la especificación de la superficie posterior conicoidal de las lentes de contacto rígidas.
MétodosUna superficie conicoidal puede describirse indicando dos parámetros. Los más útiles para las lentes de contacto son el radio apical (curvatura) y el valor de p (asfericidad). Se usó un queratómetro para medir las superficies esférica y cóncava calibradas con una inclinación de las superficies en relación con el eje óptico del queratómetro para adquirir los radios sagitales de la curvatura de las diversas regiones a través de la superficie cóncava. Se usaron las características de superficie conocidas para aplicar un factor de corrección a los resultados con el objetivo de permitir la derivación del radio apical de superficie y el valor de p por la queratometría.
ResultadosEl límite de confianza del 95% sugiere una estimación de —0,014 a +0,011mm para el radio apical y de —0,011 a +0,009 para el valor de p, comparado con los resultados derivados mediante análisis con Form Talysurf Intra, un instrumento de medición de forma y superficie. El coeficiente de repetibilidad fue de 0,029mm para el radio apical y de 0,031 para el valor de p.
ConclusionesLa presente investigación respalda el concepto de que el queratómetro podría usarse para verificar tanto la curvatura como la asfericidad de las lentes de contacto rígidas cuya superficie posterior es conicoidal.
Rigid gas permeable (RGP) contact lens back surfaces are manufactured with flattening peripheral zones in order to align the lens with the relatively flatter peripheral corneal surface, and to generate an appropriate edge clearance between the lens and the cornea. This edge clearance is required to produce:
- 1.
a tears reservoir that will encourage tear exchange beneath the lens during eye movements and blinking
- 2.
a tears meniscus which will generate an adequate capillary attraction in order to maintain the lens in a stable, well centred position
- 3.
an edge that does not dig into the peripheral cornea when the lens decentres
- 4.
an edge clearing the cornea sufficiently to allow lens removal by the eyelids
- 5.
sufficient tear reservoir to protect the cornea at the cornea/lens/tear/air interface
From the above it is apparent that the lens back surface peripheral specification is possibly as important to contact lens success as the central specification. The central specification can be easily checked in a clinical environment by using an optical spherometer (radiuscope) or a keratometer to measure the lens back optic zone radius (BOZR). The peripheral specification of a multicurve lens can be checked indirectly using the pillar and collar technique devised by Douthwaite and Hurst. 1 This approach was used to measure the back surface of aspheric RGP lenses by Dietze et al.2
Conicoidal aspheric back surface lenses have a back surface that can be mathematically described by measuring the apical radius and the asphericity. These parameters can be calculated from the pillar and collar technique which measures the overall sagitta of the contact lens back surface for a given pillar diameter. An alternative approach to back surface measurement of a conicoidal aspheric lens would be to consider using a keratometer. Bennett 3 suggested the use of the keratometer to measure the BOZR of a contact lens. He found that instrument re-calibration was required to measure concave surfaces. For clinical purposes, he suggested adding 0.03mm to the measurement in order to achieve a realistic result.
Our proposal is that it should be possible to deduce the apical radius and the P-value (asphericity) by using the keratometer on the back surface of aspheric contact lenses by progressively tilting the lenses to ensure that the lens surface regions examined become increasingly peripheral.
MethodsTen conicoidal concave/plano buttons underwent Form Talysurf analysis at Taylor Hobson Precision, Leicester, UK. This laboratory is part of the National Measurement Accreditation Service that provides facilities for checking or calibrating instruments and other test equipment against recognised international standards. The resolution is quoted as 20nm or approximately 1/32 of the wavelength of helium neon laser light. Relative to the best fit arc, the accuracy is claimed to be within two parallel planes having a separation of 0.1μm over a 20mm traverse after the removal of the best fit reference line. Two measurements were made on each surface: one parallel to an engraved line on the underside of the aspheric button with the other in the orthogonal meridian. Both measurements were made over the central 8mm of the surface. This analysis allowed for the calculation of the surface apical radius (ro) and the P-value (p). The apical radius indicates the curvature and the P-value indicates the asphericity of the surface. A spherical surface has a P-value of unity and a parabolic surface has a P-value of zero. A conic section is fully described mathematically by quoting the apical radius and the P-value, just as a circular arc is fully described by quoting its radius of curvature.
The results of the Talysurf analysis were assumed to give an accurate assessment of the conicoidal surfaces and this provides a datum against which the results of any other method can be compared. The apical radii of the surfaces ranged from 7.597 to 8.401mm and the P-values ranged from .014 to .796 along the engraved meridian. The results for the orthogonal meridian were very similar.
The Zeiss Telecentric Keratometer model 110 (Zeiss, Jena, Germany) was used to measure the sagittal radius of curvature of the engraved meridian (orientated along the horizontal) of each concave conicoidal surface by conventional keratometry. The aspheric surface was then tilted about a vertical axis and the keratometry was repeated. The geometry of the keratometer was used to calculate the region of the surface that was being measured in both cases as follows.
Figure 1 illustrates the generation of the mire image by conventional keratometry. The concave reflecting surface illustrated is a conicoidal arc which possesses a sagittal radius of curvature of rs1 for point P with the sagittal centre of curvature at C. The perpendicular distance h1 defines the point P on the surface being measured. There is a corresponding point on the inferior portion of the lens that gives an identical radius when measuring a rotationally symmetrical surface. The keratometer measures the sagittal radius of curvature rs1 for the defined point when measuring an aspheric surface.4,5

Conventional keratometry on a concave surface of sagittal radius rs1 at point P. The reflected light ray from P is the chief ray for the keratometer telescope objective The dotted line CP is the normal to the surface at point P. The curved arc is a conic arc of sagittal radius of curvature rs1 for point P and C is the sagittal centre of curva ture, i is the perpen dicular distance for the mire image extremity from the instrument optical axis, h1 is the per pendicular distance from P to the instru ment optical axis.
The perpendicular distance h1 can be calculated by simple trigonometry knowing that the centre of the collimated mire cross subtends an 18 degree angle to the instrument optical axis, the distance between the telescope objective and the mire image is 100mm and the sagittal radius rs1 has been measured by the keratometer. The image of the centre of the cross is formed perpendicular distance i from the instrument optical axis.
The perpendicular distance from the optical axis of the keratometer h1 defines the surface region being measured. The angular displacement of the normal at point P from the horizontal is given by:
where sin is sin of angular displacement of the normal.
When the surface is tilted, the amount of tilt can be added to the initial angular displacement of the normal at point P to give a total angular displacement. This total angular displacement represents an approximate indication of the surface region used to generate the keratometer mire image for the lower semi-meridian in Figure 1. This tilted surface region is assumed to be at a perpendicular distance of h2. The measurement of the tilted surface will produce a new sagittal radius rs2 and the approximate region of the surface being measured will be located by:

Note that the contra-lateral semi-meridian will be using a completely different part of the surface for generation of its mire image. However, it is initially assumed that the point on the surface that is being measured coincides with the point defined by equation (2). This is an over simplification and represents a starting point for the method.
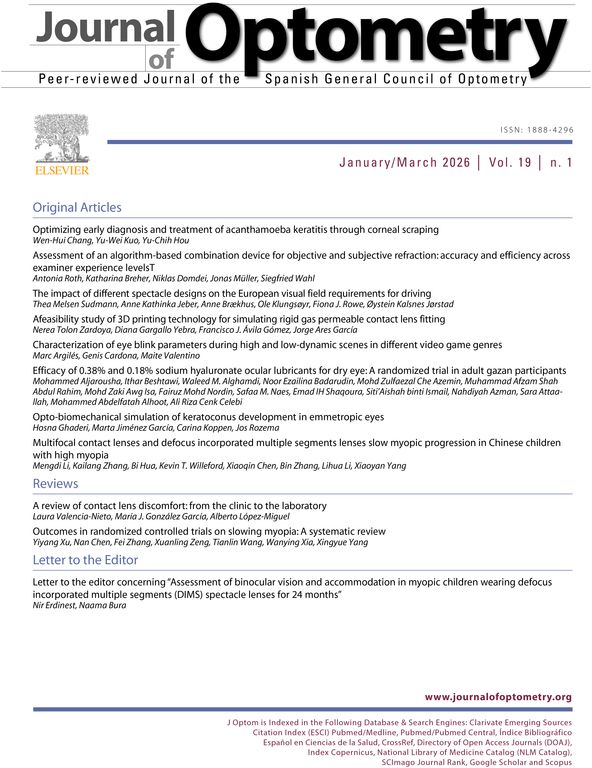
The problem with this result is that the value derived for h2 is an approximation. However, Sheridan and Douthwaite 6 used the equation:
where rs is the sagittal radius, ro is the apical radius, p is the P-value (asphericity) and h is the perpendicular distance of the measured point from the instrument optical axis.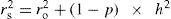
The equation can be re-written as
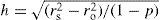
So if we take the apical radius and the P-value of the surface according to the Talysurf analysis and then substitute the sagittal radius (rs2) from the keratometer measurement for any angle of tilt, we can calculate an accurate value of h2.
From the above, it is then possible to consider making keratometric measurements of sagittal radius using varying degrees of surface tilt with the points initially defined by the approximate h2 derived from equation (2). The association between the approximate (keratometer) and the accurate (Talysurf) values of h2 could then be used to calculate a corrected value (h2C) from the approximate value. A series of sagittal radii for surface points defined by the corrected value h2C can then be used to calculate the aspheric surface apical radius and P-value.
A holder was manufactured to hold the test buttons perpendicular to the instrument optical axis and to allow various angles of horizontal tilt around the surface apex. Figure 2 shows a photograph of the holder in situ on the keratometer. The tilt angles were themselves measured by noting the displacement of a laser beam reflected off a plane mirror surface onto a tangent screen. The tilt angles used were 9.95, 12.10, 14.49, 17.43 and 20.24 degrees. As each surface was mounted in the holder the clockwise and anti-clockwise values for the 20.24 tilt were checked to ensure that similar radii were recorded. A difference less than 0.05mm in the keratometric radius between the clockwise and anti-clockwise results was accepted as an indicator that the surface tilt was zero for conventional keratometry.

Four conventional keratometry measurements (no tilt) were performed on the engraved horizontal meridian of each aspheric surface. The average radius was recorded. This allowed calculation of h1 and the angular displacement of the normal to the surface. Measurements were then made in each of the tilted positions with keratometry performed alternately using clockwise and anti-clockwise rotations with two measurements recorded in each tilted position. Any remaining inaccuracy due to any slight error in surface placement was minimised by recording the radius for any tilt angle as the average of the four values. The value for h1 was calculated and equation (2) was used to calculate the approximate value for h2 for each tilt angle. Equation (4) was used to calculate the accurate value for h2 using the keratometrically measured sagittal radius with the P-value and apical radius calculated from the Talysurf results.
A scatterplot of accurate values for h2 derived from the Talysurf data versus the approximate h2 values derived from keratometric measurement was plotted, with a separate scatterplot drawn for each tilt angle. The function was found to be slightly different for each tilt angle but was linear in every case. The regression equations for each tilt angle were used to provide a correction factor to change the approximate value of h2 to a corrected value (h2c). For each tilt angle we then have a sagittal radius measurement (rs2) centred on a position that is defined by its corrected perpendicular distance from the instrument optical axis (h2c). The 10 surfaces were measured recording the sagittal radius rs at the corrected perpendicular distance h2c. Equation (3) was the equation used by Douthwaite 7 to assess the accuracy of the EyeSys VK.
The apical radius ro and the P-value p are constants of the surface. Equation (3) is therefore the equation for a straight-line graph.
Plotting a graph of perpendicular distance squared (h2c2 on the abscissa) versus sagittal radius squared (rs22 on the ordinate) will allow the calculation of apical radius (the square root of the intercept of the regression line on the radius squared axis) and the P-value (1 — slope of the regression line). Graphs were plotted for each of the 10 surfaces and the results were compared with the apical radius and P-value derived by Talysurf analysis.
It must be noted that the keratometric images of the two mire crosses were not simultaneously in focus at the greater tilt angles for the more aspheric surfaces. In these conditions, the keratometer focus was adjusted for the best overall focus before alignment was attempted. Another set of measurements were made on the same ten surfaces in order to assess the repeatability of the technique.
ResultsThe close agreement of the Talysurf measured apical radius and P-value for the two orthogonal meridians indicated that there was no toricity present in any of our test surfaces.
The scatter plots of approximate h2 versus accurate h2 were plotted for each angle of tilt. A linear relationship was observed and the regression equations were similar. The coefficient of determination (r2) never fell below 0.916 in any of the scatter plots.
The corrected perpendicular distance (h2c) squared versus radius squared (rs2) scatterplots for the ten surfaces are illustrated in Figure 3. It must be noted that the coefficient of determination (r2) never fell below 0.996 in the graphs illustrated in Figure 3.

The apical radii and P-values derived from these graphs were then compared to those derived from the Talysurf analysis. Apical radii and P-values derived by keratometry and Talysurf were compared using a t-test. There was no statistically significant difference between these two methods (apical radius: t=0.238, p=.817; P-value: t=0.538, P=.604). The mean versus difference plots8 for apical radius and p value are illustrated in Figure 4 a and b respectively.

In Figures 4a and 4b, the solid line (near zero on the Y axis) is the mean difference (bias) between the Talysurf and keratometric-derived data, and the dotted lines represent the limits of agreement (± 1.96 times the standard deviations of the differences). An alternative to using the limits of agreement is to calculate the 95% confidence limits from the standard error of the differences. The 95% confidence limits indicate that the keratometric result will lie within —0.014 to +0.011mm of the Talysurf result for apical radius measurement and within —0.011 to +0.009 for the P-value.
The repeatability of the method was assessed by comparing the first and second sets of measurements. The coefficient of repeatability (two times the standard deviation of the differences) was calculated for both the apical radius and the P-value. The coefficient of repeatability for the apical radius was 0.029mm. The coefficient of repeatability for the P-value was 0.031.
DiscussionThe aim of this investigation was to consider the possibility of checking the specification of a conicoidal concave back surface RGP contact lens using a keratometer. The surface in question must be described by a single apical radius and P-value; therefore, the method described here is not suitable for surfaces that have zones of differing eccentricity. The perpendicular distance squared versus radius squared graphs illustrated in Figure 3 show measurement points that all lie on a regression line (r2 never below 0.996). Mathe matical modelling has shown that measurements of this type made on aspheric tilted conicoidal surfaces will theoretically produce a linear relationship. 9 The assessment of accuracy was made by comparing the keratometer results to those of the Talysurf analysis. The difference between the two is likely to be no more than 0.014mm for apical radius and 0.011 for the P-value with a 95% confidence. The repeat ability was assessed by deriving the coefficient of repeatabi li ty which suggested that repeat measurements are likely to be within 0.029mm of the original measurement for the apical radius and within 0.031 for the P-value.
These are encouraging results. They support the notion that an aspheric back surface contact lens specification could be checked by using a keratometer. The instrument was unmodified and the only accessory required was a holder for the contact lens that allowed the lens to be tilted to the stated angles. It must be pointed out that this investigation used a telecentric keratometer with collimated mires. This type of keratometer produces radius measurements unaffected by focussing errors. A non-telecen tric instrument is likely to display a performance inferior to that illustrated in this investigation.
A limitation of this method of lens surface checking would arise when attempting to measure a lens with a flat apical radius combined with significant asphericity. This would produce a surface with very flat peripheral characteristics that may be outside of the measurement range of the keratometer.
Some contact lens laboratories prefer to describe their aspheric back surface lenses in terms of the apical radius and the edge lift. The axial edge lift can be defined as the distance between the back surface and the extension of the central curve regarded as a spherical shell. The difference between the sagitta of the central shell and the axial edge lift gives the overall sagitta (x) of the lens back surface for a semi-diameter y. The P-value can then be calculated using equation (5).

A videokeratoscopic device for measuring concave surfaces could also be considered as a proposition. It would, however, probably require a completely different arrangement of the placido disc rings to ensure that each ring image was near to being focussed in the plane of the camera CCD chip when the image is captured.
The authors wish to thank Cantor and Nissel Ltd, Brackley, Northamptonshire, UK, for manufacturing the conicoidal concave surfaces used in this study.


