

To test the performance of the C-quant straylight meter during the daily routine work in medical testing centres for driver license applicants and driver license holders in Spain.
MethodsAltogether 914 subjects, of which 376 younger than 35 years, 428 between 35 and 60 years and 110 over 60 years were measured with the C-quant in three medical testing centres (Barcelona, Zaragoza and Palma de Mallorca) in 2006. Technicians were instructed once and the measurements were done during the daily routine work. We recorded: age, BCVA, self-reported subjective blinding at night; and from the C-quant: straylight parameter (log s), measurement quality parameters (ESD, Q) and test duration.
ResultsTotal C-quant test duration increases slightly with age from a mean of 7 min (< 35 years) to a mean of 9 min (> 60). At first attempt, 82 % of all subjects produced reliable results (ESD < 0.12). The straylight parameter for this group was independent of ESD and ESD was independent of total test duration. The known age dependence of the straylight parameter and the weak correlation with BCVA was confirmed. The distribution of subjective blinding at night was very different between test centres. Subjects with “very strong” subjective blinding had significantly higher straylight values than subjects with “no” subjective blinding. Subjects avoiding night driving had significant higher straylight values than subjects driving at night.
ConclusionThe C-quant measure is reasonable fast. Good subject instruction is important to get first attempt reliable results. Self-reported subjective blinding results depend strongly on the interviewer.
Examinar el rendimiento del sistema C-QuantTM de Oculus, un dispositivo que mide y cuantifica la cantidad de luz dispersa durante la actividad rutinaria diaria en los centros de revisiones médicas para solicitar o renovar el permiso de conducir en España.
MétodosEn conjunto, 914 individuos, de los que 376 eran menores de 35 años de edad, 428 tenían 35-60 años y 110 eran mayores de 60 años, se sometieron al dispositivo C-Quant en tres centros de revisiones médicas (Barcelona, Zaragoza y Palma de Mallorca) en 2006. Se proporcionaron instrucciones a los técnicos y las determinaciones se efectuaron durante el trabajo rutinario diario. Registramos la edad, la mejor agudeza visual corregida (best corrected visual acuily [BCVA]), el deslumbramiento subjetivo nocturno autorreferido; y, a partir del dispositivo C-Quant, el parámetro de luz dispersa (log s), determinación de los parámetros de calidad (ESD,Q) y duración del examen.
ResultadosLa duración total del examen C-Quant aumenta ligeramente con la edad desde una media de 7 min (< 35 años) hasta una media de 9 min (> 60 años). En el primer intento, el 82 % de todos los individuos produjeron resultados fiables (ESD < 0,12). Para este grupo, el parámetro de luz dispersa fue independiente de ESD y ESD fue independiente de la duración total del examen. Se confirmaron la conocida dependencia de la edad del parámetro de luz dispersa y la débil correlación con BCVA. La distribución del deslumbramiento subjetivo por la noche fue muy diferente entre centros que efectuaron el examen. En individuos con un deslumbramiento subjetivo “muy intenso” se obtuvieron valores de luz dispersa significativamente más altos que en aquéllos sin deslumbramiento subjetivo. Los individuos que evitaban conducir de noche obtuvieron valores de luz dispersa significativamente más altos que los que conducían de noche.
ConclusiónEl parámetro C-Quant es razonablemente rápido. Es importante proporcionar instrucciones apropiadas a los individuos para obtener resultados fiables en el primer intento. Los resultados de deslumbramiento subjetivo autorreferido dependen potentemente del entrevistador.
Currently, visual acuity is considered the primary visual function for the evaluation of drivers. The importance of contrast sensitivity and glare sensitivity is recognised1-4 and earlier studies showed that visual acuity, contrast sensitivity and glare sensitivity are risk factors for self-reported visual function impairment.5-7 Contrast sensitivity and glare sensitivity tests are usually not included in the evaluation of drivers.
Straylight is the known basis of the phenomenon of disability glare. Light scattering in the eye's optical media causes a veil of straylight over the retina. This leads to deleterious visual effects such as glare while driving at night, hindrance from a low sun during daytime, reports of haziness of vision, colour and contrast loss, etc. Therefore disability glare is an important safety issue for automobile drivers.8-11
Straylight increases with age in the healthy eye, and more so with ocular conditions such as cataract and other disturbances to the optical media.8,10,12,13 In earlier studies straylight has been appreciated as a visual function that has “added value” being affected rather independently of visual acuity and contrast sensitivity in a clinical population 14 and in a population of elderly drivers.15
It is debated in the European Union, whether or not to demand periodical medical testing of elderly drivers and to include measurement of disability glare.16 Some countries like Germany, France and Sweden do not require a periodical medical testing for elderly drivers, while others have quite different ages of implementation with for instance from 70 years on in the UK, the Netherlands and Finland or from 45 years on in Spain.17
We decided to test the performance to measure disability glare with the commercially available straylight meter C-Quant (Oculus GmbH, Germany) during the daily routine work in medical testing centres for driver license applicants and driver license holders in Spain. The C-quant is an improvement over present methods, because it measures straylight in an objective way and cannot be influenced.18-21 During 2006 a field test was performed under the auspices of the Dirección General de Tráfico (DGT) in three medical testing centres. We were interested in the time needed to perform the complete test, the percentage of usable test results in such a field test, outside an ophthalmic clinic or research laboratory and the influence of the quality parameters reported by the C-Quant. Additionally, we were interested in the actual visual quality of the tested drivers as described by best corrected visual acuity and intraocular straylight and the relation of both with self reported visual performance at night.
MethodsAltogether 914 driver license applicants or driver license holders which referred in 2006 to three medical testing centres in Spain were included in the study. Two centres belonged to La Asociación Española de Centros Médico-Psicotécnicos (ASECEMP): the Centre Mèdic Cerdà in Barcelona (n=200) and Centro Medico Univeristas in Zaragoza (n=320) and one centre was from Federación de Asociaciones de Centros de Reconocimientos Médicos (CREME): Tecsalud in Palma de Mallorca (n=394). The study adhered to the tenets of the Declaration of Helsinki and informed consent was obtained from the driver license applicants.
The age distribution was similar in all three centres, with a mean of 43 years (range 20 to 87) in Barcelona, a mean of 39 years (range 15 to 77) in Zaragoza and a mean of 36 years (range 14 to 86) in Palma de Mallorca. Best-corrected visual acuity (BCVA) was assessed by projection of Snellen optotypes. Drivers were asked to judge their subjective blinding at night as “no”, “some”, “moderate”, “strong” or “very strong” and if they were avoiding driving at night as “yes” or “no”.
Intraocular straylight was measured with the C-Quant (Oculus GmbH, Germany).22 The measurement is based on the compensation comparison method. In short, the test field consists of a dark circle divided into two halves (left and right) and is surrounded by a ring-shaped flickering light, which serves as the glare source. Light emitted from the ring is scattered in the eye resulting in the perception that the test field is flickering. A counter phase compensation light is then presented in one of the semicircles. Then the patient is asked to choose the side that flickers more intensely. To obtain the straylight value, this process is repeated a set number of times with different levels of compensation light. Values were expressed as log (straylight parameter) (log[s]). Higher straylight values indicate higher sensitivity to glare and thus more compromised visual function. The average normal baseline value for 20-to 30-year-old subjects was originally estimated 0.90 log[s] 13, but with the C-Quant instrument a normal reference of 0.94 23 or 0.93 24 is found. The instrument estimates accuracy for each assessment with the ESD parameter (estimated standard deviation). A warning is given if ESD > 0.08 that “reliability is not optimal”.
Technicians were instructed once and the measurements were done during the daily routine work of the testing centres. The test was performed with spherical spectacle correction. Left and right eyes were tested once. In 60 cases of suboptimal reliability the measurement was repeated. Straylight parameter (log s), measurement quality parameters (ESD, Q) and test duration were recorded.
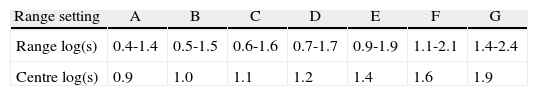
The C-quant has 7 measurement ranges with large overlap (Table 1). As default the instrument chooses the E range, which is suitable for the vast majority of individuals. Manually this setting can be changed to optimize the range setting to the approximate straylight value expected for the respective eye. The technicians were free to make this choice. For extremely low or high straylight values the E range may not be appropriate. The dependence of straylight on age is known on average for healthy eyes, 13 but if a subject has unknown ocular opacities in the cornea, lens or vitreous the real straylight will be higher than the expected value based on his/her age. To evaluate the effect of a proper selection of the range setting on the quality parameters ESD and Q it was compared with the measured straylight value. The deviation of the range setting from the measured log(s) was calculated as the centre log(s) (Table 1) minus the measured log(s).
The measurement was assumed reliable when the Estimated Standard Deviation ESD is lower than 0.12 log units. This value was chosen because it corresponds to a natural limit on two counts. First, a difference of 0.1 log is the value were individuals subjectively notice the difference (compare one line at a letter chart). Secondly, the statistics of the psychophysical procedure is such that this represents the limit for normal reliable measurements (the 0.08 value used by the C-Quant is a bit strict). Comparisons with regard to the test duration were done with all data (Figure 1), all other evaluations were done only with reliable data (from measurements with ESD < 0.12; Figures 2, 3, and 4). Graphical representation of the results are given with the measurements from both eyes together, but regression is done for the first and second eye independently. Regressions were performed to find the best-fit-least-order polynomial. Significance of the regression is given along with the test for each coefficient of the regression equation (Tables 2 and 3). The significance level and confidence coefficients (CI) were set to 0.5 and 0.95, respectively.
.")
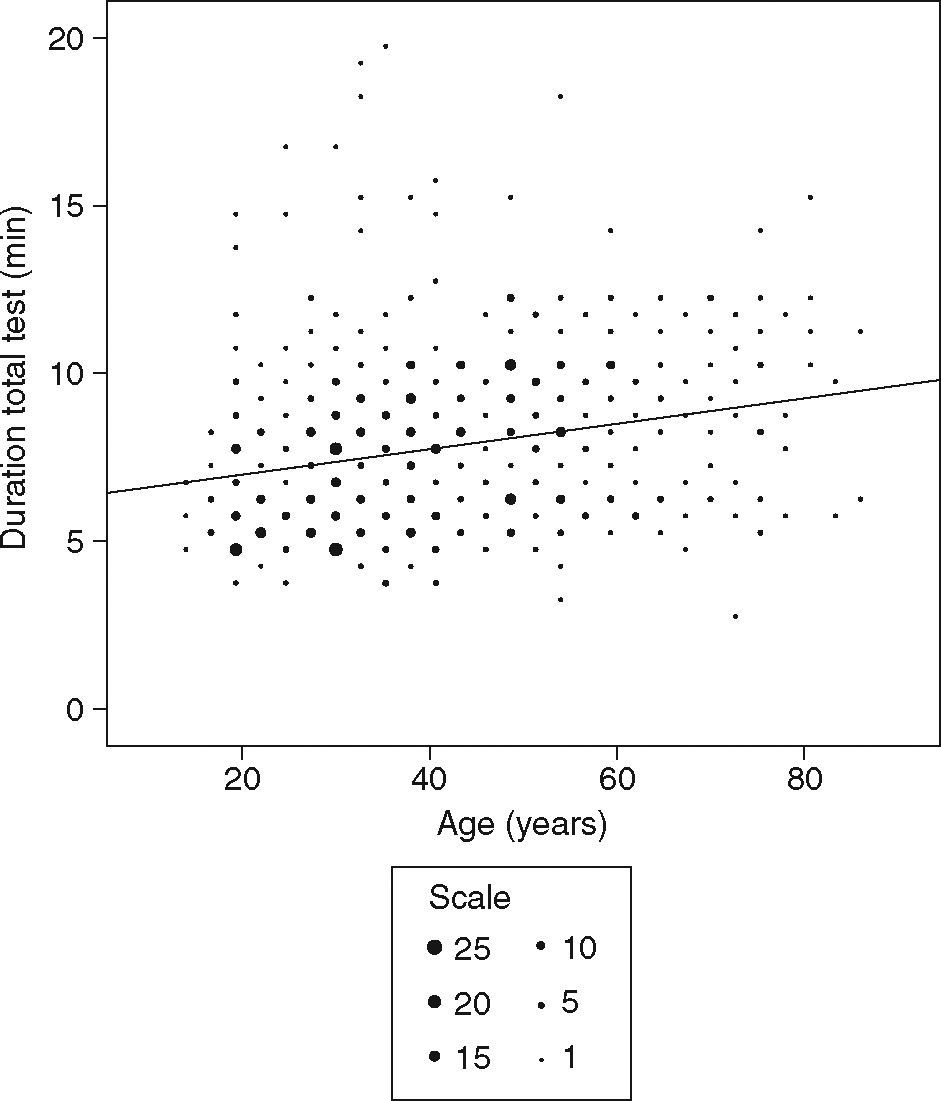
Total test duration as function of age. Linear regression line according to table 2. Individual data points are grouped into bins of different dot size that indicate the number of points in the bin (scale).
 according to table 2 (A). Straylight as function of age fitted to a logarithmic model: log(s) = C + log(1 + (age_65)4) with the constant C=0.978 (B). Individual data points are grouped into bins of different dot size that indicate the number of points in the bin (scale). BCVA indicates the best-corrected visual acuity.")
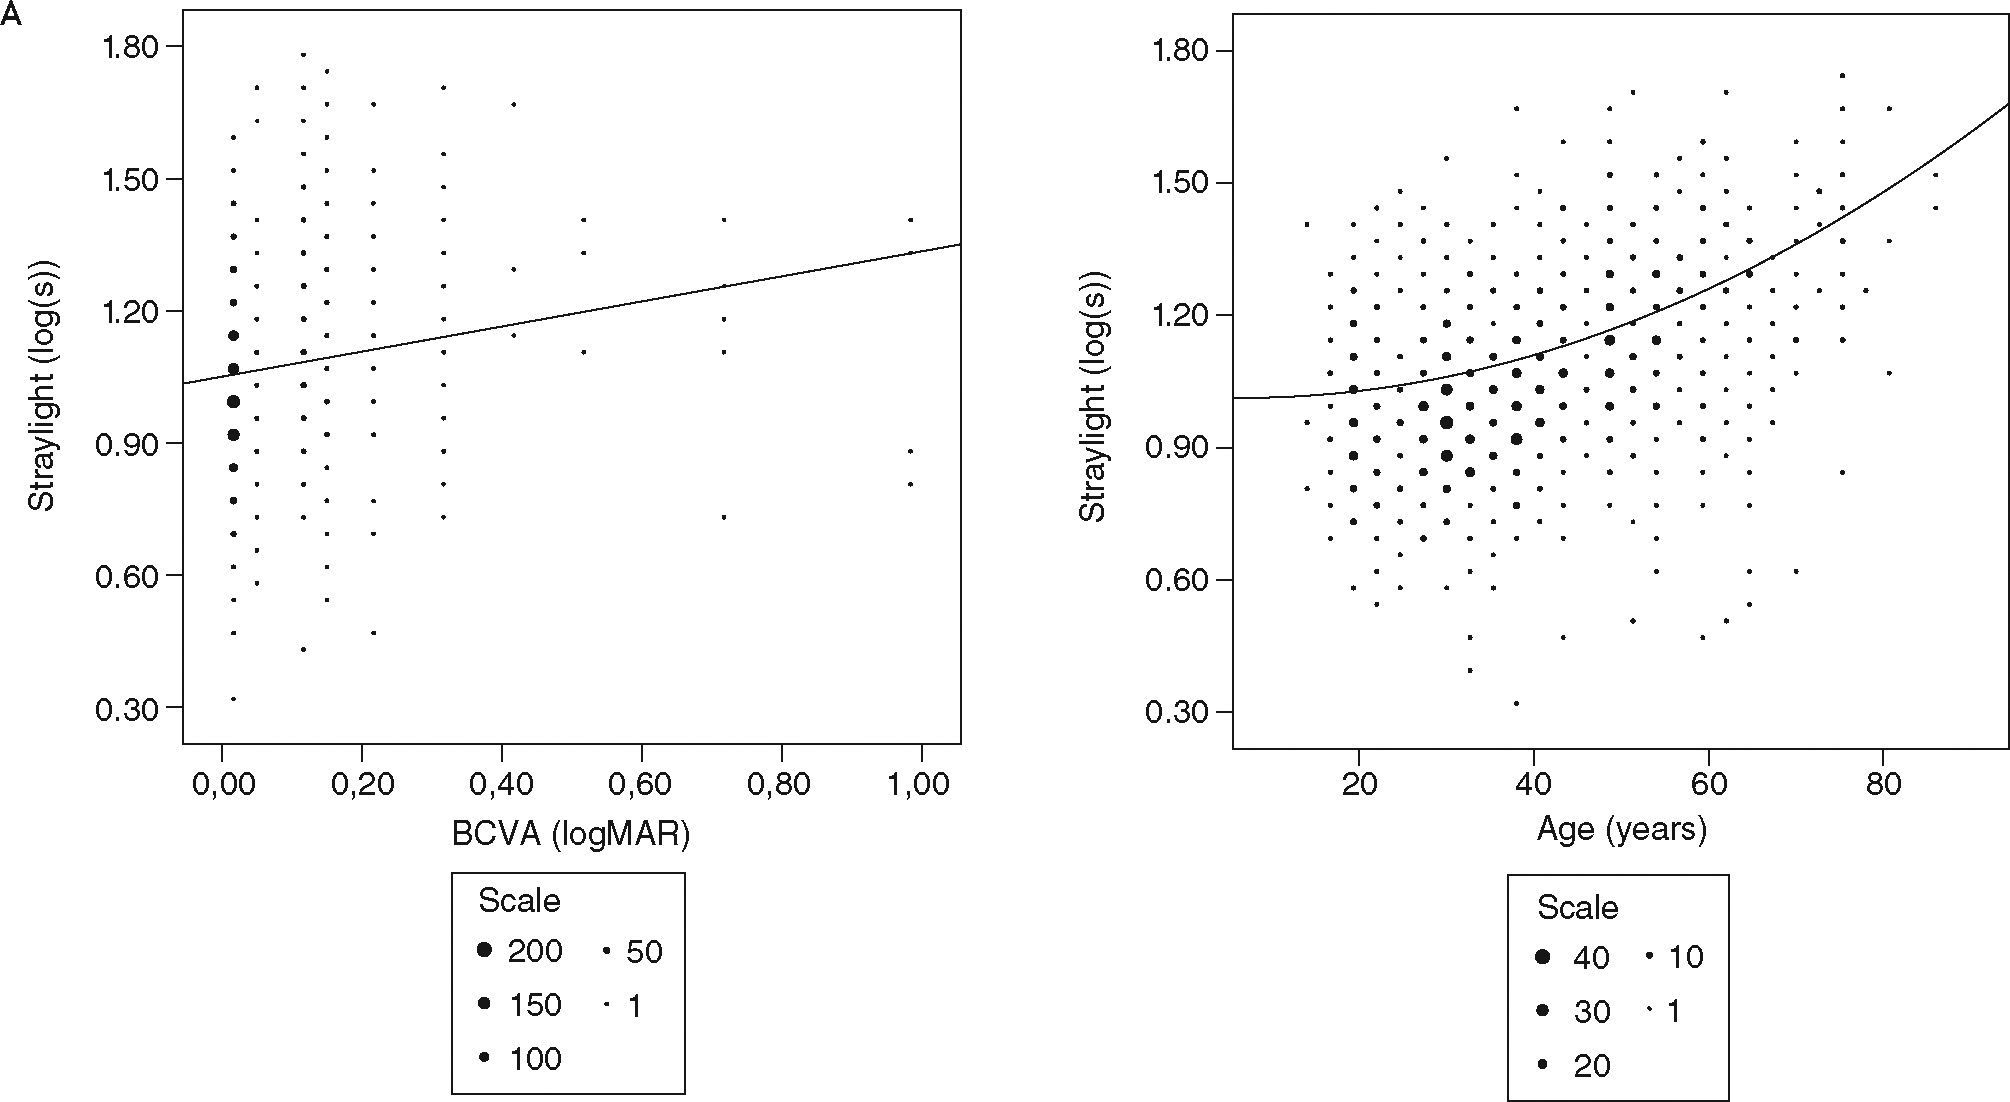
Straylight as function of BCVA with linear regression line (R2=0.022) according to table 2 (A). Straylight as function of age fitted to a logarithmic model: log(s) = C + log(1 + (age_65)4) with the constant C=0.978 (B). Individual data points are grouped into bins of different dot size that indicate the number of points in the bin (scale). BCVA indicates the best-corrected visual acuity.
 of used range setting minus measured log(s) with quadratic regression curve according to table 3. Individual data points are grouped into bins of different dot size that indicate the number of points in the bin (scale).")
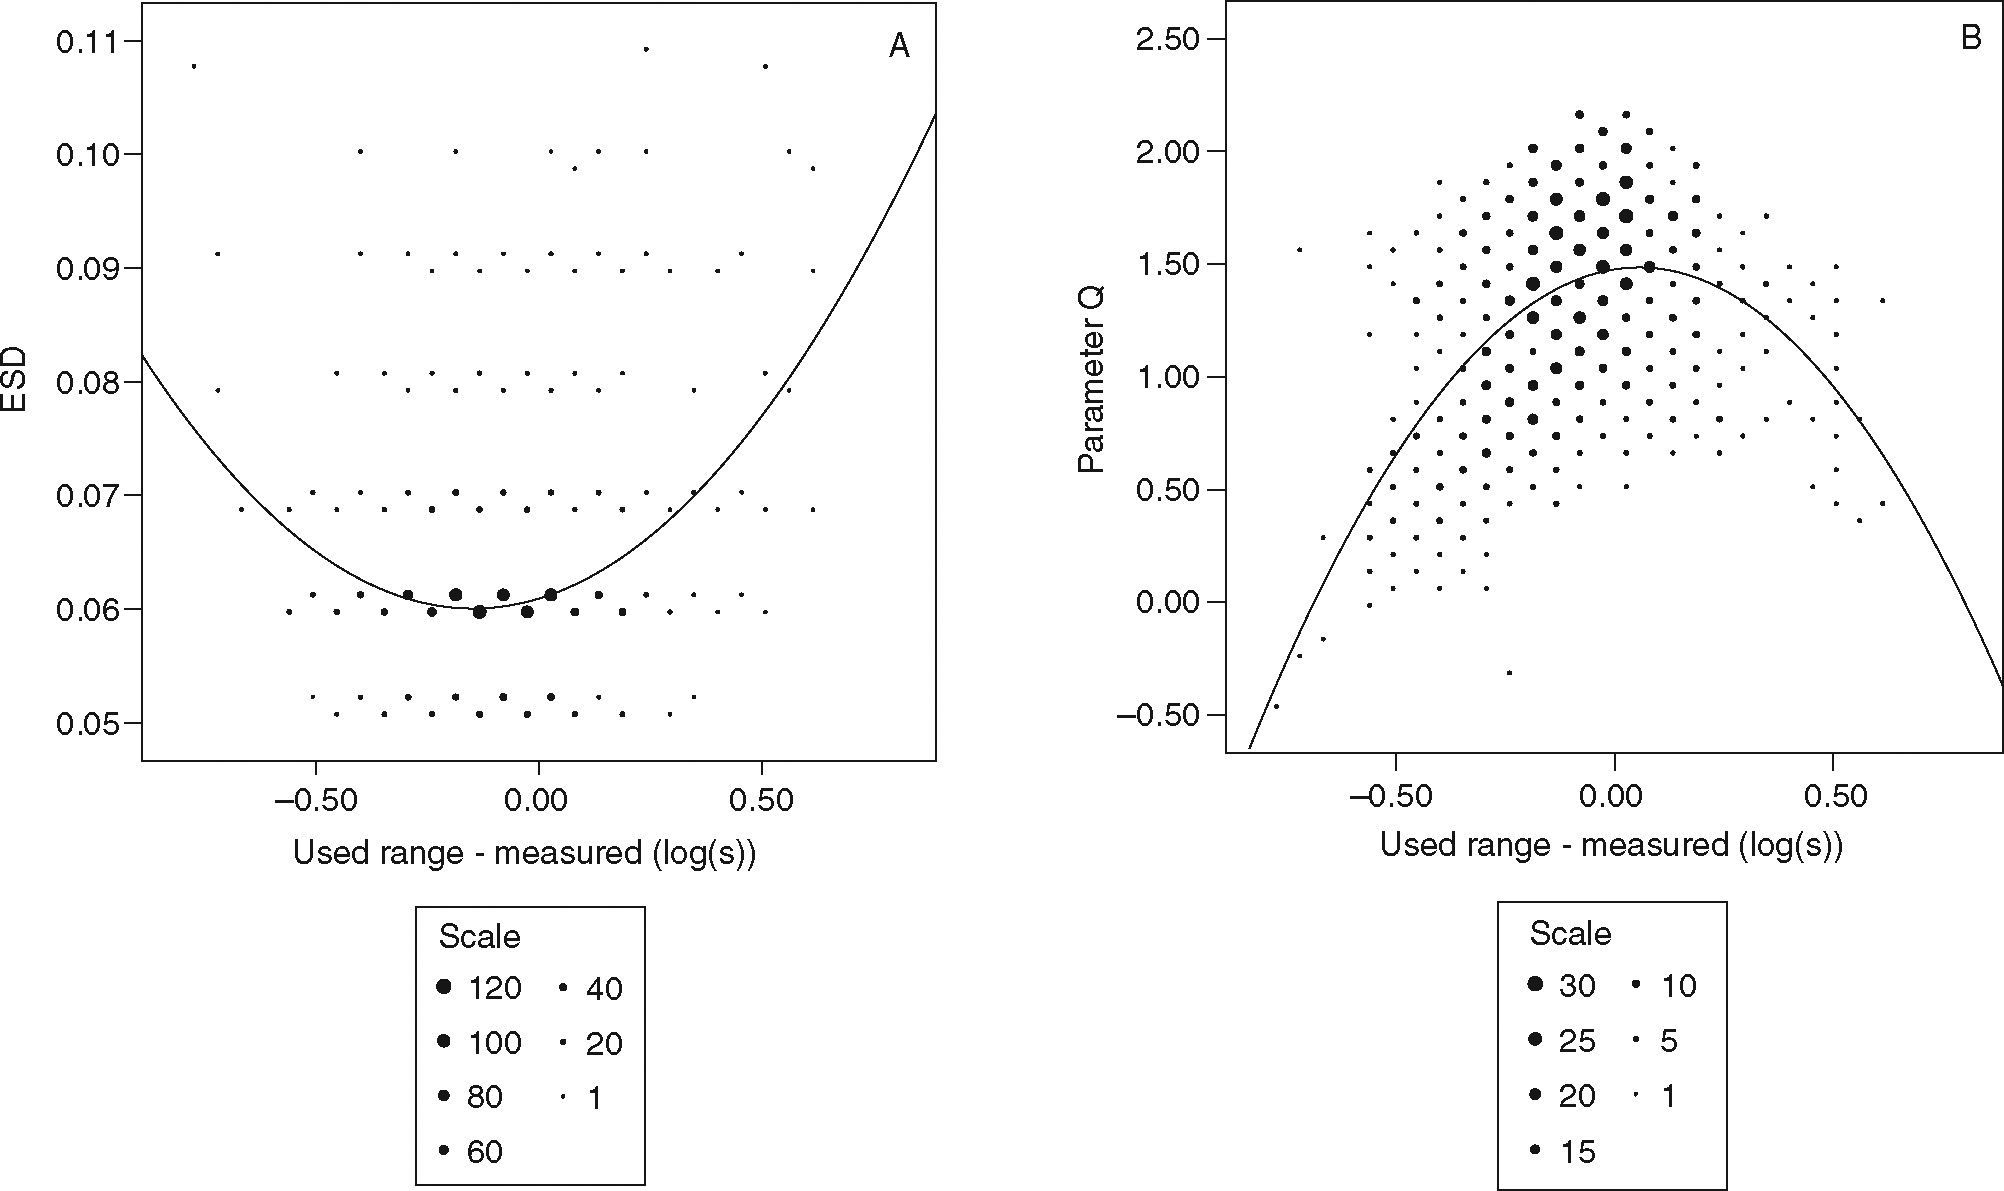
Quality parameter ESD and Q as function of centre log(s) of used range setting minus measured log(s) with quadratic regression curve according to table 3. Individual data points are grouped into bins of different dot size that indicate the number of points in the bin (scale).
, mean straylight (C) and mean BCVA (E) for the different degrees of this blinding. Subjective blinding was grouped as “no” (n=293), “some” (n=121), “moderate” (n=234), “strong” (n=59) and “very strong” (n=10). Distribution of avoidance of driving at night grouped by testing centres (B), mean straylight (D) and mean BCVA (F) for both groups; “yes” driving at night (n=542) and “no” avoiding driving at night (n=168). ASEB indicates Barcelona; ASEZ, Zaragoza; BCVA, the best-corrected visual acuity; CREP, Palma de Mallorca; error bars indicate the confidence interval.")
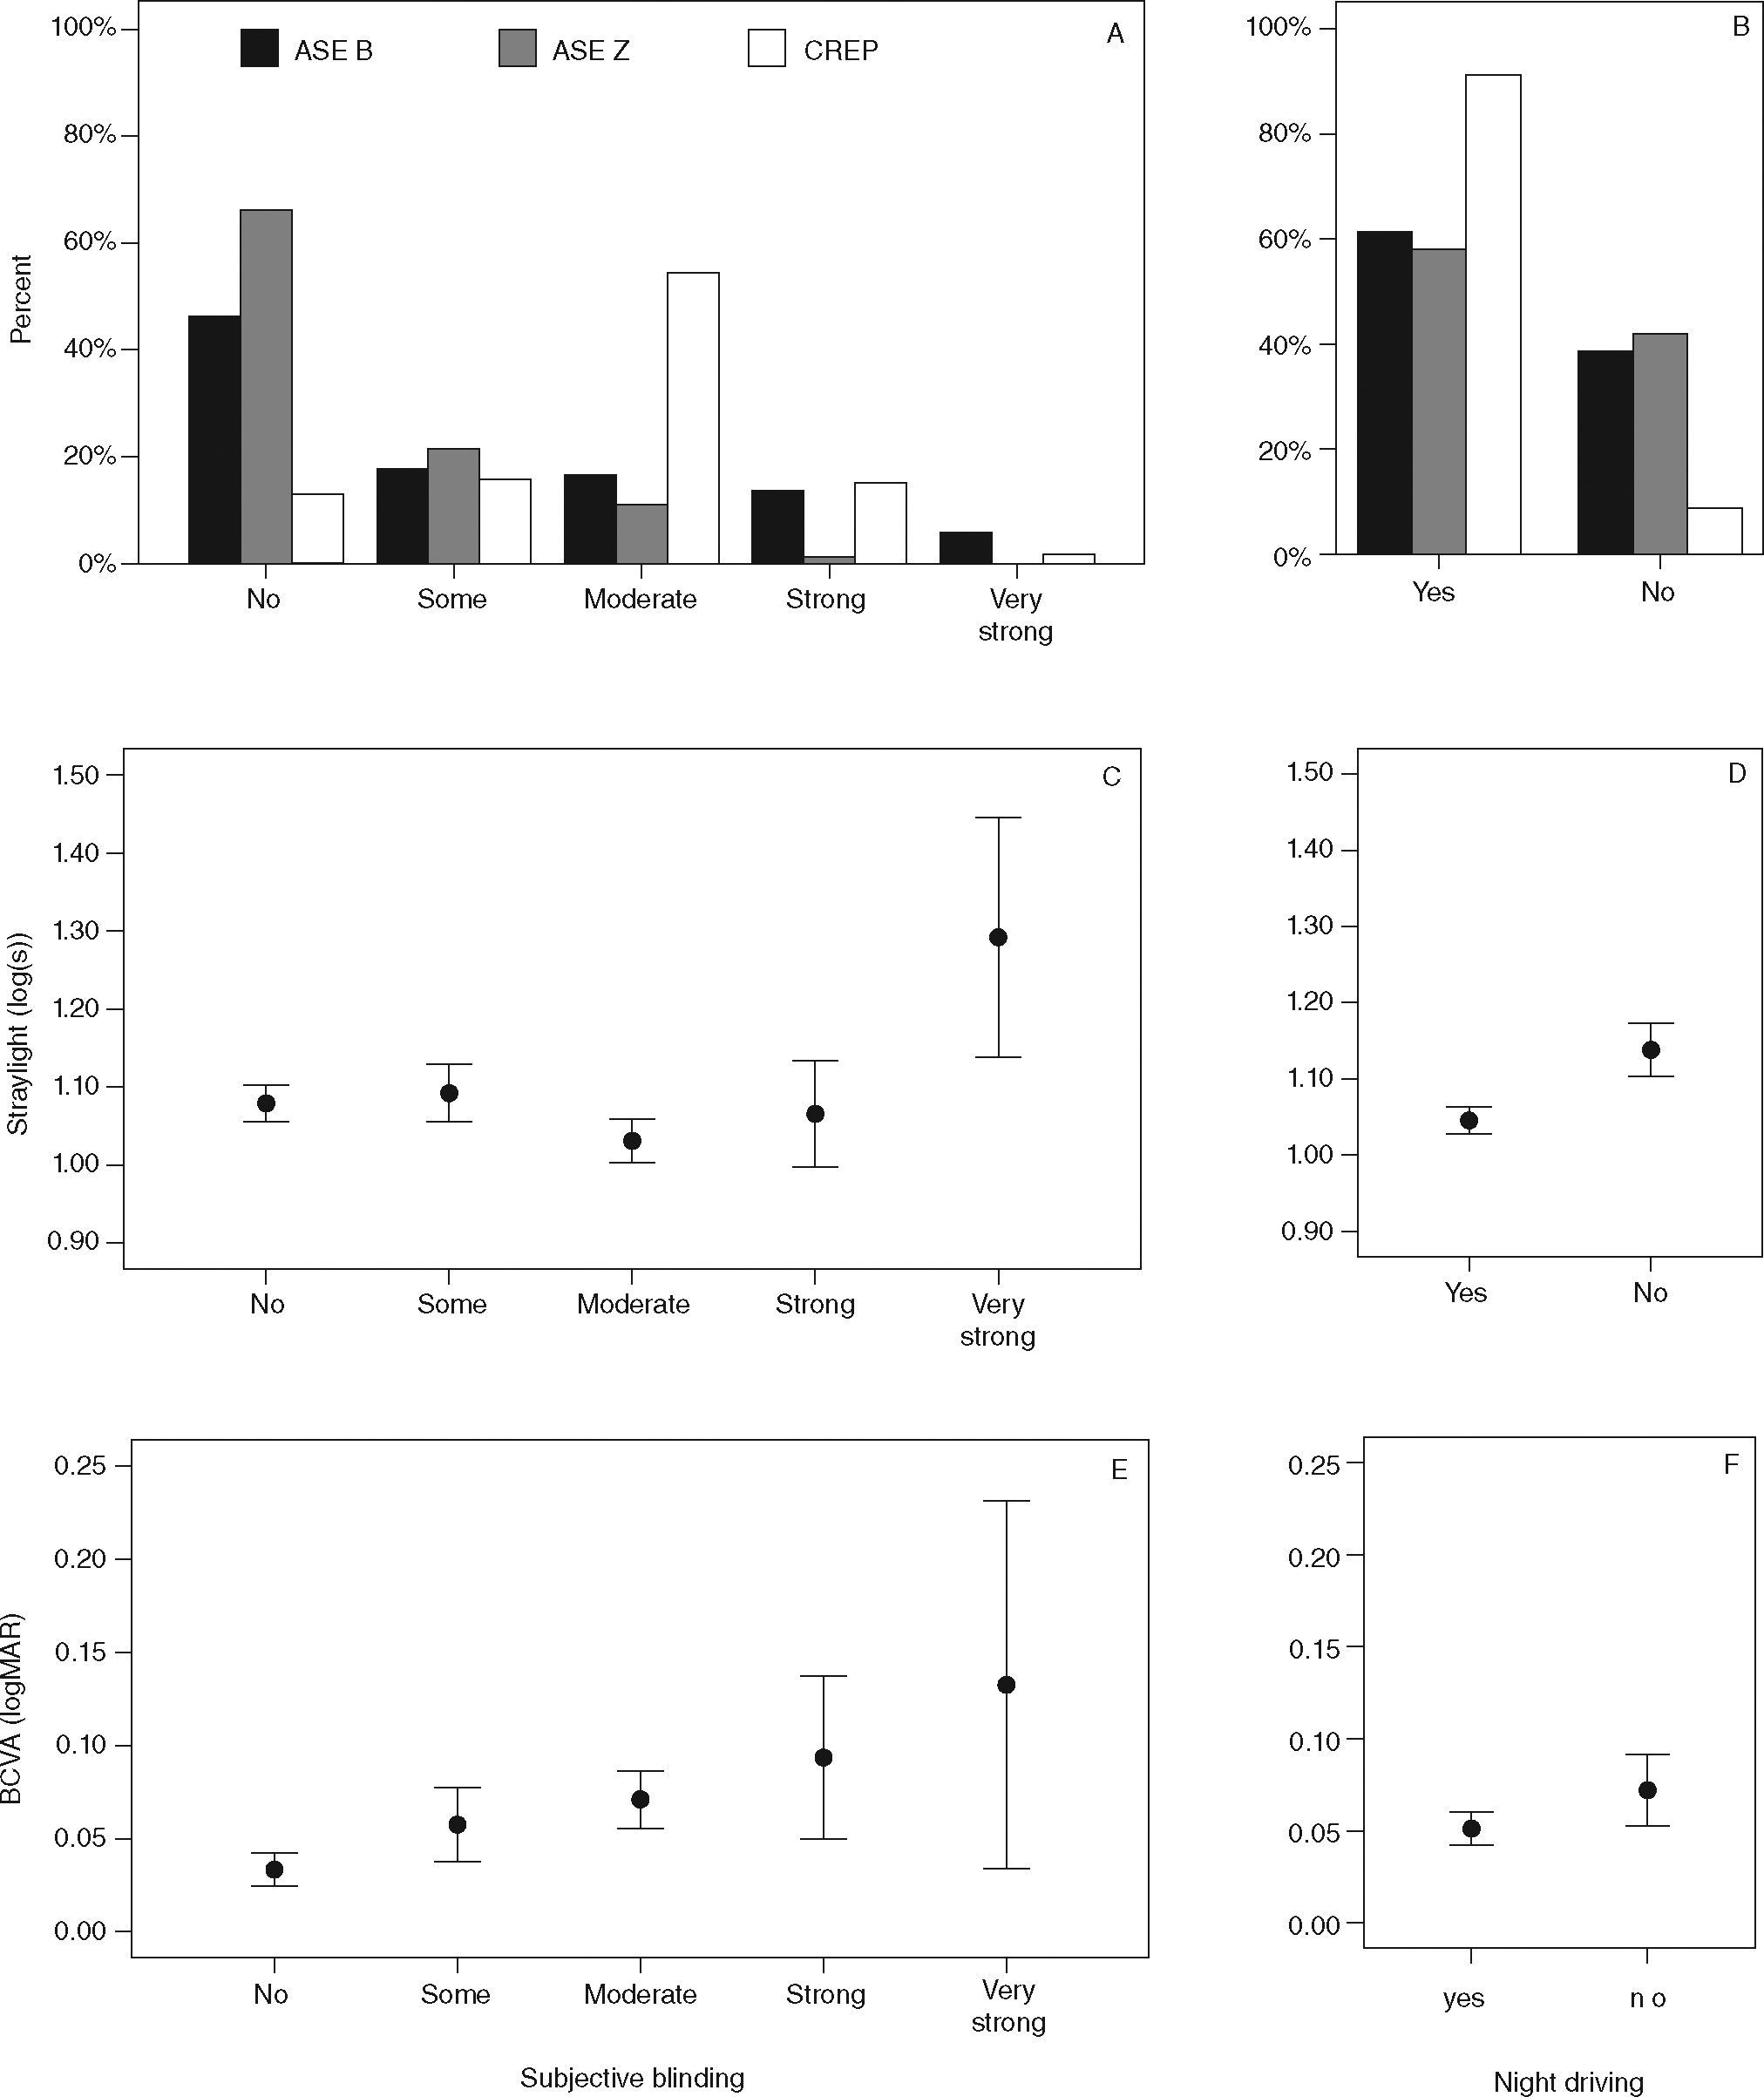
Distribution of the degree of driver's self-reported subjective blinding at night grouped by testing centre (A), mean straylight (C) and mean BCVA (E) for the different degrees of this blinding. Subjective blinding was grouped as “no” (n=293), “some” (n=121), “moderate” (n=234), “strong” (n=59) and “very strong” (n=10). Distribution of avoidance of driving at night grouped by testing centres (B), mean straylight (D) and mean BCVA (F) for both groups; “yes” driving at night (n=542) and “no” avoiding driving at night (n=168). ASEB indicates Barcelona; ASEZ, Zaragoza; BCVA, the best-corrected visual acuity; CREP, Palma de Mallorca; error bars indicate the confidence interval.
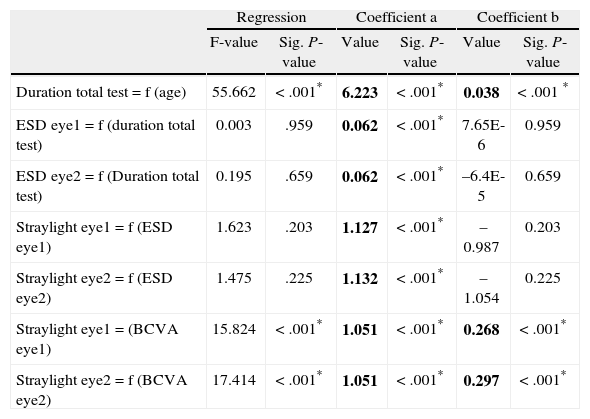
Statistical results of regression of test duration as a function age, quality parameter ESD as function of test duration, straylight as function of ESD and BCVA. Results of best-fit-least-order polynomial of the type: y = a + bx. Significance marked with asterisk. Significant regression lines and raw data are shown in figure 1 and 2a. (Age in years, Duration in min, BCVA in logMAR)
| Regression | Coefficient a | Coefficient b | ||||
| F-value | Sig. P-value | Value | Sig. P-value | Value | Sig. P-value | |
| Duration total test = f (age) | 55.662 | < .001* | 6.223 | < .001* | 0.038 | < .001 * |
| ESD eye1 = f (duration total test) | 0.003 | .959 | 0.062 | < .001* | 7.65E-6 | 0.959 |
| ESD eye2 = f (Duration total test) | 0.195 | .659 | 0.062 | < .001* | –6.4E-5 | 0.659 |
| Straylight eye1 = f (ESD eye1) | 1.623 | .203 | 1.127 | < .001* | –0.987 | 0.203 |
| Straylight eye2 = f (ESD eye2) | 1.475 | .225 | 1.132 | < .001* | –1.054 | 0.225 |
| Straylight eye1 = (BCVA eye1) | 15.824 | < .001* | 1.051 | < .001* | 0.268 | < .001* |
| Straylight eye2 = f (BCVA eye2) | 17.414 | < .001* | 1.051 | < .001* | 0.297 | < .001* |
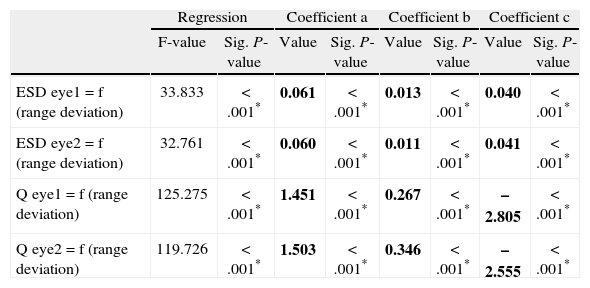
Statistical results of regression of quality parameters ESD and Q as a function of range setting minus measured log(s) (“range deviation”). Results of best-fit-least-order polynomial of the type: y = a + bx + cx2 with × as the “range deviation”. Significance marked with asterisk. Curves and raw data are shown in figure 3.
| Regression | Coefficient a | Coefficient b | Coefficient c | |||||
| F-value | Sig. P-value | Value | Sig. P-value | Value | Sig. P-value | Value | Sig. P-value | |
| ESD eye1 = f (range deviation) | 33.833 | < .001* | 0.061 | < .001* | 0.013 | < .001* | 0.040 | < .001* |
| ESD eye2 = f (range deviation) | 32.761 | < .001* | 0.060 | < .001* | 0.011 | < .001* | 0.041 | < .001* |
| Q eye1 = f (range deviation) | 125.275 | < .001* | 1.451 | < .001* | 0.267 | < .001* | –2.805 | < .001* |
| Q eye2 = f (range deviation) | 119.726 | < .001* | 1.503 | < .001* | 0.346 | < .001* | –2.555 | < .001* |
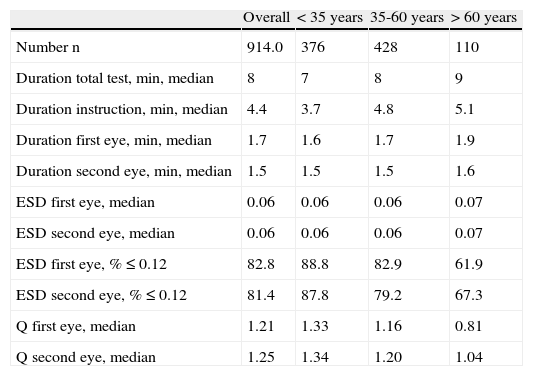
Total C-quant test duration increases slightly with age from a median of 7 min (< 35 years) to a median of 9 min (> 60). Median instruction time for the subject is 4.4 min and increases also slightly with age. On average, the first eye is measured in 1.7 minutes and the second in 1.5 minutes (Table 4). The regression of total test duration as a function of age is significant (Table 2 and Figure 1). Median of the quality parameter ESD is 0.06 for the first and second eye, except for the oldest age group with 0.07. At first attempt, 82 % of all subjects produced reliable results (ESD < 0.12). The median of the quality parameter Q was 1.21 for the first measured eye and 1.25 for the second (Table 4). The quality parameter ESD was independent of the total test duration for the first and second eye for all measurements (Table 2). After applying the ESD cut-off criteria of 0.12, the measured Straylight is independent of ESD (Table 2).
Number of subjects, test duration and quality parameters ESD and Q for different age groups
| Overall | < 35 years | 35-60 years | > 60 years | |
| Number n | 914.0 | 376 | 428 | 110 |
| Duration total test, min, median | 8 | 7 | 8 | 9 |
| Duration instruction, min, median | 4.4 | 3.7 | 4.8 | 5.1 |
| Duration first eye, min, median | 1.7 | 1.6 | 1.7 | 1.9 |
| Duration second eye, min, median | 1.5 | 1.5 | 1.5 | 1.6 |
| ESD first eye, median | 0.06 | 0.06 | 0.06 | 0.07 |
| ESD second eye, median | 0.06 | 0.06 | 0.06 | 0.07 |
| ESD first eye, % ≤ 0.12 | 82.8 | 88.8 | 82.9 | 61.9 |
| ESD second eye, % ≤ 0.12 | 81.4 | 87.8 | 79.2 | 67.3 |
| Q first eye, median | 1.21 | 1.33 | 1.16 | 0.81 |
| Q second eye, median | 1.25 | 1.34 | 1.20 | 1.04 |
There is a weak linear regression between straylight and BCVA (Table 2 and Figure 2a). The relation of straylight and age was fitted to a logarithmic model as applied before in the literature 13: log(s) = C + log(1 + (age_65) 4 with the constant C = 0.978 (Figure 2b).
We found a significant quadratic relationship between both quality parameters ESD and Q and the deviation of the range setting from the measured log(s) (Table 3 and Figure 3). The best ESD was achieved with a slightly lower range setting than measured log(s) (-0.15 log(s)) and the best Q with a slightly higher selection of the range setting (+0.06 log(s)).
The distribution of subjective blinding and the avoidance of driving at night was very different between test centres (Figures 4a and 4b). We did not find a significant difference in measured straylight between the groups “no”, “some”, “moderate” and “strong” blinding considering all centre together. Only drivers with “very strong” subjective blinding had significantly higher straylight values than subjects with “no” subjective blinding (Figure 4c). However, drivers avoiding using their car at night had significant higher straylight values than subjects driving at night (Figure 4d). Comparing the same for BCVA, we find a significant difference between subjects with “no” subjective blinding and “moderate” and “strong” subjective blinding, but not with “very strong” group (Figure 4e). BCVA in subjects driving at night was not significantly different to subjects avoiding using their car at night (Figure 4f).
DiscussionWith an average total test duration of 8 minutes for two eyes, including 4 1/2 minutes instruction time, the C-quant measure is reasonable fast. A slight increase of the total test duration with age was expected and should be acceptable. The 82 % of reliable test results at first attempt was a bit lower than expected. Probably due to the time pressure of the routine work at the medical testing centres. Good subject instruction is important to get first attempt reliable results.
The quality parameter ESD is an important asset of the straylight measurements with the C-Quant. Figure 3a shows a huge preponderance of values around 0.06 log units, which is surprisingly good for a field study, comparing earlier studies. Figure 3a also shows quite a wide permissibility for the chosen range setting. A difference of ± 0.5 log units is well tolerated, in correspondence with the findings of a Monte Carlo simulation study 25 Moreover, this parameter proved to be independent of the total test duration. After applying the cut-off criteria for reliable results (ESD < 0.12) measured straylight is independent of ESD. That means that al straylight results with ESD < 0.12 can be used / are valid.
The weak linear relation between straylight and BCVA that we found is consistent with earlier studies. 15 As argued, straylight is a largely independent aspect of quality of vision, complementing visual acuity. For the relation of straylight and age, we found the same logarithmic relation as in previous studies. 13 Our constant C (0.978) is higher than in the European Driver study 13 (0.87). This can probably be explained by the fact that we did not exclude subjects with cataract or other ocular opacities in the present study. Therefore the average straylight values are expected to be higher.
The differences between the different centres with respect to self reported subjective blinding is puzzling. At the centre in Zaragoza, the vast majority reported “no” or “some” blinding at night. At the centre in Barcelona, the distribution was more spread from “no” to “very strong” blinding. In Palma de Mallorca a majority of drivers reported “moderate” blinding (Figures 4a and 4b). One might speculate that self-reported subjective blinding results depend strongly on the way the test is administered. The relation with straylight was weak because only drivers with “very strong” subjective blinding had significantly higher straylight values than subjects with “no” subjective blinding (Figure 4c). With respect to BCVA, there was no clear trend for the different groups of subjective blinding (Figure 4e). In case of the question avoiding driving at night, the results are more clear, with a significant higher straylight value in the group avoiding driving at night as compared with the night drivers (Figure 4d). BCVA seem not to influence this decision (Figure 4f).
Also in other studies the discrepancy between objective impairment and subjective handicap has drawn attention. For visual acuity, the relation between impairments and unsafe driving behaviour (accidents, traffic violations) is rather weak.26,27 A recent study on the role of visual impairments in traffic accidents in elderly drivers 28 showed that glare sensitivity and visual field loss were significant predictors of crash involvement. Acuity, contrast sensitivity, and stereo acuity were not associated with crashes.
If drivers do not experience their difficulties regarding glare, they may not adjust their driving strategy. This may translate into a stronger relation with traffic accidents.28 However, data on the relation of elevated straylight values and traffic accidents is still scarce, presumably due to the absence of an adequate measurement technique. Since an objective technique for intraocular straylight measurements is available now, (also commercially: C-Quant by Oculus GmbH), the role of glare sensitivity in traffic safety may gain importance in the future.
Conflict of interestThe Netherlands Royal Academy has a patent with Van den Berg inventor licensed to Oculus GmbH for the C-Quant straylight meter. None of the authors has any proprietary or financial interest in the results that were obtained in this study.
The authors thank M. Dajani, Tecsalud in Palma de Mallorca and Damiàn Silguero, Centre Mèdic Cerdà in Barcelona for taking the measurements at their medical testing centres. We thank Elena Valdés Rodríguez from Dirección General de Tráfico for organizational help with the field test.


