


To assess the impact of ocular biometric variables on the visual performance achieved with a low addition trifocal intraocular lens (MIOL).
MethodsRetrospective observational study including 34 eyes. Preoperative measured variables included mean corneal power (Km), corneal regular astigmatism (RA), anterior chamber depth (ACD), axial length (AXL), total irregular astigmatism (IA), spherical aberration (SA) and distance from pupil center to vertex normal (µ). Same variables were retrieved from the three month visit follow-up in addition to the actual lens position (ALP), the calculated effective addition (EA), the IOL centration from vertex normal (d), and the visual acuity defocus curve. The area under the defocus curve was computed along the total curve (TAUC) and ranges for far (FAUC), intermediate (IAUC) and near vision (NAUC). The sample was split in two groups of 17 eyes with TAUCs above and below the mean, and the differences among groups for different ocular parameters were assessed.
ResultsThe group of eyes above TAUC of 2.03 logMAR*m-1 showed significantly lower Km and greater AXL and SA. Km was negatively correlated with TAUC and NAUC. NAUC was negatively correlated with IA and positively with d. A multiple lineal regression model including Km, d, and IA predicted NAUC (r-square = 34%). No significant differences between IA and SA were found between preoperative and postoperative values but µ significantly decreased after surgery.
ConclusionsThe mean corneal power, irregular astigmatism, and centration from vertex normal should be considered for optimizing the near visual performance with this MIOL.
Valorar el impacto de las variables biométricas oculares sobre el rendimiento visual con una lente intraocular trifocal de baja adición (MIOL).
MétodosEstudio observacional retrospectivo que incluyó 34 ojos. Las variables preoperatorias medidas incluyeron potencia corneal media (Km), astigmatismo regular corneal (AR), profundidad de la cámara anterior (ACD), longitud axial (AXL), astigmatismo irregular total (AI), aberración esférica (AE) y distancia entre el centro de la pupila y el vértice normal (µ). Algunas variables se obtuvieron de la visita de seguimiento a los tres meses, a las que se añadieron la posición real de la lente (ALP), la adición efectiva (AE), el centrado de las LIO desde el vértice normal (d), y la curva de desenfoque de agudeza visual. El área bajo la curva de desenfoque se calculó a lo largo de la curva total (TAUC) así como los rangos para visión de lejos (FAUC), intermedia (IAUC) y de cerca (NAUC). La muestra se dividió en dos grupos de 17 ojos con TAUCs por encima y por debajo de la media, valorándose las diferencias entre los grupos para los diferentes parámetros oculares.
ResultadosEl grupo de ojos con un valor por encima de TAUC igual a 2,03 logMAR*m-1 reflejó un menor Km y valores mayores de AXL y AE. Km se correlacionó negativamente con TAUC y NAUC. NAUC se correlacionó negativamente con AI, y positivamente con d. Un modelo de regresión lineal múltiple incluyendo Km, d, y AI realizó la predicción de NAUC (R2 = 34%). No se encontraron diferencias significativas entre AI y AE entre los valores preoperatorios y postoperatorios, aunque µ disminuyó significativamente tras la cirugía.
ConclusionesLa potencia corneal media, el astigmatismo irregular y el centrado desde el vértice normal deberían considerarse para optimizar el desempeño visual de cerca con MIOL.
Motivation to achieve spectacle independence is likely the most critical deciding factor for the interest in multifocal intraocular lenses (MIOLs) implantation.1 MIOLs have become an alternative for treating presbyopia by Refractive Lens Exchange (RLE) due to the fact that many middle-aged and older patients are involved in sports and other activities for which patients demand spectacle independence.2 However, it is well known that surgery with intraocular lenses (IOLs) may result in adverse events and the MIOL implantation may present additional adverse events to those already established for monofocal IOLs, such as dysphotopsia.3 This makes the concepts of safety, efficacy and predictability in RLE even more important than in cataract surgery because far distance visual performance is superior in RLE patients.2
Standards have been proposed for reporting the refractive outcomes of intraocular lens–based refractive surgery.4 These standards are very useful for comparing the general results among procedures with different MIOLs, but are not enough for understanding the performance of a MIOL as a function of biometric eye parameters. Since visual performance with MIOLs has been hypothesized to be related with angle kappa and MIOL centration in the presence of dysphotopsia,5,6 corneal spherical aberration,7,8 regular corneal astigmatism,9,10 corneal irregular astigmatism,11,12 and effective lens addition,13–15 it seems reasonable to report the impact of these variables in the visual performance of each MIOL in such a way the vision of the most exigent patients, as in those demanding RLE, could be better predicted. The main aim of this study is to evaluate the performance of a low addition trifocal lens by means of computing the area under the visual acuity defocus curves (VADC)16 as a function of biometric parameters. A secondary aim is to propose a model for the prediction of the visual performance with the MIOL as a function of these biometric eye parameters.
Subjects and methodsSubjectsThis study was approved by the local ethics committee of research and was performed in adherence to the tenets of the Declaration of Helsinki. Data of 34 eyes from 34 subjects consecutively implanted with a trifocal low addition intraocular lens at Qvision (Ophthalmology Department at Vithas Virgen del Mar Hospital) were retrospectively retrieved from our historical database. Only one eye randomly selected per subject was included in the analysis. Exclusion criteria included any adverse event presented during surgery that might affect to the performance with the lens, history of corneal refractive surgery and any other condition for which the implant of a MIOL was not recommended.17
Surgery procedure and intraocular lens descriptionAll the eyes retrospectively retrieved were operated on by the same surgeon (JF) by means of femtosecond laser-assisted cataract surgery through a temporal clear corneal incision (CCI) of 2.5 mm performed with the laser. The IOL included in the analysis was the difractive Alsafit Trifocal violet light filter (VF) lens (Alsanza GmbH, Germany), which has a 6 mm biconvex optic aspheric with a -0.165 µm correction of SA and total light transmission of 87.9%, this distributed 50% for far, 20% for intermediate and 30% for near (information obtained from manufacturer brochure). The addition powers at the IOL plane were +1.50 D for intermediate vision and +3.00 D for the near vision. The platform consisted of a modified plate haptic of 11 mm (0° angled) with 4 flexible adjustable haptic fins (30° angled) at the corner location of the platform. The haptic locations during the implantation were approximately horizontal in the temporal nasal direction (0°–180°).
Measured variablesBiometrical parameters obtained during the preoperative visit included mean corneal power (Km), corneal regular astigmatism (RA), anterior chamber depth (ACD) and axial length (AXL) measured with IOL Master 500 (Carl Zeiss Meditec Inc., Dublin, CA, USA). Total irregular astigmatism at 4 mm (IA), total corneal spherical aberration at 6 mm (SA) and distance from pupil center to vertex normal (chord mu, µ)18 measured with the Pentacam system (Oculus GmbH, Wetzlar, Germany). The same variables were retrieved from the three month postoperative visit in addition to the actual lens position (ALP) measured with Pentacam system from the anterior corneal surface to the anterior MIOL surface. The addition at the IOL plane was computed considering the dioptric power of the implanted MIOL, approximating ALP to ELP,19 and the Km according to the Holladay’s refractive vergence formula.15 Then, the effective addition (EA) at the spectacle plane was computed considering a vertex distance of 12 mm. The monocular VADC, measured with the Multifocal Lens Analyzer for iPad (version 1.0.8, 85% screen brightness, background luminance of ∼250 cd/m2),20 was also obtained at the three month postoperative visit (from +1.00 D to −4.00 D in 0.50 D steps). The automated procedure for measuring the VADC with Multifocal Lens Analyzer has been previously described.20–22
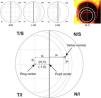
For calculating the centration of the MIOL versus the vertex normal (d), a slit lamp picture was taken and an ordinal scale was used to evaluate subjectively the degree of MIOL centration (Fig. 1). The geometric center of the IOL diffractive rings was estimated in reference to the pupil center, considering a negative displacement for temporal or inferior directions and a positive displacement for superior or nasal directions. The centration was established horizontally and vertically (H, V) with the following ordinal scale: 0, the first ring was centered to the pupil; 1, the first ring was 25% decentered; 2, the first ring was 50% decentered and the pupil center matched to the edge of the first ring; 3, the pupil center matched the second ring; 4, the pupil center goes beyond the second ring (Fig. 1, top). Considering that the diameter of the first ring is approximately 1.2 mm (estimated by the Pentacam measurement), the level 1 would correspond to an approximated decentration of 0.3 mm and the level 2 to a decentration of 0.6 mm. Thus, the MIOL centration with respect to the vertex normal was computed considering dx = H*0.3 - µx and dy = V * 0.3 − µy, where d is the distance from the vertex normal to the center of the ring, H and V were the subjectively ordinal scale result, µ is the distance from pupil center to the vertex normal measured with Pentacam,23 and 0.3 mm is a 25% of displacement considering a diameter of the first ring of 1.2 mm (Fig. 1, bottom). The displacement measured with this method has demonstrated to be related with visual performance in intermediate vision with a high addition MIOL.21

Top image shows an example of the ordinal scale used for evaluating the intraocular lens centration. The diagram describes the right eye with the pupil divided by a vertical line. The first ring of the lens is divided in 4 sections that serve as a reference to measure the displacement to the pupil center. From left to right, the lens is centered (0.0), 25% temporal (−1.0) and 50% temporal (−2.0) the size of the first ring. The last top image shows a real example with pupil divided by a red cross and rings of the lens marked with white circles for a clear visualization. For vertical centration, the same approach was performed dividing the pupil by a horizontal line. Bottom image shows the system of coordinates used in the research (For interpretation of the references to colour in this figure legend, the reader is referred to the web version of this article).
A conversion of the µ center of coordinates was conducted for unifying sign notation between left and right eyes with the Refractive Analysis (1.0.0) toolbox for MATLAB (The Mathworks Inc., Natick, MA, USA).23,24 Areas under the curve were calculated in the same ranges of vision of a previous work21 for comparison purposes: total (TAUC), far (FAUC), intermediate (IAUC), and near (NAUC) areas under the curve. The Shapiro-Wilk test was used for testing normality of variable distributions. Mean differences among groups including distinct eyes were tested with the Student t-test for independent samples, whereas the Mann-Whitney test was used for variables non-normally distributed. Mean differences between preoperative and postoperative variables were assessed with the paired t-test. Furthermore, correlations were also evaluated with the Pearson or the Spearman’s correlations coefficients depending if the correlated variables followed or not a normal distribution, respectively. A predictive model of the NAUC was constructed by means of a multiple linear regression analysis and the simple regression analysis was used for prediction of linear related preoperative and postoperative variables. Both statistical analyses were conducted after confirming that the required assumptions were accomplished, including the Durbin-Watson statistic for independence of observations, the homoscedasticity, and the normally distribution of the residuals. The Limits of Agreement (LoAs) were also computed as the means of the differences ±2 SD between preoperative and postoperative variables.25 The statistical analyses were performed using the IBM SPSS 20.0 software for Windows (SPSS, Chicago, IL).
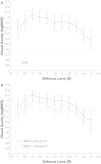
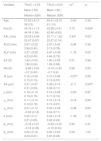
ResultsEyes from 11 men and 23 women with mean age of 59 ± 8 years were included in the analysis, ranging from 45 to 78 years old. Mean AXL was 23.17 ± 1.33 mm and median was 22.81 mm, ranging from 21.58 mm to 26.54 mm. The mean EA at the spectacle plane was 1.90 ± 0.05 D. Fig. 2A shows the mean VADC with a near vision peak at -2 D, close to the computed EA. Mean TAUC was 2.03 ± 0.70, FAUC was 0.61 ± 0.18, IAUC was 0.25 ± 0.12 and NAUC was 0.48 ± 0.28. Two mean VADC are shown in Fig. 2B, corresponding to a split of the sample in groups of 17 eyes above the mean TAUC of 2.03 and 17 eyes below this mean. Significant mean differences (m.d.) were found between groups m.d. = 1.12 (p < 0.001) for TAUC, m.d. = 0.23 (p < 0.0001) for FAUC, m.d. = 0.14 (p < 0.0001) for IAUC and m.d. = 0.34 (p < 0.0001). Group with higher TAUC has significantly lower Km, higher AXL and higher SA (Table 1).

Groups with total area under the curve of visual acuity higher and lower to mean.
| Variable | TAUC < 2.03 | TAUC ≥ 2.03 | t/za | p |
|---|---|---|---|---|
| Mean ± SD | Mean ± SD | |||
| Median (IQR) | Median (IQR) | |||
| Age | 57.82 ± 8.13 | 60.41 ± 8.15 | −0.93 | 0.36 |
| 58 (13) | 61 (13) | |||
| Km (D) | 44.74 ± 1.13 | 42.58 ± 2.61 | 3.15 | 0.005* |
| 44.54 (1.84) | 42.46 (4.63) | |||
| AXL (mm) | 22.63 ± 0.84 | 23.71 ± 1.52 | 2.34a | 0.02* |
| 22.47 (0.87) | 23.27 (2.14) | |||
| ACD (mm) | 2.97 ± 0.32 | 2.97 ± 0.42 | −0.94 | 0.36 |
| 2.88 (0.40) | 3.13 (0.78) | |||
| ALP (mm) | 4.27 ± 0.28 | 4.47 ± 0.38 | −1.76 | 0.09 |
| 4.23 (0.40) | 4.44 (0.73) | |||
| EA (D) | 1.90 ± 0.05 | 1.90 ± 0.05 | 0.01 | 0.99 |
| 1.90 (0.06) | 1.89 (0.08) | |||
| RA (D) | −0.66 ± 0.24 | −0.74 ± 0.35 | 0.68 | 0.50 |
| −0.7 (0.40) | −0.7 (0.6) | |||
| IA (µm) | 0.16 ± 0.06 | 0.15 ± 0.06 | −0.57a | 0.59 |
| 0.13 (0.13) | 0.15 (0.07) | |||
| SA (µm) | 0.31 ± 0.07 | 0.39 ± 0.15 | −2.11 | 0.047* |
| 0.31 (0.09) | 0.36 (0.17) | |||
| µ (mm) | 0.18 ± 0.10 | 0.19 ± 0.08 | −0.03 | 0.97 |
| 0.19 (0.15) | 0.17 (0.10) | |||
| µx (mm) | 0.11 ± 0.13 | 0.12 ± 0.14 | −0.14 | 0.89 |
| 0.10 (0.18) | 0.10 (0.21) | |||
| µy (mm) | 0.01 ± 0.12 | 0.03 ± 0.09 | −0.48 | 0.64 |
| −0.03 (0.16) | 0.04 (0.11) | |||
| d (mm) | 0.25 ± 0.17 | 0.34 ± 0.19 | −1.39 | 0.18 |
| 0.21 (0.26) | 0.32 (0.24) | |||
| dx (mm) | −0.16 ± 0.21 | −0.22 ± 0.20 | 0.83 | 0.41 |
| −0.14 (0.35) | −0.19 (0.24) | |||
| dy (mm) | 0.02 ± 0.15 | 0.02 ± 0.25 | 0.00 | 1.00 |
| 0.03 (0.21) | 0.00 (0.29) |
TAUC: total area under the curve; Km: mean corneal power; AXL: axial length; ACD: anterior chamber depth; ALP: actual lens position; EA: effective addition; RA: regular astigmatism; IA: irregular astigmatism; SA: spherical aberration; µ: distance from pupil center to vertex normal; µx: µ in horizontal cartesian coordinates; µy: µ in vertical cartesian coordinates; d: Intraocular lens centration from vertex normal; dx: d in horizontal cartesian coordinates; dy: d in vertical cartesian coordinates.
SD: standard deviation; IQR: interquartile range.
t: student t-test for independent samples.
za: Mann-Whitney test.
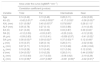
Correlations between the different variables measured postoperatively and AUCs are shown in Table 2. TAUC was negatively correlated with Km (r = −0.42, p = 0.01) and positively with the SA (r = 0.38, p = 0.03). SA was significantly correlated with FAUC (r = 0.39, p = 0.02) and IAUC (r = 0.37, p = 0.03) but not with NAUC (r = 0.12, p = 0.49). On the other hand, the NAUC was negatively correlated with the Km (r = −0.38, p = 0.03), as well as with the FAUC (r = −0.49, p = 0.003). Correlation of NAUC was also negative with the IA (ρ = −0.41, p = 0.02) and positive with the EA (ρ = 0.39, p = 0.02) and the d (ρ = 0.44, p = 0.009). A positive correlation was found between AXL and FAUC (r = 0.45, p = 0.007), but AXL was also correlated with Km (ρ = −0.85, p < 0.0001) and Km showed a correlation close to statistical significance with the SA (r = −0.34, p = 0.05).
Visual acuity defocus curve versus biometrical parameters.
| Area under the curve (logMAR * mm−1) | ||||
|---|---|---|---|---|
| Correlation coefficient (p-value) | ||||
| Variable | Total | Far | Intermediate | Near |
| Age | 0.14 (0.42) | 0.13 (0.48) | 0.28 (0.11) | −0.04 (0.83) |
| Km (D) | −0.42 (0.01)a* | −0.49 (0.003)a* | −0.17 (0.33)a | −0.38 (0.03)a* |
| AXL (mm) | 0.31 (0.08)a | 0.45 (0.007)a* | 0.07(0.69)a | 0.28 (0.11)a |
| ALP (mm) | 0.05 (0.78) | 0.27 (0.13) | 0.03 (0.86) | −0.14 (0.45) |
| EA (D) | 0.21 (0.23) | 0.03 (0.86) | 0.03 (0.87) | 0.39 (0.02)* |
| RA (D) | −0.12 (0.50) | −0.03 (0.87) | −0.20 (0.24) | −0.12 (0.52) |
| IA (µm) | −0.09 (0.63) | −0.15 (0.41) | −0.006 (0.97) | −0.41 (0.02)* |
| SA (µm) | 0.38 (0.03)a* | 0.39 (0.02)a* | 0.37 (0.03) a* | 0.12 (0.49)a |
| µ (mm) | 0.16 (0.37) | 0.26 (0.14) | 0.28 (0.11) | −0.02 (0.92) |
| µx (mm) | 0.07 (0.71) | 0.18 (0.31) | 0.13 (0.48) | −0.08 (-0.64) |
| µy (mm) | 0.19 (0.28) | 0.13 (0.45) | 0.21 (0.24) | 0.12 (0.50) |
| d (mm) | 0.34 (0.05)* | 0.19 (0.29) | 0.28 (0.11) | 0.44 (0.009)* |
| dx (mm) | −0.15 (0.40) | −0.17 (0.33) | −0.09 (0.62) | −0.19 (0.29) |
| dy (mm) | 0.10 (0.56)a | −0.07 (0.68)a | −0.001 (0.99)a | −0.02 (0.91)a |
Km: mean corneal power; AXL: axial length; ALP: actual lens position; EA: effective addition; RA: regular astigmatism; IA: irregular astigmatism; SA: spherical aberration; µ: distance from pupil center to vertex normal; µx: µ in horizontal cartesian coordinates; µy: µ in vertical cartesian coordinates; d: Intraocular lens centration from vertex normal; dx: d in horizontal cartesian coordinates; dy: d in vertical cartesian coordinates.
Two multiple regression models were run to predict NAUC. Model 1 with EA, IA and d was found to predict with statistical significantce NAUC, F(3, 30) = 6.64, p < .001, R2 = .399, adj. R2 = .339. The Model 2, including the Km, IA and d, predicted with statistical significance NAUC, F(3, 30) = 6.56, p < .002, R2 = .396, adj. R2 = .336. IA inclusion was not significant in Model 1. Regression coefficients, standard errors, and significances of each variable can be found in Table 3.
Multiple regression linear models for prediction of the near area under the curve.
| Variable | B | SEB | β | t | p |
|---|---|---|---|---|---|
| Intercept | −3.28 | 1.61 | −2.02 | 0.05 | |
| Computed addition (EA) | 1.99 | 0.83 | 0.34 | 2.39 | 0.02 |
| Vertex to IOL center (total) (d) | 0.57 | 0.23 | 0.37 | 2.49 | 0.02 |
| Irregular astigmatism at 4 mm (IA) | −1.14 | 0.70 | −0.25 | −1.64 | 0.11 |
| Intercept | 2.36 | 0.79 | 3.00 | 0.005 | |
| Corneal power (Km) | −0.04 | 0.02 | −0.33 | −2.35 | 0.03 |
| Vertex to IOL center (total) (d) | 0.53 | 0.23 | 0.34 | 2.32 | 0.03 |
| Irregular astigmatism at 4 mm (IA) | −1.44 | 0.69 | −0.31 | −2.10 | 0.04 |
B: unstandardized regression coefficient; SEB: standard error of the coefficient; β: standardized coefficient.
The agreement with preoperative values was evaluated for variables correlated with AUCs (Table 4). No significant differences were found between variables measured preoperatively and postoperatively, except for the chord µ that was significantly reduced after surgery (Fig. 3A). Preoperative mean µ was 0.25 mm at 28° (SDx = 0.18 mm, SDy = 0.19 mm) and postoperative mean µ was 0.11 mm at 11° (SDx = 0.14 mm, SDy = 0.11 mm). A linear regression analysis established that post-µx can be predicted (F = 29.76, p < 0.0001, R2 = .48, adj. R2 = .47) by means of pre-µx. The regression equation was post-µx = 0.51* preμx-0.002. On the other hand, the linear regression analysis for post-µy considering pre-µywas not significant (F = 1.50, p = 0.23, R2 = .0.05, adj. R2 = .0.02). Therefore, a mean difference of 0.09 mm can be used to predict postoperative µy (Table 4). The mean IOL centration (d) was 0.19 mm at 173° (SDx = 0.21 mm, SDy = 0.20 mm) (Fig. 3B).
Parameters variations after surgery.
| Variable | Preoperative mean ± SD | Postoperative mean ± SD | t | p | m.d. | LoAs |
|---|---|---|---|---|---|---|
| Km (D) | 43.69 ± 2.29 | 43.66 ± 2.27 | −0.65 | 0.52 | 0.04 | 0.66 |
| IA (µm) | 0.14 ± 0.07 | 0.15 ± 0.06 | −1.33 | 0.19 | −0.01 | 0.12 |
| SA (µm) | 0.35 ± 0.13 | 0.35 ± 0.12 | −0.27 | 0.79 | 0.00 | 0.12 |
| µx (mm) | 0.22 ± 0.18 | 0.11 ± 0.14 | 4.82 | <0.0001* | 0.11 | 0.26 |
| µy (mm) | 0.12 ± 0.11 | 0.02 ± 0.11 | 4.23 | <0.0001* | 0.09 | 0.44 |
Km: mean corneal power; IA: irregular astigmatism; SA: spherical aberration; µx: µ in horizontal cartesian coordinates; µy: µ in vertical cartesian coordinates.
SD: standard deviation.
t: paired t-test.
m.d.: mean differences.
LoAs: limits of agreement.
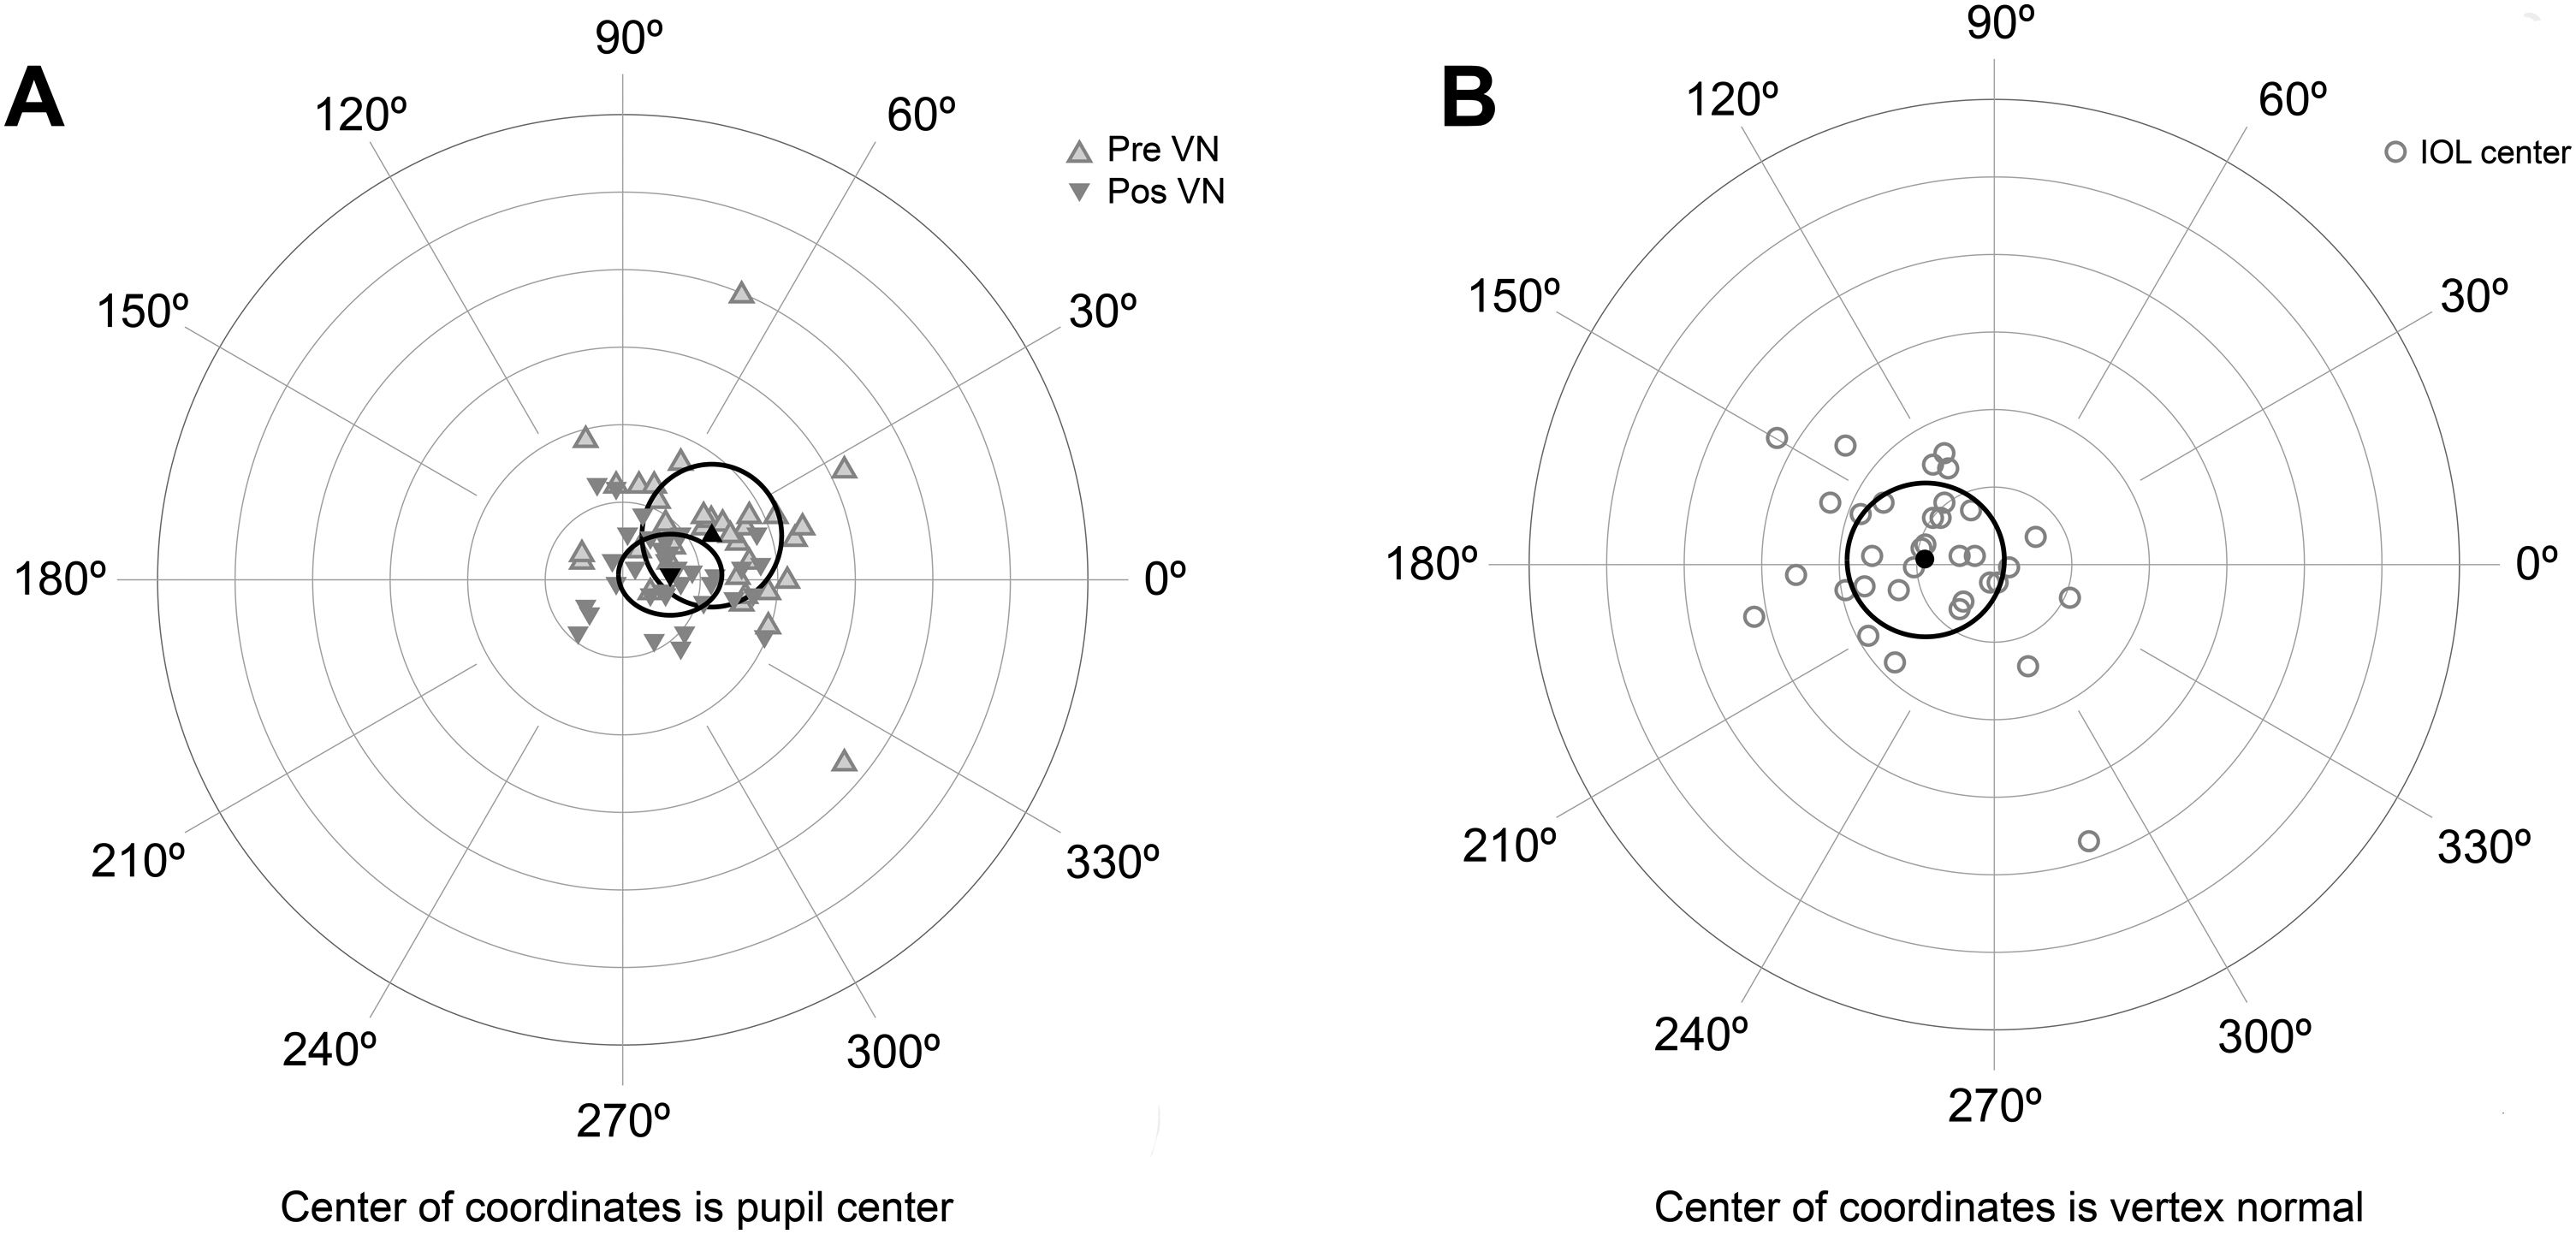
A) Location of the vertex normal from to the pupil center for preoperative and postoperative measures. Black triangles describe the mean and the ellipse around the triangles the standard deviation. B) Location of the intraocular lens (IOL) center to the vertex normal. Black circle describes the mean and the ellipse around the circle the standard deviation. Each ring on the plot describes a 0.2 mm step. Locations are nasal for 0°, superior for 90°, temporal for 180° and inferior for 270°.
In this study, we have evaluated the influence of biometric parameters in the performance achieved with a trifocal intraocular lens of low addition. The analysis of TAUC after splitting the sample in two groups with the posterior evaluation of differences for the included biometric parameters showed that Km was the most important parameter for predicting the TAUC. Subjects with lower Km resulted in higher TAUC; conversely, AXL and SA were higher in the group with greater TAUC, but it is important to note that AXL and SA were also correlated with Km and can be considered as confounding variables. In fact, Llorente et al.26 reported that SA is greater in hyperopes than in myopes and it is well known that Km decreases with myopia increase and conversely for the AXL.27 The most remarkable result of our data is that the group with greater TAUC showed significant higher AUC at all distances, but only Km was significantly correlated at far and near distance, whereas AXL and SA were not correlated with NAUC. For this reason, we consider Km as the most important factor for predicting the TAUC, whereas the SA should not be considered as a factor for predicting TAUC, but should be considered as a confounding variable. It is important also to note for SA interpretation that we used the total corneal SA for correlation and not the total ocular SA. Furthermore, an important limitation of the study was to use the value at 6 mm for SA offered by the Cataract Preoperative Modulus of Pentaca. This value does not represent the effective SA during the measurement of the visual performance that should be recalculated for the exact pupil size that the patient have during the VADC measurement.28
Furthermore, the age was not significantly different between groups and was not correlated with AUCs as might be expected,29,30 mainly due to the fact that 95% of subjects were within 56 and 61 years old.
RA was not correlated with AUCs at any range of distances. Considering that subjects had a postoperative RA lower than 1.3 D in all cases, our results are on agreement with Hayashi et al.9,10 who reported that eyes with a multifocal intraocular lens achieved good visual acuity at both distance and near when astigmatism is within 1.0 D. With regard to IA, Maeda11 described that 0.3 µm can be considered as the cut-off value for MIOLs. All the eyes included in our study had an IA lower than 0.3 µm but interestingly we found a negative correlation between IA and NAUC which means that despite of having less than 0.3 µm of IA, subjects with lower IA would have higher NAUC. The IA, unlike SA, was not correlated with the Km therefore both variables were included in a multiple regression analysis model which explained the 34% of variability in the NAUC. The model was also calculated considering the EA instead Km, but the R2 was not improved as it would be expected since EA was computed considering not only Km but also an approximation of ALP to ELP. Some authors have described the importance of the ELP in the EA,13–15 however according to our results and considering that the 95% of the eyes had an ELP in the range of 4.25 mm and 4.49 mm, the variations in the EA were mainly explained by Km and this was one possible reason for not considering EA instead of Km as it did not improve the model.
The model also included the IOL centration; higher d, which means less centration, was related with greater NAUC. The 95% of the eyes were between 0.23 mm and 0.36 mm from the vertex normal, which is a value below than 0.4 mm, the cut-off value reported for which MIOLs are associated to a deterioration of the MTF.31 Furthermore, diffractive MIOLs have shown a decrease of the near MTF as the decentration increase.32 However, as we evaluated the NAUC instead of a particular point at near, the improvement of NAUC can be explained by an increase of the depth of focus due to high order aberrations induction with decentration. Another possible explanation might be that the light is focused closer to the fovea for the near foci for this location of the IOL which is the natural position of the crystalline lens.33 This fact should be analyzed in future studies by means of ray-tracing simulations in model eyes.
The kappa angle or better named µ-chord,18,34 has been also related to the performance with the MIOL.5,6 In our study, µ-chord did not have relationship with the AUCs probably due to the small value which decreased significantly after surgery and probably due the location of the IOL that has a higher role on the potential deterioration of the visual performance. The IOL was generally centered temporal to the pupil. These results are in agreement with those described in the literature and they are due to the location of the pupil center relative to the capsular bag.35 Decentration higher than 0.3 mm has been hypothesized to induce a poorer corrected distance visual acuity than might be improved with Argon Laser Iridoplasty.36 However, we found that higher decentration was correlated with higher NAUC. Therefore, visual function should be evaluated in a wide range of distances in order to take decisions about realignment of the IOL.
As the decentration was not correlated with other ranges of the VADC, it can be stated that visual acuity at far or intermediate vision was not affected by the decentration. It might be concluded that a slight decentration of the lenses can be recommendable in order to achieve better visual acuity at near with a low addition trifocal lens. This finding is in agreement with a previous study with a high addition trifocal intraocular lens, but the increase of performance was presented at the intermediate vision.21 Therefore, this slight decentration appears to favor the foci with lower energy, either near in a low addition trifocal lens and intermediate in a high addition trifocal lens. However, these results should be interpreted with caution as it is well known that visual acuity is not a good descriptor of visual quality. Indeed, the fact that the visual acuity is not affected at far distance with a slightly decentered IOL does not mean that the optical quality in terms of other metrics such as contrast sensitivity is not reduced.37 This should be studied in the future including metrics based on contrast sensitivity.
In conclusion, we analyzed the impact of several biometric eye parameters over the area under the defocus curves. The corneal power was the most important factor for predicting the visual acuity along the total curve, this finding is in agreement with a previous study with other high addition trifocal lens.21 The spherical aberration can show a false relationship with the variation of visual acuity because eyes with lower corneal power have also greater spherical aberration, which means that spherical aberration acts as a confounding variable. Likewise, irregular astigmatism should be considered for the prediction of the near vision with the trifocal IOL evaluated, even for values lower than 0.3 µm, because lower irregular astigmatism is related to better near vision. We also reported that near vision improves with the IOL decentration, considering that lenses were commonly centered slightly temporal to the vertex normal, and this location may be preferable for obtaining better near visual acuity results. Finally, it is important to note that our results were obtained with a particular trifocal low addition IOL and with a sample with specific biometric eye parameters and the results might not be extrapolated to other MIOLs or to sample of eyes with different biometric parameters. Similar future studies should be performed including other lenses, eyes with different biometric characteristics and metrics that better describe visual quality that visual acuity.
Conflicts of interestMR-V has designed and programmed the Multifocal Lens Analyzer test used in the current study which is distributed by the Apple Store as well as the Refractive Analysis Toolbox for Matlab. The other authors report no conflicts of interest and have no proprietary interest in any of the materials mentioned in this article.
None.


