


To record electroretinograms (ERGs) from intrinsically photosensitive retinal ganglion cells (ipRGCs) of glaucoma patients.
MethodsERGs were recorded in 10 normal subjects and 15 patients with glaucoma. The ERG illumination system was built to achieve receptor-silent substitution, and comprised an optical diffuser and four-in-one light-emitting diodes.
ResultsThe ERG recordings of ipRGC from normal subjects showed an “on” response and an “off” response. The mean (±SD) implicit time for the on and off responses in normal subjects was 103.0±24.9 and 337.9±45.8ms, respectively, with corresponding amplitudes of 7.7±2.8 and 7.3±3.4μV, respectively. In glaucoma patients, the implicit time of the on and off responses was 135.0±28.9 and 368.2±17.3ms, respectively. The corresponding amplitudes of the on and off responses in these patients were 0.47±0.18 and 0.66±0.32μV, respectively.
ConclusionsThe results demonstrate successful ERG recording of ipRGCs from advanced glaucoma patients, with marked reductions in amplitude, although not implicit time, compared with normal subjects.
Registrar los electrorretinogramas (ERG) de las células ganglionares de la retina, intrínsecamente fotosensibles (ipRGCs) de los pacientes con glaucoma.
MétodosSe registraron los ERG de diez sujetos normales, y de quince pacientes con glaucoma. El sistema de iluminación del ERG se preparó para lograr la sustitución de los receptores silentes, incluyendo un difusor óptico y un sistema de cuatro-en-uno diodos emisores de luz.
ResultadosLos registros ERG de las ipRGC en los sujetos normales reflejaron una respuesta “on” y una respuesta “off”. El tiempo implícito medio (± DE) para las respuestas “on” y “off” en los sujetos normales fue de 103,0±24,9 y 337,9±45,8ms, respectivamente, con amplitudes correspondientes de 7,7±2,8 y 7,3±3,4μV, respectivamente. En los pacientes con glaucoma, el tiempo implícito de las respuestas “on” y “off” fue de 135,0±28,9 y 368,2±17,3ms, respectivamente. Las amplitudes correspondientes de las respuestas “on” y “off” en dichos pacientes fueron de 0,47±0,18 y 0,66 ±0,32μV, respectivamente.
ConclusionesLos resultados demuestran unos registros exitosos de ERG de los ipRGCs en pacientes con glaucoma avanzado, con unas reducciones marcadas en cuanto a amplitud, aunque no en lo referente a tiempo implícito, en comparación a los sujetos normales.
Intrinsically photosensitive retinal ganglion cells (ipRGCs) are a recently described subset of photoreceptor cells in the retina.1 Assuming a total of 1.2 million retinal ganglion cells (RGCs) in the human retina, only a small subset of RGCs (∼0.8%) contain melanopsin and are intrinsically photosensitive.2,3 The ipRGCs generate and discharge an action potential in response to light exposure, with or without synaptic input from other photoreceptors.2–7 Therefore, ipRGCs transmit information from the rods and cones, as well as information obtained because of its intrinsic photosensitivity. The ipRGCs are known to support various accessory visual functions and modulate systemic homeostasis and circadian rhythm via photoreception to blue light.2,8–12
Damage to RGCs and visual field loss are fundamental pathologies of glaucoma,13–15 and there is some evidence that ipRGCs may be damaged in glaucoma, resulting in potential systemic disorders related to ipRGC dysfunction.16 Despite extensive animal experiments and pupillary studies of glaucoma patients,12,16–18 strong evidence regarding the status of human ipRGC activity is still lacking. The anatomy and physiology of human ipRGCs remain understudied, and the extent to which ipRGCs are damaged in glaucomatous eyes remains unknown. Glaucoma patients exhibit specific declines in the pupillary reflex to blue light corresponding to the thickness of the retinal nerve fiber layer (NFL) and visual field loss. These glaucoma-specific clinical parameters have been evaluated recently in a sleep study with regard to the systemic role of ipRGCs.16,19 However, the presence of circadian rhythm disorders has only been demonstrated in an animal model of glaucoma.20
The electroretinogram (ERG) is an established electrophysiological technique to evaluate the activity of individual retinal components and structures, and we have provided data on the direct electrical responses of ipRGCs in previous studies.21,22 Because the ipRGC population is very small and its response reflects the neural activities of other photoreceptors, rods, and cones, it is difficult to record and identify the components of the electrical response derived from ipRGCs. Taking these difficulties into consideration, we used the silent-substitution technique23–28 in the present study, which enabled us to control stimulus levels to the ipRGC and cones based on calculations of the spectral power distribution and α-opic sensitivity curve.29 Using this technique, we recorded ERGs from normal subjects and patients with advanced glaucoma, and analyzed the waveforms to identify any specific changes in the ERG recorded for ipRGC from glaucoma patients.
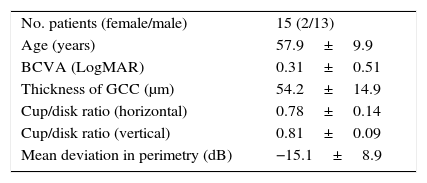
MethodsParticipants and ethical issuesThe present study was approved by the Institutional Review Board and Ethics Committee of Mie University School of Medicine, and followed the tenets of the Declaration of Helsinki, in that informed consent was obtained from subjects after the nature and possible consequences of the study had been explained. Ten normal subjects and 15 patients with glaucoma were enrolled in the present study. Participants were recruited via an advertisement in a research center and eye clinic. The inclusion criteria for normal subjects were normal vision and good general health based on the results of a workplace health check. Normal vision was confirmed by a board certified ophthalmologist for all participants before they were enrolled in the study. Diagnostic criteria for glaucoma included mean deviation of perimetry less than −6.0dB with typical glaucomatous changes and a large cup/disk ratio >0.6. The demographics and clinical data for glaucoma patients are shown in Table 2.
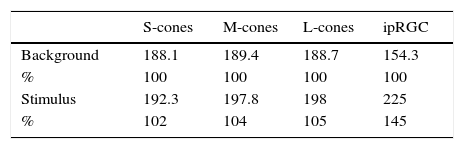
Stimuli and stimulation proceduresThe ERG illumination system was custom built (Fukuoka Women's University, Fukuoka, Japan) to achieve receptor-silent substitution, as described in detail elsewhere.21–28 Briefly, this system consisted of an optical diffuser, a light-emitting diode (LED) projector and its controller, and a personal computer to acquire responses. The red, green, blue, and white LEDs had peak wavelengths of 635, 525, 460, and 445/555nm, respectively, and were used to build the projector. Stimulus levels to the photoreceptors were calculated from the spectral power distribution of the light and α-opic sensitivity curves of short (S), middle (M), and long (L) wavelength-sensitive cones and the ipRGC.29 The rod stimulus was not calculated because the background stimulus (white, 1000 lux) was provided and considered as reaching photopic vision (at the level of rods are saturated). The luminance output of each LED was controlled by the controller. The light emitted by the LED projector was integrated as a circular light stimulus on the diffuser, which was 200mm from a subject. As described previously,2 the population density of ipRGCs increases from the peripheral retina to the fovea, peaking in an area 2mm distant from the fovea. We followed the procedure of Dacey and Petersen30 and set a test field of 26.5 visual angles to sufficiently encompass the peak ipRGC distribution (Fig. 1).
 responses from intrinsically photosensitive retinal ganglion cells (ipRGCs). The ERG illumination system was built to achieve receptor-silent substitution and was comprised of an optical diffuser and four-in-one light-emitting diodes (LEDs). A test field of 26.5 visual angles was set to sufficiently encompass the peak ipRGC distribution. The red, green, and blue LEDs had peak wavelengths of 635, 525, and 460nm, respectively, with corresponding half-height bandwidths of 15, 40, and 20nm. The white LED peak wavelengths were 445 and 555nm. The luminance output of each LED was controlled by the controller. PC, personal computer; amp, amplifier; PWM, pulse width modulation.")
Diagram illustrating the custom built set-up used in the present study. Experimental set-up for recording electroretinogram (ERG) responses from intrinsically photosensitive retinal ganglion cells (ipRGCs). The ERG illumination system was built to achieve receptor-silent substitution and was comprised of an optical diffuser and four-in-one light-emitting diodes (LEDs). A test field of 26.5 visual angles was set to sufficiently encompass the peak ipRGC distribution. The red, green, and blue LEDs had peak wavelengths of 635, 525, and 460nm, respectively, with corresponding half-height bandwidths of 15, 40, and 20nm. The white LED peak wavelengths were 445 and 555nm. The luminance output of each LED was controlled by the controller. PC, personal computer; amp, amplifier; PWM, pulse width modulation.
The stimulus intensity for ipRGCs only was increased by 40% from the background stimulus, whereas that for the cones was not changed. The stimulus duration was set at 250ms because a brief light flash may induce complex combined responses to the onset and offset of a light stimulus.31 In addition, because of the weak response of ipRGCs, averaged ERG responses were evaluated from data obtained from 30 consecutive responses rather than a single response. A spectroradiometer (CS-1000A; Konica Minolta Inc., Tokyo, Japan) was used to assess the light stimuli from the light generator to ensure the contrasts were within theoretical values (Table 1).
Demographics and clinical data for glaucoma patients.
| No. patients (female/male) | 15 (2/13) |
| Age (years) | 57.9±9.9 |
| BCVA (LogMAR) | 0.31±0.51 |
| Thickness of GCC (μm) | 54.2±14.9 |
| Cup/disk ratio (horizontal) | 0.78±0.14 |
| Cup/disk ratio (vertical) | 0.81±0.09 |
| Mean deviation in perimetry (dB) | −15.1±8.9 |
Data are the mean±SD.
BCVA, best-corrected visual acuity; LogMAR, logarithm of the minimum angle of resolution scale; GCC, ganglion cell complex.
Prior to ERG recordings, mydriatic ophthalmic solution (0.5% tropicamide and 0.5% phenylephrine chloride) was applied to the eye to be tested to ensure maximum dilation of the pupil. Corneal ERG responses were recorded with a BA-02 electrode (Mayo Corp., Inazawa, Japan). The reference and ground skin electrodes were attached to the forehead and earlobe, respectively. Following the 10-min period of light adaptation (white, 1000 lux), the 250-ms stimulus was presented every 4.0s, with 30 consecutive responses recorded per session. Data were collected and analyzed using the MP150 data-acquisition system (Biopac Systems Inc., Goleta, CA, USA).
Optical coherent tomography and perimetryAll glaucoma patients underwent complete ophthalmological evaluation, including optical coherent tomography (OCT; Cirrus® HD-OCT; Carl Zeiss Meditec Inc., Dublin, CA, USA) to measure the thickness of the RGC layer and standard automated perimetry (G-pattern white-on-white perimetry; Octopus®900 perimeter; Haag-Streit AG, Koeniz, Switzerland) to identify any changes in visual field function.
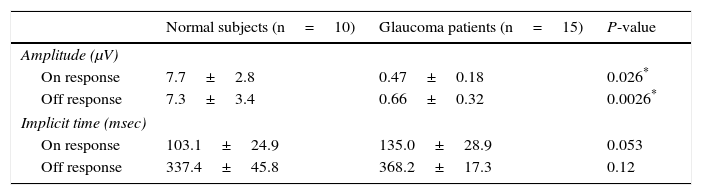
ResultsThe study included 10 eyes from 10 healthy volunteers (mean [±SD] age 40.6±11.9 years; four women) and 15 eyes from 15 patients with glaucoma (mean [±SD] age 57.9±9.9 years; two women). Patient demographics and clinical data are given in Table 1. Representative ERG responses for a normal subject and a glaucoma patient are shown in Fig. 2. In normal subjects, ERG recordings from ipRGCs showed an “on” response shortly after initiation of the stimulus and an “off” response after termination of the stimulus, which exhibited a similar waveform tendency as reported by us previously for the ipRGC response21 (Table 1). The ipRGC response showed markedly diminished amplitude in glaucoma patients. According to the on and off responses observed in normal subjects, we defined the first positive deflection after stimulus onset as the on response and the first positive deflection after the end of the stimulus as the off response, regardless of apparent amplitude, in order to evaluate the responses obtained quantitatively (Fig. 2). The standard ERG for glaucoma patients showed normal-shaped waveforms with normal a and b waves in scotopic and photopic responses and normal waveforms in flicker responses (Fig. 3). For the ipRGC responses, the mean (±SD) implicit time for the on and off responses in normal subjects was 103.1±24.9 and 337.9±45.8ms, respectively, with corresponding amplitudes of 7.7±2.8 and 7.3±3.4μV, respectively. In the glaucoma patients, the implicit time for the on and off responses was 135.0±28.9 and 368.2±17.3ms, respectively, with corresponding amplitudes of 0.47±0.18 and 0.66±0.32μV, respectively (Table 3). The amplitudes were significantly lower in glaucoma patients than in normal subjects (P<0.03, unpaired t-test), but there was no significant difference between the two groups in implicit time (Fig. 4).
 and a glaucoma patient (61-year-old male). The arrow indicates stimulus onset. After the 250-msec stimulus, on (▾) and off (▽) responses were identified. The glaucoma patient had bilateral pseudophakia, best-corrected visual acuity in the tested eye (OD) was 20/25 with mild hyperopia (+0.5 diopter), and the intraocular pressure was 14mmHg. The thickness of the retinal ganglion cell complex layer was 60μm and mean deviation examined by perimetry was −21.1dB. The disk/cup ratio was 0.82. Neither on nor off responses were observable on the waveform recorded from the glaucoma patient.")
Electroretinogram responses from a normal subject (54-year-old male) and a glaucoma patient (61-year-old male). The arrow indicates stimulus onset. After the 250-msec stimulus, on (▾) and off (▽) responses were identified. The glaucoma patient had bilateral pseudophakia, best-corrected visual acuity in the tested eye (OD) was 20/25 with mild hyperopia (+0.5 diopter), and the intraocular pressure was 14mmHg. The thickness of the retinal ganglion cell complex layer was 60μm and mean deviation examined by perimetry was −21.1dB. The disk/cup ratio was 0.82. Neither on nor off responses were observable on the waveform recorded from the glaucoma patient.
 recording obtained from a glaucoma patient showing, from top to bottom, the rod response, maximal response, cone response, and light-adapted 30-Hz flicker response. The arrow indicates stimulus onset. Normal-shaped waveforms and ordinary components were observed.")
Responses from a conventional electroretinogram (ERG) recording obtained from a glaucoma patient showing, from top to bottom, the rod response, maximal response, cone response, and light-adapted 30-Hz flicker response. The arrow indicates stimulus onset. Normal-shaped waveforms and ordinary components were observed.
Amplitude and implicit time for normal subjects and glaucoma patients.
| Normal subjects (n=10) | Glaucoma patients (n=15) | P-value | |
|---|---|---|---|
| Amplitude (μV) | |||
| On response | 7.7±2.8 | 0.47±0.18 | 0.026* |
| Off response | 7.3±3.4 | 0.66±0.32 | 0.0026* |
| Implicit time (msec) | |||
| On response | 103.1±24.9 | 135.0±28.9 | 0.053 |
| Off response | 337.4±45.8 | 368.2±17.3 | 0.12 |
Data are the mean±SD.
 Amplitude and (b) implicit times obtained from normal subjects and glaucoma patients. There were significant differences between normal subjects and glaucoma patients in the amplitude of the on and off responses (*P<0.03, unpaired t-test), but not for implicit times of the on and off responses. Data are the mean±SD.")
(a) Amplitude and (b) implicit times obtained from normal subjects and glaucoma patients. There were significant differences between normal subjects and glaucoma patients in the amplitude of the on and off responses (*P<0.03, unpaired t-test), but not for implicit times of the on and off responses. Data are the mean±SD.
Establishing how to evaluate the function of ipRGC and what impact ipRGCs has on visual function is technically challenging. Historically, the starting point for assigning functions to ipRGCs has been eliminating rod and cone photoreception using genetic or pharmacological approaches.32,33 However, such preparations are ill suited to revealing ipRGC influences on conventional vision. Comparing visual responses of wild-type and melanopsin knockout mice could be more informative, but interpreting such data is complicated by evidence that retinal development and retinal circadian rhythms are disrupted in animals lacking melanopsin.34–37
Here, we therefore set out to explore ipRGC influences on visual responses in animals with an intact retina. Our approach adopts the ideas of metamerism and receptor silent substitution from the field of human psychophysics. To the best of our knowledge, the present study is the first to have obtained ERG recordings from ipRGCs under both normal and pathological conditions. We used light stimuli that increased only ipRGC stimulation by using the silent-substitution method. Therefore, on and off responses in normal subjects should have arisen not all but dominantly from the ipRGCs. The marked reduction in electrical responses observed in glaucoma patients indicates specific damage of the ipRGCs in glaucoma.
Non-image-forming processing centers in the brain receive brightness information from ipRGCs, as well as from rods and cones.7,12,38 It remains unknown how signals from the classic photoreceptors and ipRGCs are summed and contribute to non-image-forming pathways. The distribution of ipRGCs across the entire retina is very sparse39 and the responses of ipRGCs to light are much more sluggish than those of rods and cones.1 It is very hard to clearly identify the ipRGC component of ERG recorded using conventional techniques because these sorts of ERGs record the neural activities of all photoreceptors. Usui et al. addressed this issue and used chromatic flicker stimulation to isolate M and L cones by modifying the silent-substitution technique.25,26 We used the same technique in the present study to record ERGs from patients with glaucoma for the first time.
There is ongoing discussion as to which class of RGCs is damaged in glaucoma. For example, it has been suggested that RGCs with larger soma are preferentially affected in glaucomatous optic neuropathy.14–16 Other studies in rodents suggest that the death of both ipRGCs and RGCs is topological and not related to cell size or class.17,40,41 Li et al.42 reported that rodent ipRGCs, which generally have large cell bodies with extensive dendritic arbors, are preferentially spared in glaucoma. Kankipati et al.20 found that age had no effect on changes in the net post-illumination pupil response (PIPR), which selectively reflects ipRGC function. The loss of the PIPR in glaucoma is correlated with mean deviation.18 We believe the results of the present study may represent dysfunction of RGCs at the very least because the ERGs were obtained in advanced glaucoma patients with severe visual field loss and a decreased thickness of the RGC layer. Simultaneously, the findings indicate decreased activity of the ipRGCs because the light stimuli changed only ipRGC stimulation.
The present study does have some limitations. The characteristics of ERG from ipRGC need to be further clarified under a variety of pathological conditions and in a large number of normal subjects and clinical cases. The electrophysiological responses of ipRGCs are very small, and further technical advances are necessary for clear and reproducible waveforms to be recorded using simple techniques and apparatus. The stimulus is very bright and need to record the responses repeatedly in the current system, therefore only a few subjects could tolerate the examination, thus resulting in a small number of subjects. Nevertheless, we were able to show distinct differences in electrical responses from ipRGCs between subjects with advanced glaucoma and normal subjects, and this was another reason why advanced glaucoma patients were recruited to the present study. A large difference in the amplitude of the ERG was found between the two groups, and the sample size was sufficient to detect statistical significance.
ConclusionsThe present study demonstrated a marked reduction in ERG responses of ipRGCs from patients with glaucoma. Although electrophysiological activity in human ipRGCs requires more detailed investigation, the results of the present study suggest that ERGs may be a promising methodology for use in a variety of pathological conditions in which ipRGC disorders are possible.
Conflicts of interestThe authors have no conflicts of interest to declare.
The authors are grateful of Dr. Sei-ichi Tsujimura for valuable suggestions. The authors acknowledge the assistance of Inter-Biotech (http://www.inter-biotech.com) with the English language editing of this manuscript.


