


To examine the diagnostic capability of the full retinal and inner retinal thickness measures in differentiating individuals with diabetic peripheral neuropathy (DPN) from those without neuropathy and non-diabetic controls.
MethodsIndividuals with (n=44) and without (n=107) diabetic neuropathy and non-diabetic control (n=42) participants underwent spectral domain optical coherence tomography (SDOCT). Retinal thickness in the central 1mm zone (including the fovea), parafovea and perifovea was assessed in addition to ganglion cell complex (GCC) global loss volume (GCC GLV) and focal loss volume (GCC FLV), and retinal nerve fiber layer (RNFL) thickness. Diabetic neuropathy was defined using a modified neuropathy disability score (NDS) recorded on a 0–10 scale, wherein, NDS ≥3 indicated neuropathy and NDS indicated <3 no neuropathy. Diagnostic performance was assessed by areas under the receiver operating characteristic curves (AUCs), 95 per cent confidence intervals (CI), sensitivities at fixed specificities, positive likelihood ratio (+LR), negative likelihood ratio (−LR) and the cut-off points for the best AUCs obtained.
ResultsThe AUC for GCC FLV was 0.732 (95% CI: 0.624–0.840, p<0.001) with a sensitivity of 53% and specificity of 80% for differentiating DPN from controls. Evaluation of the LRs showed that GCC FLV was associated with only small effects on the post-test probability of the disease. The cut-off point calculated using the Youden index was 0.48% (67% sensitivity and 73% specificity) for GCC FLV. For distinguishing those with neuropathy from those without neuropathy, the AUCs of retinal parameters ranged from 0.508 for the central zone to 0.690 for the inferior RNFL thickness. For distinguishing those with moderate or advanced neuropathy from those with mild or no neuropathy, the inferior RNFL thickness demonstrated the highest AUC of 0.820, (95% CI: 0.731–0.909, p<0.001) with a sensitivity of 69% and 80% specificity. The cut-off-point for the inferior RNFL thickness was 97μm, with 81% sensitivity and 72% specificity.
ConclusionsThe GCC FLV can differentiate individuals with diabetic neuropathy from healthy controls, while the inferior RNFL thickness is able to differentiate those with greater degrees of neuropathy from those with mild or no neuropathy, both with an acceptable level of accuracy. Optical coherence tomography represents a non-invasive technology that aids in detection of retinal structural changes in patients with established diabetic neuropathy. Further refinement of the technique and the analytical approaches may be required to identify patients with minimal neuropathy.
Examinar la capacidad diagnóstica de las mediciones del grosor total e interno de la retina, con diferenciación entre individuos con neuropatía periférica diabética (DPN), aquellos que no la padecen, y controles no diabéticos.
MétodosCuarenta y cuatro individuos con (n=44) y sin (n=107) neuropatía diabética y participantes de control no diabéticos (n=42) fueron sometidos a una tomografía de coherencia óptica de dominio espectral (SDOCT). Se evaluó el grosor de la retina en la zona central de 1mm (incluyendo la fóvea), parafóvea y perifóvea, además del complejo de células ganglionares (GCC), el volumen de pérdida global (GCC GLV) y el volumen de pérdida focal (GCC FLV), y el espesor de la capa de fibras nerviosas de la retina (RNFL). Se definió la neuropatía diabética utilizando la versión modificada del “Neuropathy Disability Score (NDS)”, sobre una escala de 0 a 10, donde el valor de NDS ≥3 indicaba neuropatía y NDS <3 ausencia de la misma. El desempeño diagnóstico se evaluó mediante las áreas bajo las curvas características operativas del receptor (AUC), intervalos de confianza del 95% (IC), sensibilidades a especificidades fijas, cociente de probabilidad positiva (CP+), y cociente de probabilidad negativa (CP−) y los puntos de corte para los mejores AUC obtenidos.
ResultadosEl AUC para GCC FLV fue de 0,732, 95% IC: 0,624–0,840, p<0,001 con una sensibilidad del 53% y una especificidad del 80% para la diferenciación entre DPN y los controles. La evaluación de los CP reflejó que el GCC FLV se asociaba únicamente a unos pequeños efectos en la prueba posterior de probabilidad de la enfermedad. El punto de corte calculado utilizando el índice de Youden fue del 0,48% (67% de sensibilidad y 73% de especificidad) para GCC FLV. Para distinguir a aquellos individuos con neuropatía de los que no la padecían, las AUC de los parámetros retinianos oscilaron entre 0,508 para el grosor RNFL de la zona central y 0,690 para el de la zona inferior. Para distinguir a aquellas personas con neuropatía moderada o avanzada, de aquellas con neuropatía leve, o ausencia de ella, el grosor RNFL de la zona inferior reflejó una AUC superior de 0,820, 95% IC: 0,731–0,909, p<0,001, con una sensibilidad del 69% y una especificidad del 80%. El punto de corte para el grosor RNFL inferior fue de 97μm, con un 81% de sensibilidad y un 72% de especificidad.
ConclusionesEl GCC FLV puede diferenciar entre aquellos individuos con neuropatía diabética y los controles sanos, mientras que el grosor RNFL de la zona inferior es capaz de diferenciar entre aquellas personas con grados superiores de neuropatía y aquellas con neuropatía leve o ausencia de neuropatía, en ambos casos con un nivel aceptable de precisión. La tomografía de coherencia óptica supone una tecnología no invasiva que ayuda a la detección de los cambios estructurales retinianos en pacientes con neuropatía diabética establecida. Se precisa un mayor refinamiento de esta técnica, así como enfoques analíticos, para identificar a aquellos pacientes con una neuropatía mínima.
Peripheral neuropathy is a devastating complication affecting ∼50% of individuals with diabetes.1 Neuropathy affecting the sensory nerves in the feet and lower limbs can lead to foot ulceration and eventually amputation.2 Although symptoms and signs and neurophysiology are advocated in the diagnosis of diabetic neuropathy, they have limited reproducibility and wide variability. Procedures such as skin and nerve biopsy are more reproducible and detect sub-clinical neuropathy, but are invasive and require expensive laboratory equipment and trained personnel.3 Hence there is a need for a painless or non-invasive, reproducible, cost-effective and clinically accessible means for early detection, diagnosis, staging severity, and monitoring progression of diabetic peripheral neuropathy (DPN). Several studies4–10 have previously demonstrated considerable diagnostic potential of OCT and corneal confocal microscopy (CCM) for imaging and monitoring vascular and neural changes in relation to diabetes. Using spectral domain optical coherence tomography (SDOCT), we have previously reported that the full retinal8 and inner retinal thickness8–10 is significantly reduced in individuals with neuropathy, especially in those who are at increased risk of foot ulceration.10 This finding was independent of diabetic retinopathy (DR). OCT aids in the non-contact evaluation of retinal layers in vivo at a near-microscopic resolution to provide information regarding the specific layer of interest. Over the years, OCT has become an indispensable technology for clinicians in the assessment of ocular diseases and ocular manifestations of systemic diseases and has revolutionized the way in which ophthalmologists, optometrists and other eye care practitioners can assess various retinal and vitreoretinal diseases.
Given that OCT can detect diabetes-related compromise in multiple layers of the retina, we sought to assess the diagnostic potential of the OCT-derived retinal parameters in differentiating individuals with diabetes with neuropathy from those without neuropathy and non-diabetic individuals.
We assessed the diagnostic capability of the SDOCT-derived retinal parameters in identifying individuals with diabetic peripheral neuropathy (DPN).
MethodsThe study received ethics clearance from the institutional Human Research Ethics Committees of the host University and the collaborative hospitals, and was conducted according to the Tenets of Declaration of Helsinki as revised in 2008. One-hundred and fifty one people with diabetes (84 with type 1 and 67 with type 2 diabetes) and 42 people without diabetes or neuropathy were enrolled as healthy controls. Participants provided written informed consent prior to involvement.
Inclusion and exclusion criteriaParticipants underwent visual acuity assessment (Bailey-Lovie logMAR chart, Multimedia Centre, School of Optometry, University of California, Berkeley, CA, USA) assessed at 20ft, slit lamp biomicroscopy (Haag-Streit, Bern, Switzerland), intra ocular pressure measurement (ICare®, Tiolat, Oy, Helsinki, Finland) and three-field fundus photography (Visucam Pro, Carl Zeiss Meditec Inc., Dublin, CA, USA). Three consecutive readings of intra ocular pressure measurements were obtained and averaged. Dilated fundus photography was performed using Tropicamide ophthalmic solution 1% (Alcon Laboratories, Inc., Fort Worth, Texas for Sandoz Inc. Princeton, NJ, USA). Individuals who were 40 years or older with best-corrected visual acuity of 20/30 or better, refractive error within ±6.00D sphere or astigmatism within ±3.00D cylinder were included. Individuals with cataract that prevented a satisfactory view of the posterior segment with retinal imaging techniques, any history of retinal photocoagulation, diagnosis or reasonable suspicion of glaucoma from optic nerve head appearance, any history of intra-ocular pressure above 22mmHg, and any neurological condition that might affect retinal nerve fibers (e.g. Parkinson's disease11 or multiple sclerosis12) were excluded. Fundus photographs were examined by an ophthalmologist who was masked to the details of the participant to rule out retinal pathologies other than those due to diabetes, and the presence or absence of DR was noted.
For the control group, in addition to the above criteria, participants were excluded if they had diabetes, a positive anti-glutamic acid decarboxylase (anti-GAD) antibody or a neuropathy due to any other cause. Glutamic acid decarboxylase (GAD) is a protein identified in the beta cells of the pancreas. A positive result for anti-GAD or GAD antibodies suggests marker that is more commonly associated with type 1 diabetes.
Peripheral neuropathy may also be associated with other etiologies such as autoimmune diseases like rheumatoid arthritis,13 infectious diseases such as Hansen's disease,14 acquired immune deficiency syndrome,15 certain toxic substances like alcohol,16 vitamin deficiency,17 and chronic exposure to radiation, trauma, and tumors exerting pressure on the spinal cord.18 Therefore, individuals with a history of neuropathy due to non-diabetic causes were excluded from the study.
All participants underwent HbA1c testing on the day of the ophthalmic exam. The HbA1c is also known as glycosylated or glycated hemoglobin. HbA1c is a component of hemoglobin A1c (HbA1c) to which the glucose is bound. HbA1c levels are reflective of glycemic control over the previous six to eight weeks and are not affected by daily fluctuations in blood glucose levels. The American Diabetes Association now recommends using HbA1c for the diagnosis of diabetes.
In addition, individuals identifying as ‘without diabetes’ underwent fasting plasma glucose testing and were included only if the fasting glucose level was in the normal range. Anyone with abnormal fasting plasma glucose underwent an oral glucose tolerance test; all individuals in the control group had fasting glucose in the normal range. The eye on the side of the dominant hand was tested unless contraindicated by the above exclusion criteria, in which case, the eye on the non-dominant side was tested. Dominant hand was by self-report.
Neuropathy assessmentIndividuals underwent neuropathy evaluation and were classified as with or without neuropathy according to a modified neuropathy disability score (NDS) which involved neurological examination of vibration perception, sharp/blunt sensation, temperature sensation using a Neurotip® device (Owen Mumford Ltd., Oxford, UK), and ankle reflexes. A score of 0 is given for a normal response and 1 for an abnormal response for each individual test component. The ankle reflex was assessed using a reflex hammer with the scores being 0 for normal, 1 for reinforcement and 2 for absent. Each foot can have a maximum score of 5 resulting in a total score of 10 for both feet. An NDS ≥3 is indicative of neuropathy, with higher scores indicating more severe disease.19
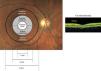
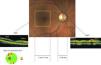
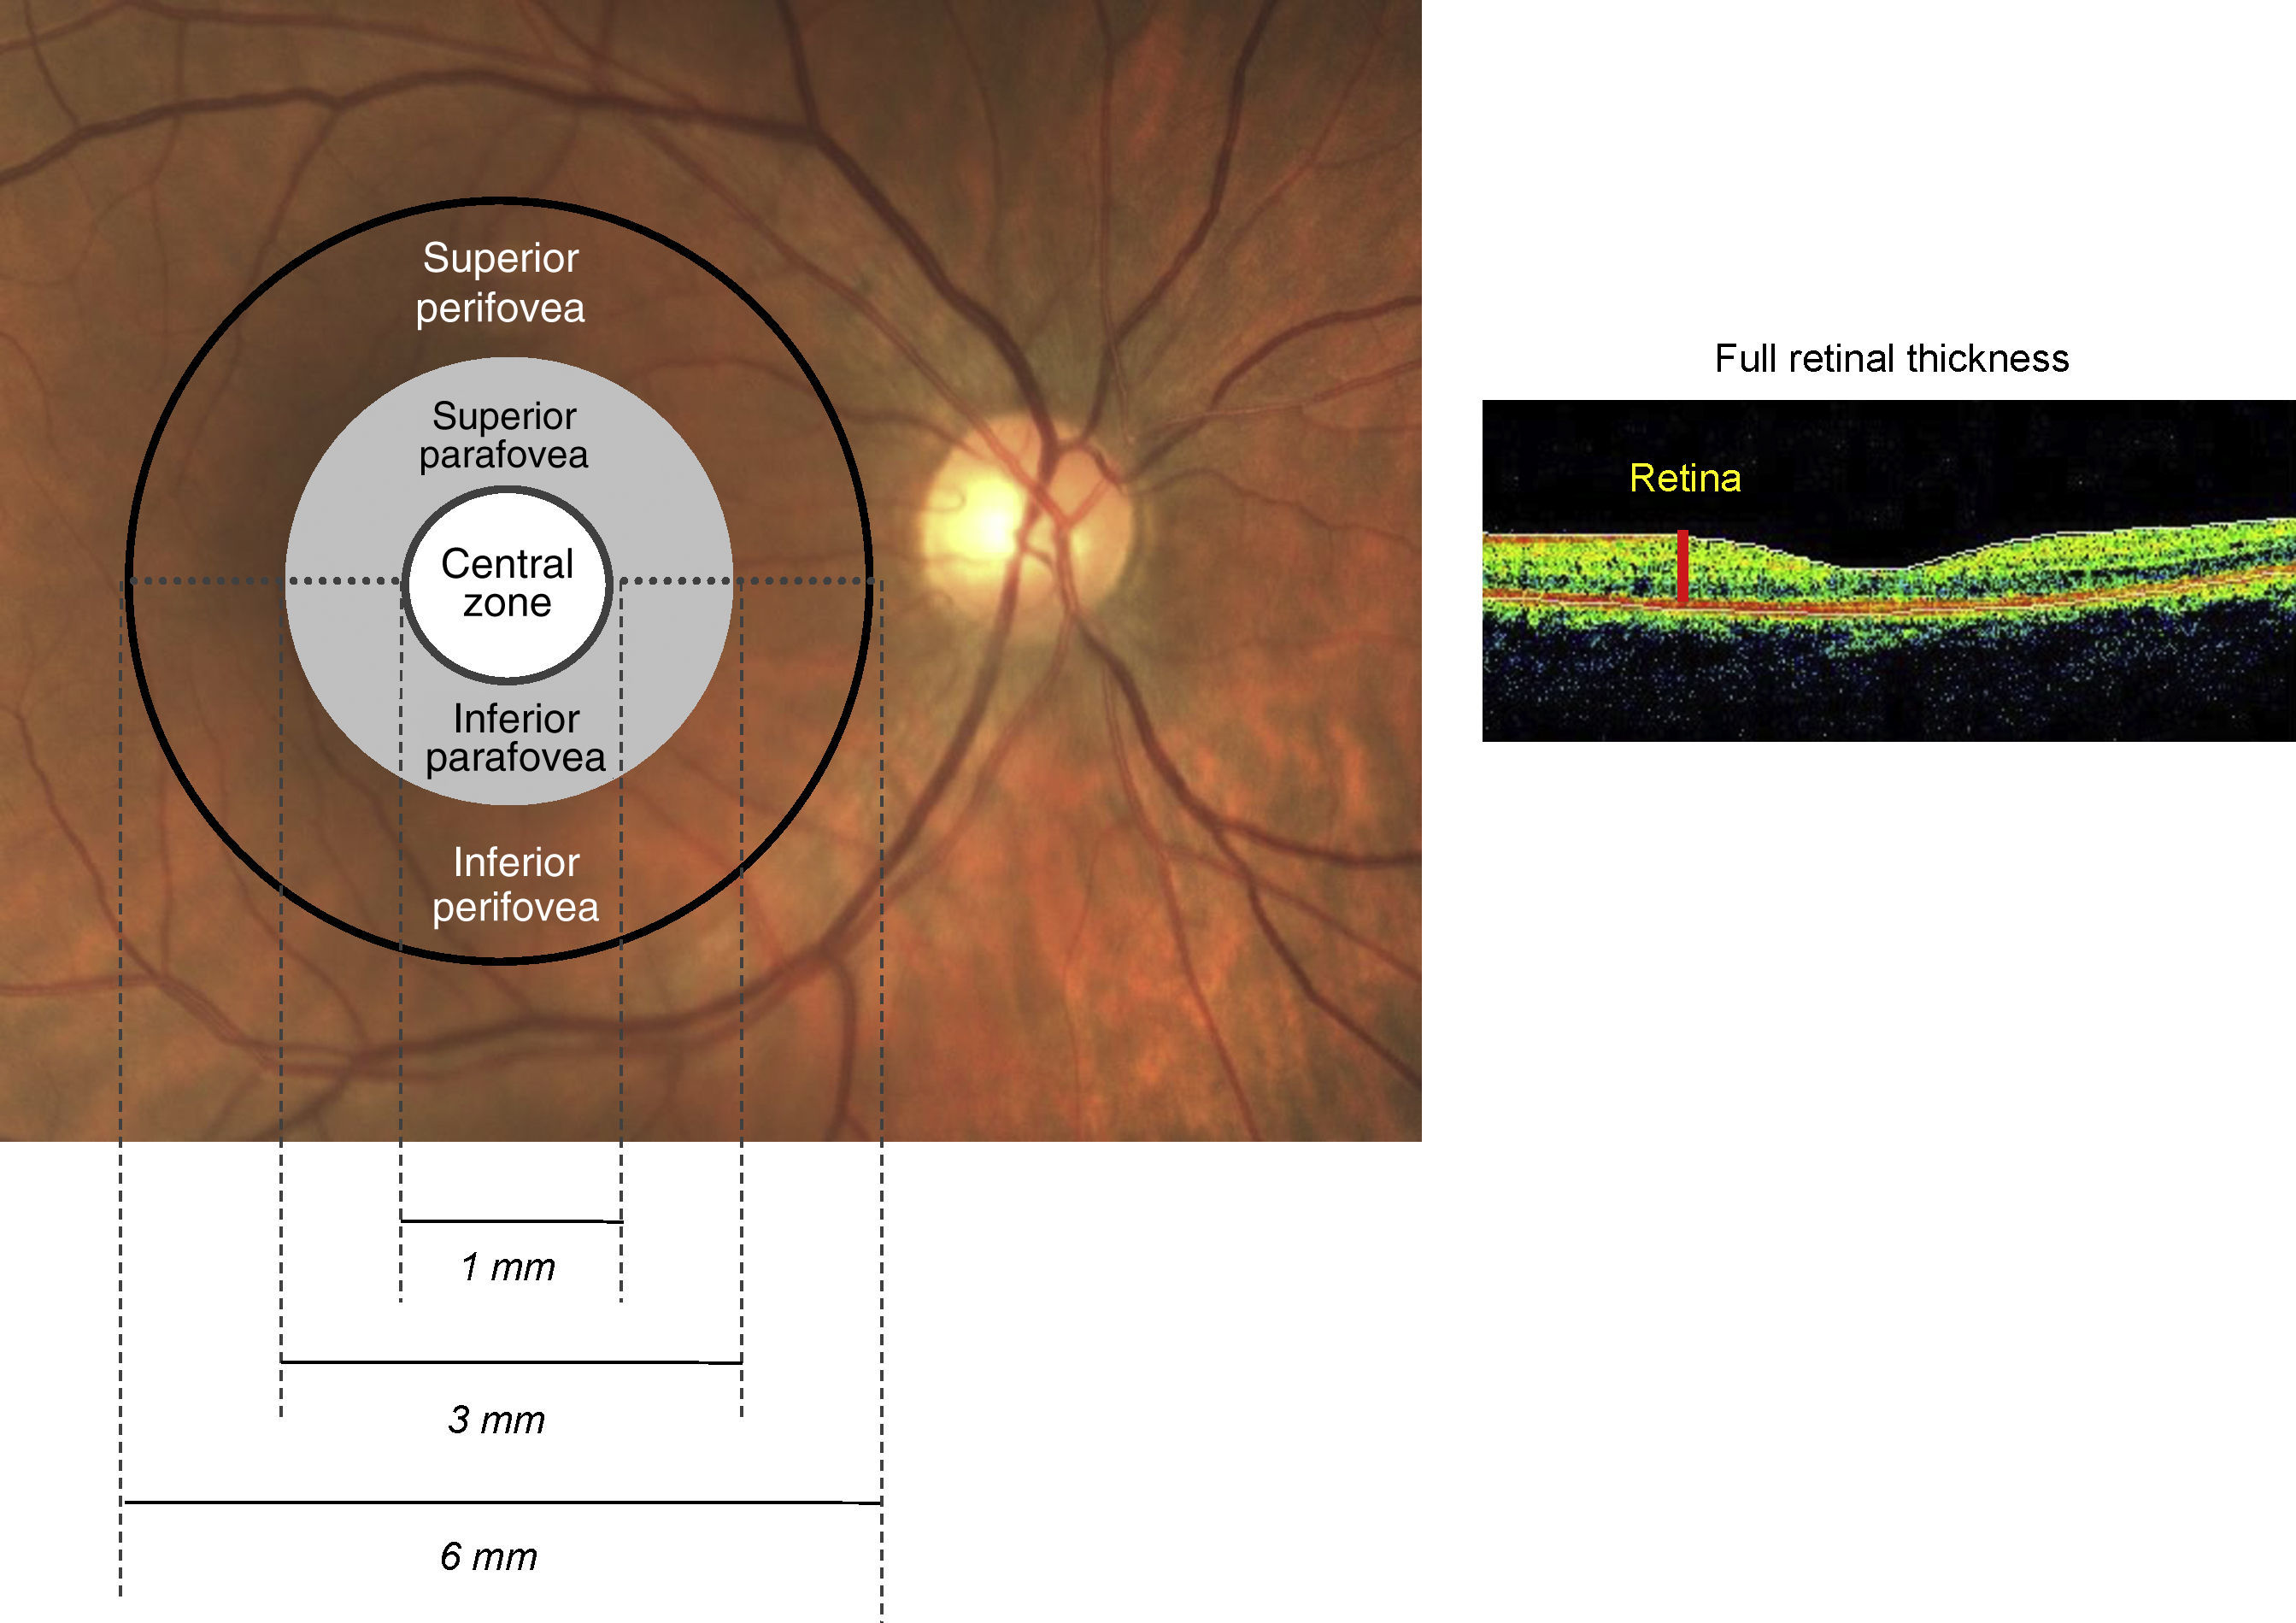
Optical coherence tomographyOptical coherence tomography (RTVue SDOCT, Model RT-100, ver.4.0, Fremont, CA, USA) was used to examine full retinal and inner retinal thickness. OCT described in this work employs a wavelength of 820±10nm from a super-luminescent diode. The beam is split into a reference arm that is sent to a mirror and the other that is sent to the ocular tissue. The reflected beam from the ocular tissue and that from the mirror create an interference pattern, which is split by a grating into different wavelength components. Fourier transformation is then applied to give A-scans. The software acquires 26,000A-scans per second with an axial resolution of 5μm (adapted from RTVue User Manual ver.4.0). Full retinal thickness is measured along 12 radial lines, each 6mm long, centered at the fovea and averaged at three regions. The outermost region is the perifoveal zone defined by the area between an inner circle with a diameter of 3mm and an outer circle with a diameter of 6mm. The middle parafoveal zone is similarly defined by an inner circle (1mm diameter) and an outer circle (3mm diameter). The innermost zone is contained within the circle of diameter 1mm and includes the fovea. Fig. 1 is a schematic of the retinal zone assessed for full retinal thickness. Retinal nerve fiber layer thickness (RNFL) is measured between the inner plexiform layer and inner limiting membrane boundaries, along a circle of 3.45mm diameter centered at the optic nerve head. Ganglion cell complex (GCC) is a composite of the inner plexiform layer, ganglion cell layer and nerve fiber layer; it is interpolated from measurements along 15 vertical lines and one horizontal line, covering a zone of 7mm×7mm that is centered 1mm temporal to the fovea. Fig. 2 is a schematic of the retinal zones assessed for the inner retinal thickness.

Two pattern-based GCC parameters namely, focal loss volume (GCC FLV) and global volume (GCC GLV) were assessed. The GCC GLV reflects the average amount of GCC loss over the entire GCC map and is analogous in concept to the mean deviation (MD) of the visual fields. The GCC FLV detects focal loss after correcting for the overall sinking or the general depression of the topography of the GCC thickness map and is analogous to pattern standard deviation (PSD) measurement in visual fields.20
The overall, superior hemisphere and inferior hemisphere thicknesses of the parafovea, perifovea, RNFL and GCC, as well as central undivided zone thickness, GCC FLV and GCC GLV were each considered for analysis.
Statistical analysisData were analyzed using the Statistical Packages for the Social Sciences (SPSS version 17.0). Participant characteristics were assessed in the three groups after examining for the normality of distribution. Full retinal and inner retinal thickness were normally distributed and hence were compared between groups using ANOVA; a Tukey's test was performed as a post hoc test for those variables that were significant with the ANOVA test. The FLV and GLV were not normally distributed; therefore, group differences were assessed using Kruskal–Wallis test followed by a Mann–Whitney U test for a post hoc analysis. The diagnostic performance was assessed by areas under the receiver operating characteristic curves (AUCs) and 95 per cent confidence interval (CI), sensitivities at 80% and 95% specificity levels. Positive and negative likelihood ratios (LR) and the diagnostic threshold (determined by the Youden index) were calculated for the best AUCs observed.
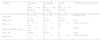
ResultsParticipant characteristicsTable 1 provides a summary of the participant characteristics. Individuals with DPN were significantly older than those without DPN and had a longer duration of diabetes than those without DPN (p<0.001). The proportion of males was similar in the groups with and without DPN (χ2(1,151)=2.505, p=0.114). The HbA1c levels did not differ significantly between diabetic patients with and without DPN, but both groups had significantly higher HbA1c levels compared to controls (p<0.001). The NDS was 4.5 units greater in the DPN group on average compared to the group without DPN (p<0.001). The proportion of people with DR was significantly higher among those with DPN (61%) compared to those without DPN (34%). A Chi-square test of independence demonstrated a significant relationship between DPN and the presence of retinopathy (χ2(1,151)=9.852, p=0.002).
Clinical characteristics of participants in the groups with and without diabetic neuropathy and control subjects.
| Variables | Neuropathy (A) Mean±SD Min–Max n=44 | No neuropathy (B) Mean±SD Min–Max n=107 | Controls (C) Mean±SD Min–Max n=42 | ANOVA P (sig. diff. in post hoc) |
|---|---|---|---|---|
| Age (years) | 59±8 | 55±9 | 55±9 | 0.021 (A vs. B) |
| 41–71 | 40–77 | 40–73 | ||
| Males, n (%) | 30 (68%) | 58 (54%) | 20 (44%) | 0.114 |
| HbA1c (%) | 8.0±1.3 | 7.7±1.3 | 5.4±0.3 | <0.001 (A, B vs. C) |
| 6–13 | 5–12 | 5–6 | ||
| Duration of diabetes (years) | 22±15 | 16±12 | n/a | <0.001 |
| 6–64 | 1–53 | |||
| DR, n (%) | 27 (61%) | 36 (34%) | n/a | 0.002 |
| NDS (0–10) | 5.1±2.1 | 0.6±0.7 | 0.3±0.6 | <0.001 (A vs. B, C) |
| 3–10 | 0–2 | 0–2 |
DR, diabetic retinopathy; NDS, neuropathy disability score.
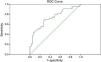
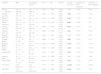
Table 2 provides a summary of the diagnostic performance for retinal variables comparing individuals with DPN to non-diabetic controls. The AUC for GCC FLV (0.732, 95% CI: 0.624–0.840, p<0.001, with 54% sensitivity at 80% specificity) demonstrated fair diagnostic capacity (Fig. 3). The AUCs for other retinal variables namely central zone (p=0.055), inferior perifovea (p=0.060) and inferior GCC (p=0.061) did not differ from the line of no discrimination.
Diagnostic accuracy of SDOCT parameters in differentiating diabetic patients with neuropathy (DPN) and non-diabetic controls.
| Variable | DPN | Non-diabetic controls | AUC±SE | 95% CI | p-Value for AUC | Sensitivity at 80% specificity | Sensitivity at 95% specificity |
|---|---|---|---|---|---|---|---|
| Central 1mm zone | 246±19 207–286 | 254±26 180–313 | 0.622±0.062 | 0.500–0.743 | 0.055 | 41.9% | 0.0% |
| Overall parafovea | 304±14 271–330 | 314±14 277–341 | 0.696±0.057 | 0.584–0.808 | 0.002 | 51.2% | 11.6% |
| Superior parafovea | 307±14 274–332 | 318±14 285–341 | 0.708±0.056 | 0.598–0.819 | 0.001 | 51.2% | 2.0% |
| Inferior parafovea | 302±14 262–328 | 311±14 269–342 | 0.674±0.058 | 0.559–0.788 | 0.006 | 46.5% | 14% |
| Overall perifovea | 264±13 233–289 | 272±13 236–301 | 0.656±0.059 | 0.540–0.773 | 0.014 | 44.2% | 9.3% |
| Superior perifovea | 270±15 234–297 | 278±13 242–306 | 0.660±0.059 | 0.544–0.777 | 0.011 | 44.2% | 30.2% |
| Inferior perifovea | 258±15 207–285 | 265±16 222–312 | 0.619±0.061 | 0.499–0.740 | 0.060 | 39.5% | 9.3% |
| Overall RNFL | 97±9 71–120 | 102±11 74–132 | 0.669±0.058 | 0.555–0.783 | 0.007 | 43.2% | 9.1% |
| Superior RNFL | 98±10 75–119 | 102±13 66–135 | 0.636±0.060 | 0.518–0.753 | 0.030 | 27.3% | 11.4% |
| Inferior RNFL | 97±9 75–119 | 102±12 82–136 | 0.669±0.058 | 0.556–0.783 | 0.007 | 21.4% | 13.6% |
| Overall GCC | 93±7 77–112 | 96±7 76–108 | 0.638±0.061 | 0.519–0.757 | 0.029 | 34.9% | 14.0% |
| Superior GCC | 93±7 75–112 | 95±8 70–110 | 0.619±0.062 | 0.497–0.741 | 0.061 | 32.6% | 7.0% |
| Inferior GCC | 93±8 71–112 | 97±6 81–108 | 0.653±0.060 | 0.536–0.770 | 0.016 | 37.2% | 27.9% |
| GCC FLV | 0.97a 0.00–6.18 | 0.24 0.00–3.87 | 0.732±0.055 | 0.624–0.840 | <0.001 | 53.5% | 20.9% |
| GCC GLV | 5.38a 0.02–21.48 | 2.44 0.02–14.19 | 0.648±0.060 | 0.529–0.767 | 0.020 | 30.2% | 14% |
Data represent mean±SD, range; Data are represented in μm except GCC FLV and GCC GLV which are represented in percentage (%); CI, confidence interval; SE, standard error; AUC, areas under the receiver operating characteristic curves; DPN, diabetic peripheral neuropathy; RNFL, retinal nerve fiber layer; GCC, ganglion cell complex; FLV, focal loss volume; GLV, global loss volume; significant p-values in bold.
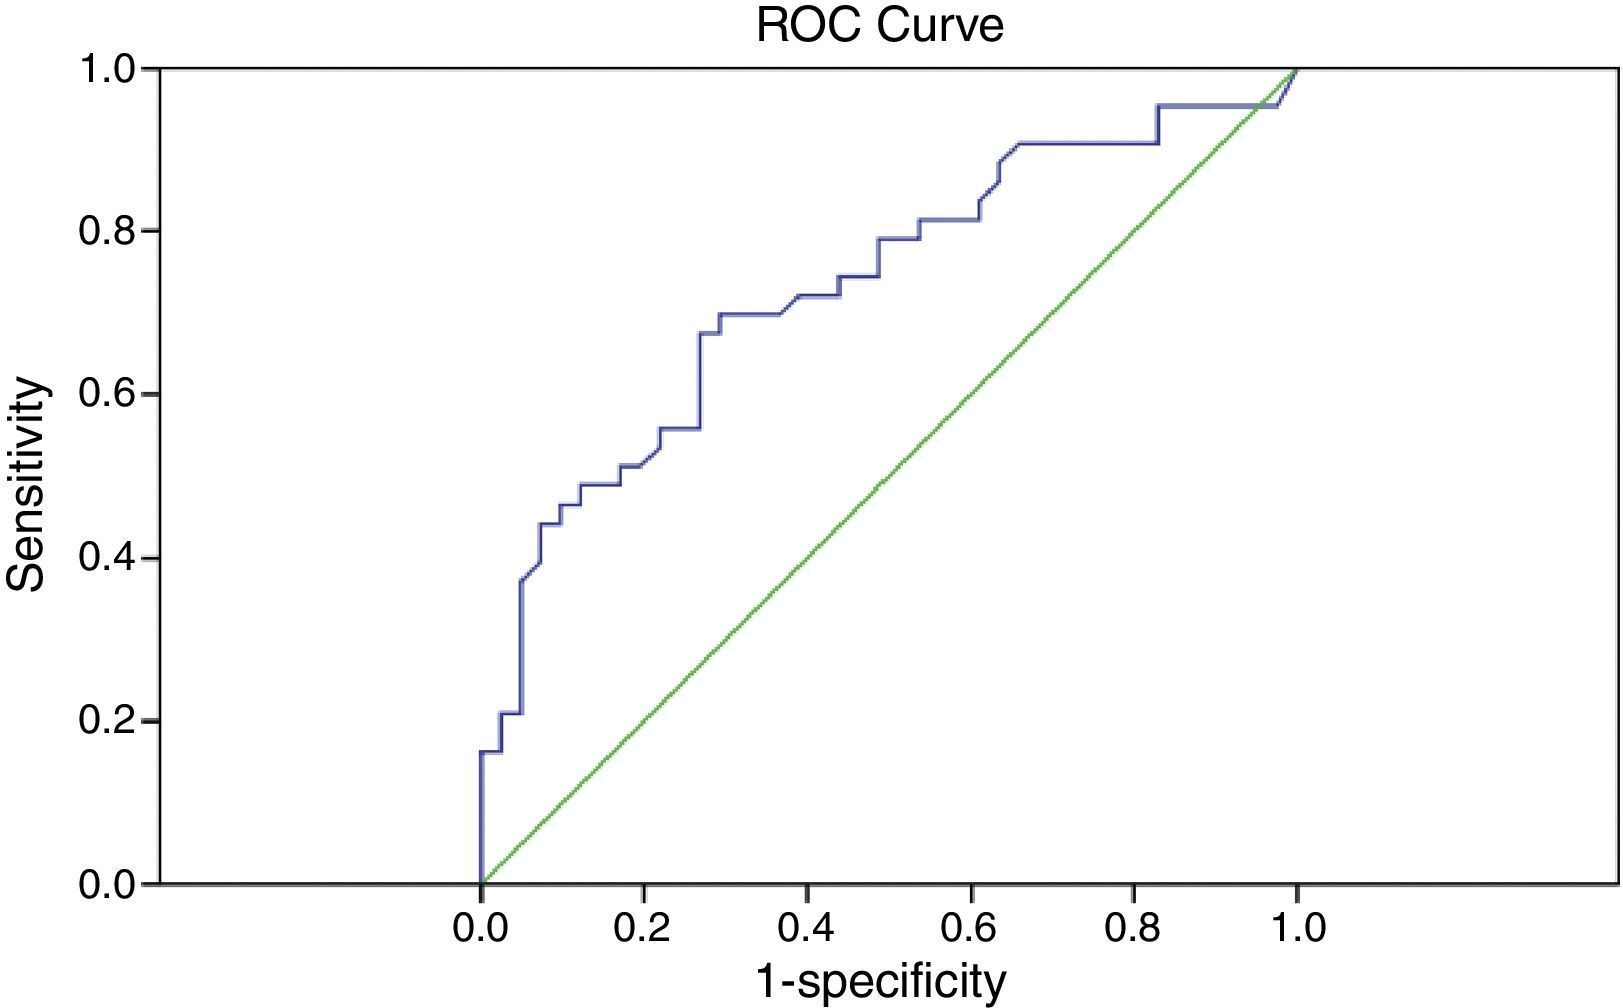
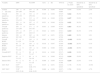
Table 3 provides a summary of the diagnostic performance for retinal variables comparing individuals with and without DPN. The AUCs ranged from 0.508 for the central retinal zone to 0.690, for the inferior hemisphere RNFL thickness. The retinal parameters demonstrated poor accuracy for differentiating diabetic patients with and without DPN. The AUCs for central retinal zone (p=0.876), GCC FLV (p=0.736) and GCC GLV (p=0.706) did not differ significantly from that due to chance. For DPN+ versus controls, the GCC FLV revealed fair diagnostic accuracy relative to the other comparisons.
Diagnostic accuracy of SDOCT parameters in differentiating diabetic patients with neuropathy (DPN) and diabetic patients without neuropathy (No DPN).
| Variable | DPN | No DPN | AUC±SE | 95% CI | p-Value for AUC | Sensitivity at 80% specificity | Sensitivity at 95% specificity |
|---|---|---|---|---|---|---|---|
| Central 1mm zone | 246±19 207–286 | 245±26 140–293 | 0.508±0.050 | 0.410–0.606 | 0.876 | 11.6% | 2.3% |
| Overall parafovea | 304±14 271–330 | 310±17 259–342 | 0.620±0.048 | 0.525–0.715 | 0.022 | 30.2% | 2.3% |
| Superior parafovea | 307±14 274–332 | 313±17 254–349 | 0.616±0.049 | 0.520–0.712 | 0.027 | 32.6% | 1.7% |
| Inferior parafovea | 302±14 262–328 | 307±17 246–343 | 0.621±0.048 | 0.526–0.715 | 0.021 | 30.2% | 2.3% |
| Overall perifovea | 264±13 233–289 | 271±15 201–301 | 0.653±0.049 | 0.557–0.749 | 0.003 | 44.2% | 4.7% |
| Superior perifovea | 270±15 234–297 | 277±15 228–313 | 0.622±0.052 | 0.521–0.723 | 0.019 | 44.2% | 4.7% |
| Inferior perifovea | 258±15 207–285 | 265±16 170–302 | 0.637±0.051 | 0.538–0.736 | 0.009 | 39.5% | 14% |
| Overall RNFL | 97±9 71–120 | 104±11 75–136 | 0.682±0.045 | 0.593–0.770 | <0.001 | 43.0% | 6.8% |
| Superior RNFL | 98±10 75–119 | 104±12 76–136 | 0.638±0.047 | 0.546–0.729 | <0.001 | 29.5% | 9.1% |
| Inferior RNFL | 97±9 75–119 | 105±12 74–137 | 0.690±0.046 | 0.601–0.779 | <0.001 | 40.9% | 6.8% |
| Overall GCC | 93±7 77–112 | 96±8 71–117 | 0.614±0.049 | 0.517–0.710 | 0.030 | 34.9% | 4.7% |
| Superior GCC | 93±7 75–112 | 96±8 70–118 | 0.611±0.049 | 0.515–0.707 | 0.034 | 32.6% | 4.7% |
| Inferior GCC | 93±8 71–112 | 97±8 73–118 | 0.608±0.050 | 0.510–0.706 | 0.039 | 32.6% | 4.7% |
| GCC FLV | 0.97a 0.00–6.18 | 0.41 0.00–5.78 | 0.635±0.051 | 0.010–0.535 | 0.736 | 37.2% | 25.6% |
| GCC GLV | 5.38a 0.02–21.48 | 3.36 0.00–24.20 | 0.609±0.050 | 0.037–0.512 | 0.706 | 32.6% | 4.7% |
Data represent mean±SD and range; Data are represented in μm except GCC FLV and GCC GLV which are represented in percentage (%); CI, confidence interval; SE, standard error; AUC, areas under the receiver operating characteristic curves; DPN, diabetic peripheral neuropathy; RNFL, retinal nerve fiber layer; GCC, ganglion cell complex; FLV, focal loss volume; GLV, global loss volume; significant p-values in bold.
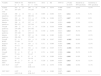
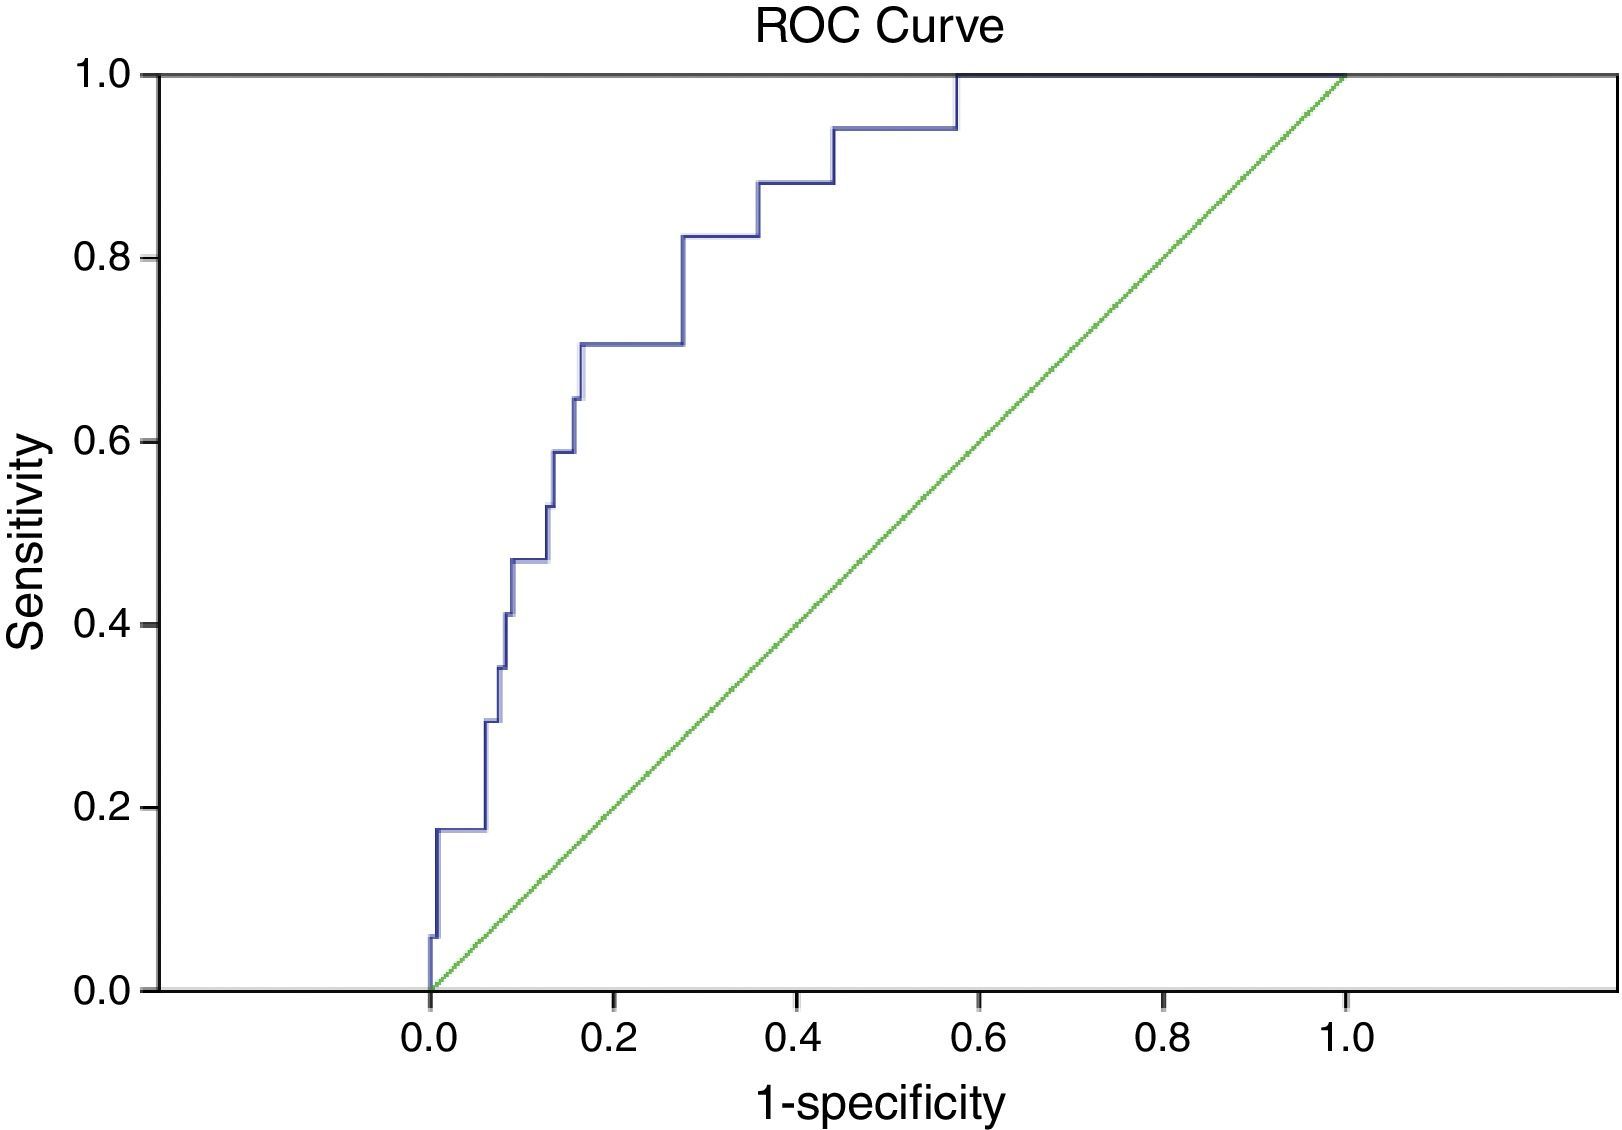
Table 4 provides a summary of the diagnostic performance for retinal variables comparing individuals with mild/no DPN and versus moderate/advanced DPN. The AUC was the maximum for inferior hemisphere RNFL thickness, 0.820 (95% CI: 0.731–0.909, p<0.001) with a sensitivity of 69% and 80% specificity (Fig. 4). The thickness in the central zone (p=0.547) and inferior perifovea (p=0.057) did not differ significantly from the line of no discrimination.
Diagnostic accuracy of SDOCT parameters in differentiating diabetic patients with no or mild neuropathy versus moderate or advanced DPN.
| Variable | NDS (6–10) (n=16) | NDS (0–5) (n=134) | AUC±SE | 95% CI | p-Value for AUC | Sensitivity at 80% specificity | Sensitivity at 95% specificity |
|---|---|---|---|---|---|---|---|
| Central 1mm zone | 243±23 207–284 | 246±25 141–293 | 0.546±0.074 | 0.400–0.692 | 0.547 | 25.0% | 12.5% |
| Overall parafovea | 300±14 271–325 | 310±16 260–342 | 0.695±0.064 | 0.57–0.821 | 0.011 | 31.3% | 6.3% |
| Superior parafovea | 302±14 280–328 | 313±17 255–350 | 0.706±0.066 | 0.577–0.835 | 0.007 | 43.8% | 0.0% |
| Inferior parafovea | 298±15 263–322 | 307±17 247–344 | 0.678±0.064 | 0.551–0.804 | 0.020 | 37.5% | 12.5% |
| Overall perifovea | 260±13 234–280 | 271±15 201–302 | 0.720±0.058 | 0.606–0.834 | 0.004 | 43.8% | 12.5% |
| Superior perifovea | 266±11 253–288 | 277±16 229–313 | 0.729±0.059 | 0.613–0.844 | 0.003 | 56.3% | 0.0% |
| Inferior perifovea | 255±20 208–286 | 265±16 171–303 | 0.646±0.080 | 0.489–0.803 | 0.057 | 50.0% | 12.5% |
| Overall RNFL | 92±8 72–106 | 104±11 75–137 | 0.788±0.047 | 0.695–0.881 | <0.001 | 68.8% | 12.5% |
| Superior RNFL | 95±10 75–111 | 104±12 77–137 | 0.711±0.060 | 0.593–0.829 | 0.006 | 43.8% | 12.5% |
| Inferior RNFL | 90±10 68–106 | 104±12 74–137 | 0.820±0.045 | 0.731–0.909 | <0.001 | 68.8% | 12.5% |
| Overall GCC | 91±6 77–101 | 97±8 72–117 | 0.711±0.062 | 0.589–0.832 | 0.006 | 56.3% | 6.3% |
| Superior GCC | 91±6 75–101 | 97±8 70–119 | 0.702±0.060 | 0.584–0.820 | 0.008 | 43.8% | 6.3% |
| Inferior GCC | 90±7 79–105 | 97±9 71–119 | 0.729±0.064 | 0.603–0.854 | 0.003 | 56.3% | 12.5% |
| GCC FLV | 2.23a 0.04–5.57 | 1.04 0.00–6.18 | 0.703±0.070 | 0.566 –0.841 | 0.008 | 43.8% | 31.3% |
| GCC GLV | 8.36a 0.65–21.48 | 4.74 0.00–24.2 | 0.746±0.060 | 0.627–0.864 | 0.001 | 56.3% | 6.3% |
Data represent mean±SD and range; Data are represented in μm except GCC FLV and GCC GLV which are represented in percentage (%); CI, confidence interval; SE, standard error; AUC, areas under the receiver operating characteristic curves; NDS, neuropathy disability score; RNFL, retinal nerve fiber layer; GCC, ganglion cell complex; FLV, focal loss volume; GLV, global loss volume; significant p-values in bold.
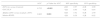
The positive (+LR) and negative (−LR) likelihood ratios were examined only for GCC FLV and for inferior RNFL thickness for their respective group comparisons (Table 5). Both were associated with only small effects on the post-test probability of disease.
Diagnostic capacity GCC FLV and inferior hemisphere RNFL thickness.
| AUC | p-Value for AUC | 80% specificity | 95% specificity | |||
|---|---|---|---|---|---|---|
| DPN (±) versus Controls: GCC FLV | 0.732 | <0.001 | +LR | 2.67 | +LR | 4.00 |
| −LR | 0.50 | −LR | 0.84 | |||
| Mild/no DPN versus mod/adv. DPN: Inferior RNFL | 0.802 | 0.001 | +LR | 3.42 | +LR | 2.40 |
| −LR | 0.39 | −LR | 0.92 | |||
GCC FLV is represented in %; RNFL is represented in μm; AUC, areas under the receiver operating characteristic curves; Mod/adv, moderate or advanced; DPN, diabetic peripheral neuropathy; +LR, positive likelihood ratio; −LR, negative likelihood ratio; GCC FLV, focal loss in ganglion cell complex volume.
In addition, the cut-off point calculated using the Youden index for GCC FLV was 0.48% with 67% sensitivity and 73% specificity and for inferior hemisphere RNFL thickness was 97μm, with 81% sensitivity and 72% specificity.
DiscussionThis study sought to examine if retinal thickness measures assessed by SDOCT can differentiate individuals with DPN from those without DPN and non-diabetic participants. The main findings of the study was that (i) OCT demonstrates fair diagnostic capacity in diagnosing or differentiating those with DPN from non-diabetic participants and also in differentiating moderate or advanced stage of DPN from mild or no DPN. (ii) OCT-derived parameters have limited diagnostic capacity in detecting individuals with DPN (or ruling-in the disease) but show some promise in ruling-out the disease (high specificity).
Peripheral neuropathy is a major complication of diabetes and currently there is a limited availability of diagnostic facilities for early detection.1,2 Novel ophthalmic techniques such as corneal confocal microscopy and non-contact corneal aesthesiometry show promise in this regard. These techniques have been utilized in the identification of patients with minimal and more advanced diabetic DPN, and can grade the severity of DPN.4–6 More recently they have been proven to be comparable to intraepidermal nerve fiber density – the current gold standard for diagnosing patients with early DPN.6 Recently, Pritchard et al.7 demonstrated that corneal confocal microscopy (CCM) can predict 4-year incident neuropathy with an AUC of 0.66 at a cut-off value of 14.1mm/mm2 for corneal nerve fiber length. In the present study, the assessment of retinal parameters using OCT shows limited utility as a non-invasive ophthalmic marker for ruling-in DPN but has better diagnostic capability to rule-out DPN. Further study with more detailed quantification taking into account retinal and systemic confounding factors is required to fully understand the utility of quantifying retinal neuronal pathology using OCT in diabetic neuropathy.
The objective of this work was to examine whether SDOCT-derived parameters such as full retinal and inner retinal thicknesses can differentiate diabetic patients with DPN from non-diabetic individuals and diabetic patients without DPN. We examined the sensitivity at fixed specificity levels, namely at 80% and 95%. One may choose to have a test with high sensitivity for detecting a disease (ruling-in the disease). This method would ensure that most if not all of those with DPN will be detected, but this would also result in higher false positives. Choosing a highly sensitive test will also falsely label a normal person as having a disease. As a result, we would be subjecting the false positives to more elaborate and time-consuming traditional neuropathy tests. Techniques such as quantitative sensory testing (QST)3 and electrophysiology4 can quantify nerve function but have considerable limitations in terms of reproducibility. Whilst skin and nerve biopsies serve to more accurately quantify early neuropathy, they are invasive procedures, and also require considerable laboratory expertise. The cut-off points for GCC FLV was 0.48% with 67% sensitivity and 73% specificity while that for inferior RNFL thickness was 97μm, with 81% sensitivity and 72% specificity. This shows early promise.
Optical coherence tomography is simple, non-invasive, quick to perform and cost-effective and has evolved as a standard clinical technique in the evaluation and further management of retinal and optic nerve disease. As a highly vascularized and innervated tissue, the retina is implicated in neurological complications of diabetes and is therefore a candidate to serve as an ophthalmic marker of DPN.21 The nature and extent of compromise of retinal structural integrity has been characterized in individuals suffering from diabetic peripheral neuropathy using OCT.
Our previous study demonstrated that diabetic neuropathy is a risk factor for compromised retinal structural integrity in patients with diabetes, independent of diabetic retinopathy.8–10 As such, neuropathy may be present in the absence of clinical signs of DR. Therefore, eye care practitioners must note that the absence of diabetic retinopathy does not rule out any retinal or neuoretinal complications of diabetes. Individuals can have undiagnosed diabetic peripheral neuropathy and its associated neuroretinal complications. Due to the transparent nature of the retinal nerve fiber layer, a compromise to the neural layers in relation to diabetic neuropathy may or may not be noticeable during a routine eye examination. DPN is a debilitating condition for which there is no effective treatment as yet. Therefore, screening, early detection and timely referral are indicated. The OCT-derived parameters may be utilized for identification of individuals who need to be referred to their health care provider for appropriate investigations for undiagnosed neuropathic complications of diabetes. This would help in intervening at the early stages so that any avoidable complications can be prevented. Conversely, once these retinal findings have been established as markers, ophthalmic screening may detect a previously undiagnosed neuropathy.
If the various ophthalmic markers of diabetic neuropathy such as the potential retinal markers investigated in this study are eventually validated, then eye care practitioners may become an important part of multidisciplinary teams,21 including diabetic physicians and podiatrists. Ophthalmologists, optometrists and opticians may possibly have a role in the co-management of patients with DPN. A timely referral and management plan can prevent or delay unnecessary consequences.
With further validation, these ophthalmic markers could become established as rapid, painless, non-invasive, sensitive, reiterative, cost-effective, and clinically accessible means of screening for early detection, diagnosis, staging severity, and monitoring progression of DPN, as well as assessing the effectiveness of possible therapeutic interventions. In the future, research may pave the way for an expanded role for the ophthalmic professions in diabetes management in screening for diabetic complications such as retinopathy and neuropathy. These findings not only extend our understanding of the pathological processes involved in diabetic neuropathy but also offer novel ophthalmic approaches to the diagnosis and possible monitoring paradigms of this debilitating condition.
There is currently no single, effective, valid means to diagnose diabetic peripheral neuropathy. It is possible that ophthalmic markers may offer a viable alternative or a substitute to the current screening methods for DPN and may decrease the need for painful, expensive and invasive procedures such as skin or nerve biopsies.21
We used spectral domain OCT (SDOCT) because of its known improved resolution than the contemporary time domain OCTs (TDOCT) available then, and for better detailed-oriented imaging. Spectral domain OCT measures higher retinal thickness than TDOCT and is likely due to the differences in the definition of the retinal boundaries used by the segmentation algorithms. We included a non-diabetic control group with which we have made comparisons and both the cases and control groups were examined using the same technology. We demonstrate that the SDOCT technology described in this work is capable of differentiating those with neuropathy from the non-diabetic control group and may prove to be a useful technology for identifying diabetic neuropathy in an ophthalmological/optometric set up. Nevertheless, the technologies cannot be used interchangeably, especially between patient-visits.
We show that retinal parameters have fair to poor diagnostic accuracy in identifying those with DPN compared to patients without DPN and non-diabetic individuals. A likely explanation could be that a NDS of >3 as per our current operative definition for peripheral neuropathy included a majority of individuals with mild and very few with severe DPN. However, the OCT-derived parameters have better diagnostic ability in differentiating moderate or advanced stages of disease form milder stages. It is well-known that diagnostic accuracy and the rates of disease detection improve and are better for identifying more advanced disease.22 Accordingly, we believe that the detection rates and accuracy would be higher for differentiating advanced or severe DPN.
The RNFL thickness has been shown to decrease by ∼0.2μm per year increase in age.23,24 In our study, those with DPN were on an average, 4 years older; the RNFL thickness differed by 12–14μm between groups. The differences between groups are higher than demonstrated test-retest variability in RNFL measurements in healthy populations, suggesting that these findings are not due to chance alone.25
Diabetic retinopathy is an undisputed major ocular complication of diabetes and has been thought to underlie neuro-retinal compromise.26 However, full retinal thickness and inner retinal thickness have been shown to be reduced in individuals with diabetes compared to non-diabetic subjects in minimal,27,28 or no,29,30 clinically detectable retinopathy, suggesting the possibility that additional factors may be contributing to neuroretinal compromise. In the present study, a higher proportion of individuals with DPN had DR compared to patients without DPN, as would be expected as both are related to duration of disease. We have previously shown that the inferior quadrant RNFL thickness10 is significantly reduced in individuals with DPN, especially those with severe DPN and high risk of foot ulceration, independent of DR. Nevertheless, the presence of macular edema or cotton wool spots may artificially elevate retinal thickness. It is impractical to exclude those with DR from the cohort, so as to negate the influence of subtle macular edema, because DR and DPN are common co-morbidities in the population. Deliberate exclusion of those with DR may result in a cohort that is not truly representative of the target population.
As a method of assigning one of the two eyes, we examined the eye on the side of the dominant hand as reported by the participant. The protocol was the same for all participants examined. Therefore, we believe any errors associated with this assignment protocol would have been distributed similarly in cases and in controls.
ConclusionsThis study has demonstrated abnormalities in a number of retinal parameters quantified using OCT in patients with DPN with limited sensitivity but good specificity. However, the utility of using OCT for detecting differences in the same retinal parameters in individuals with minimal sub-clinical neuropathy is limited. This may reflect on the need for more refined quantification of both the presence and severity of neuropathy as well as further refinement of the technology and analytical approaches to quantifying retinal layer deficits. Nevertheless, OCT is a quick, easy and non-invasive technique which has been increasingly deployed in ophthalmic practices, making it a readily available diagnostic technique for neuropathy.
FundingThis work is a part of a larger study designed to investigate longitudinal markers of diabetic peripheral neuropathy, which was supported by Juvenile Diabetes Research Foundation International (8-2008-362) and National Health and Medical Research Council (Australia) (497230).
Conflicts of interestThe authors report no conflicts of interest. The authors alone are responsible for the content and writing of the paper.


