


The aim of this study was to explore associations between reduced stereoacuity and clinical measures of accommodation, vergences, and symptoms which could facilitate the development of quick and reliable screening tools.
MethodsUsing a multi-stage random cluster sampling, 1211 high school students (481 males and 730 females) between 13 and 18 years of age, were selected and examined. Visual acuity, stereoacuity and suppression, refractive errors, near point of convergence, heterophoria and fusional vergences, as well as, amplitude of accommodation, accommodative response, facility and relative accommodation were evaluated. Correlations among variables and the validity of Randot stereoacuity to distinguish between children with and without defective clinical measures as well as symptomatic versus asymptomatic children were characterized by the sensitivity and specificity of the tests.
ResultsThe overall mean stereoacuity was 43.9 ± 25.23 s arc, and 18.9% [95% Confidence Interval, 16.6−21.4%)] of the participants had reduced stereoacuity (defined as ≥60). Stereoacuity values and symptoms scores were worse in children with defective clinical measures. The Receiver Operation Curve showed that maximum sensitivity and specificity was obtained with near point of convergence break (≥10 cm) of (0.70 95% confidence interval: 0.63–0.77) with Randot stereoacuity test (defined as ≥60 s arc). The correlations between reduced stereoacuity and symptoms scores was moderately strong and statistically significant (Pearson’s, r = 0.507, p = 0.01). The Receiver Operation Curve showed that maximum sensitivity and specificity obtained with the Convergence Insufficiency Symptoms Survey was 0.57 (95% Confidence interval = 0.53–0.62, p = 0.001), sensitivity of 90.26%, and specificity 15.26% with the Randot stereoacuity test.
ConclusionReduced stereoacuity, defective clinical measures and symptoms of asthenopia were prevalent among sample of school children studied. Randot stereoacuity test could fairly distinguish between defective and normal clinical measures; though the accuracy to differentiate between symptomatic and asymptomatic school children is poor. These findings highlight the need for validation of a simple and fast screening tool in school settings. Further studies to confirm above findings will be needed.
El objetivo de este estudio fue explorar las asociaciones entre la reducción de estereoagudeza y las medidas clínicas de acomodación, vergencias y síntomas que pudieran facilitar el desarrollo de herramientas de cribado rápidas y fiables.
MétodosUtilizando un muestro de clúster aleatorio de etapas múltiples, se seleccionó y examinó a 1.211 estudiantes de secundaria (481 varones y 730 mujeres) de edades comprendidas entre 13 y 18 años de edad. Se evaluó agudeza visual, estereoagudeza y supresión, errores refractivos, punto próximo de convergencia, heteroforia y vergencias fusionales, así como amplitud de acomodación, respuesta acomodativa, y acomodación de facilidad y relativa. Las correlaciones entre las variables y la validez de la prueba de estereoagudeza de Randot para distinguir entre los niños con y sin medidas clínicas defectuosas, así como los niños sintomáticos versus asintomáticos se caracterizaron mediante la sensibilidad y especificidad de las pruebas.
ResultadosEl valor de estereoagudeza media global fue de 43,9 ± 25,23 seg arc, y el 18,9% [95% de intervalo de confianza, 16,6−21,4%)] de los participantes tenía estereoagudeza reducida (definida como ≥60). Los valores de estereoagudeza y las puntuaciones de los síntomas fueron peores en niños con medidas clínicas defectuosas. La curva de operación del receptor reflejó que la sensibilidad y especificidad máximas se obtenían con rotura del punto próximo de convergencia (≥ 10 cm) (0,70 95% de intervalo de confianza: 0,63–0,77) con la prueba de estereoagudeza de Randot (definida como ≥ 60 seg arc). Las correlaciones entre estereoagudeza reducida y las puntuaciones de los síntomas fueron moderadamente fuertes y estadísticamente significativas (r de Pearson = 0,507, p = 0,01). La curva de operación del receptor reflejó que el valor de sensibilidad y especificidad máximas obtenidas con los síntomas de insuficiencia de convergencia era de 0,57 (95% de intervalo de confianza = 0,53–0,62, p = 0,001, sensibilidad del 90,26%, y especificidad del 15,26% con la prueba de estereoagudeza de Randot.
ConclusiónLa reducción de la estereoagudeza, las medidas clínicas defectuosas y los síntomas de astenopia fueron prevalentes entre la muestra de estudiantes analizada. La prueba de estereoagudeza de Randot podría distinguir bastante bien entre medidas clínicas defectuosas y normales, aunque la precisión para distinguir entre estudiantes sintomáticos y asintomáticos es bastante débil. Estos hallazgos subrayan la necesidad de validar una herramienta de cribado simple y rápida en centros escolares. Se necesitan estudios futuros para confirmar los hallazgos anteriores.
Stereopsis is defined as binocular visual depth perception based on retinal rivalry and involves a complex neural interaction between motor and sensory processes.1–3 Stereopsis is one of the parameters used to evaluate the interactions of the accommodative and vergence systems.1–3 Stereoacuity is the smallest amount of horizontal retinal image disparity that gives rise to a sensation of relative depth.1,2 Saladin3 described stereoacuity as a “barometer of vision” and good stereoacuity is a measure of the presence of good binocularity. In some case, however, defects in clinical measures of accommodation and vergence become more clinically important when individuals become symptomatic and visual performance are affected.4 Evaluating patients’ symptoms play a fundamental role in vision care practice as most patients consult the eye care practitioners because their symptoms bother them.
Another variable of interest is vision screening—which has been a strategic way to identify persons who have vision anomalies. This is relevant especially for underprivileged children who may be unable to afford an independent optometrist. Given the settings of most screenings, researchers require simple, fast and reliable screening tools and protocols which will enable them to minimize false positive referrals. A simple tool such as the stereoacuity test which has been reported to be a good screening tool among university students5 will be useful. However, studies on the association between stereoacuity and accommodative and vergence anomalies which could enhance validation of stereoacuity as a screening tool are scarce. A good starting point to such studies is exploring the possible correlations among stereoacuity and accommodative and vergence measures.
A few studies in the 1950s investigated aspects of the relation of vergence measures and stereoacuity using laboratory experiments. Findings from these studies are inconsistent.6–11 Poggio and Poggio noted that given the importance of eye movements in stereopsis, it is surprising that so little is known about its role in stereopsis.12 Besides placing targets of interest on the horopter for fusion, vergence eye movements also bring them into the range of maximum stereoacuity.1,12 Therefore, defects in oculomotor systems may influence stereocuity. The only related study was reported by Garzia and Nicholson.13 They investigated stereopsis, accommodative and vergence facility in 43 university baseball players and found that only 6% of students with poor accommodative facility failed stereoacuity test.13 Furthermore, only two available studies reported on stereoacuity and symptoms5,14 Ponsonby et al.14 studied children aged 7–14 years in Tasmania while Momeni-Moghadam et al.5 studied binocular anomalies and symptoms in a university population (mean age 20.89 ± 1.3 years). Both studies5,14 Ponsonby et al.14 found that participants with reduced stereoacuity had higher symptoms scores using the CISS.
In general studies on the associations of reduced stereoacuity and clinical measures and symptoms especially in a high school population are scares. Therefore, the aim of the present study was to explore associations between stereoacuity and clinical measures of accommodation and vergences, and symptoms. The hypotheses proposed was that significant association between reduced stereocuities and defects in clinical measures, and with symptoms will suggest that reduced stereoacuity could predict participants with deficient clinical measures and those who may be symptomatic.
MethodsStudy designThis cross sectional study was designed to quantify near vision anomalies (refractive and accommodative-vergence) and their association with symptoms in order to develop strategies on how to identify and treat them. Therefore, the focus of this report is on near vision variables. The study protocol was approved by the Biomedical Research Ethics Committee (ethical clearance reference number BE 177/12) of the University of KwaZulu-Natal, South Africa. Written informed consents for access to the schools were obtained from the KwaZulu-Natal’s Department of Education and the school principals.
SamplingThe target population was Black high school students in the uMhlathuze Municipality of northern Kwazulu-Natal Province, South Africa. The study participants comprised 1211 children (481 males and 730 females) with age ranges of between 13–18 years who were selected from 13 out of a sample frame of 60 high schools in the municipality. The sample size was derived from the original study–part of which has been published elsewhere.15,16 The conduct of this study complied with the Declaration of Helsinki regarding research on human subjects. For the entire study, students were excluded if they had suppression on the Worth-4-dot, strabismus, ocular diseases, nystagmus, motility problems, and any systemic conditions or were on any systemic medication that might affect near vision function.
Study settings, materials and procedureThe school principals provided rooms at the school venues where the vision examinations were conducted. The purpose and procedure for every technique were carefully explained to each participant before starting the eye examination procedures. Validated optometric instruments were used and techniques were applied as described. As much as possible, the same conditions including test distances and standard room illumination were applied for all sessions and at all testing sites. All vision testing was performed between 08h30 and 13h30 over a period of one year and eye examinations were not performed when students were preparing for examinations or during examination days.
Symptoms surveyThe case history comprised information on the history of ocular and systemic conditions, as well as the history related to near tasks, which was based on the Convergence Insufficiency Symptom Survey (CISS)17 (Part1) (Appendix A, Supplementary material). The CISS is a validated reliable symptoms survey developed to study the frequency and severity of symptoms and to distinguish between symptomatic and asymptomatic convergence insufficiency (CI) children.17,18 It uses a Likert-type scale with responses from 15 questions regarding the symptoms participants experienced when reading or doing close work.17,18 The CISS allows a recording for whether the symptom is present and how often. The 15 items are summed to obtain an overall CISS score, with symptom severity ranging from 0 (asymptomatic) to 60 (most symptomatic).17,18 To administer the CISS, the examiner reads each of the 15 questions aloud while the participant views a card listing the five possible responses (never, infrequently, sometimes, fairly often, or always) which are assigned corresponding scores of 0, 1, 2, 3, and 4.17,18 Although the CISS was validated for CI, the inventors17 suggested that it could be applied to investigate symptoms of other anomalies and as reported in Gallaway and Mitchell,18 only one available study had done so while other studies have applied the CISS to evaluate symptoms for non-CI clinical measures.5.14 Because the CISS did not cover all symptoms items that may be associated with accommodative and vergence defects, a second questionnaire (Appendix B, Supplementary material) was compiled from sources detailed elsewhere.16
Data collection proceduresPreliminary testsAs an approach to avoid bias, the research assistant in station one worked independently of the optometrist who collected data in station two. The tests in the second station were performed by one certified optometrist who was experienced in performing the techniques therefore addressing the concern of inter-examiner variability. The techniques performed in the second station included the preliminary and the main tests.
The preliminary tests were performed with participants wearing no optical correction and included ocular health status evaluation using the direct ophthalmoscope, suppression was evaluated at near using the Worth-4-Dot test (Bernell Corporation, Mishawaka Inc, USA).15,16 Other tests included evaluation of refractive errors objectively using an autorefractor (MRK/3100; Huvitz, Seoul, South Korea) and subjectively.15,16 Cycloplegia was not applied as the entire study was on investigating near vision anomalies and cycloplegia could affect near vision functions. In addition, the intention was to evaluate students’ binocular vision status in their habitual state. Cycloplegia could not be applied as the focus of the study was on near function which will be disrupted by cycloplegia and school authorities declined permission to use cyclopegia. All cases were treated as new to ensure that maximal refractive compensation was utilised although most students did not wear glasses. As cycloplegia was not applied a +2.00 D lens was used to screen for latent hyperopia.4
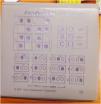
StereoacuityStereoacuity tests measure the smallest amount of recognizable retinal disparity in seconds of arc and this was assessed using the Randot stereo test (RST) (Vision Assessment Corporation, New York, USA) which measures global and contour (local) stereopsis.19,20 The RST measures fine stereopsis (perception obtained from small retinal disparities that can be fused for single vision)20 and has been reported to be the most sensitive of the clinical test for stereoacuity and the reports on presence or absence of monocular cue is inconsistent.21–23 The test booklet comprise symbols (house, square, apple and big circle) (measures from 400 to 100 s arc and smaller circles on test page19,20 (Fig. 1).

The test comprises 12 sets (of three circles with four rows) and the vectographic method is used to present disparity.9,22 The circles measure fine local stereopsis (400 down to 12.5 s arc)19 and were used for this test. The test was done at 40 cm in normal room illumination with participant sitting and wearing vectographic spectacles without refractive correction in line with some objectives of the main study. Participants` attention was then directed to the top 4 panels on the right-hand side of the open test book labelled A, B, C, and D. Given a time limit of 5 per line for response, participant was asked to identify the 3 panels which contain either a shape or figure.19 Regardless of whether or not all figures were correctly identified and to measure fine stereoscopic threshold, the participant was asked to look at the 12 boxes each containing 3 circles and to indicate which circle (left, middle, or right) appeared to be floating (or “pop out”) slightly above the other circles and that is the only circle that has crossed disparity.19,23 The procedure was repeated for boxes 2–12 and the number of figures identified correctly was recorded. The first consistent incorrect response on the circles was considered the limit of disparity except when the patient identified two consecutive finer stimuli correctly.19,23
Accommodative and vergence testsThe accommodative and vergence tests are routine optometric techniques and have been described in detail in an earlier publication15,16 All near tests were performed at 40 cm with the best refractive distance corrections in place. The tests were performed three times and an average reading taken for analysis. For vergence test, the study is delimited to the report of only break values for NPC, negative fusional (BI) and positive fusional vergences (BO) respectively as the blur points of most participants appeared inconsistent. The near point of convergence (NPC) was measured using the Royal Air Force (RAF) rule with a vertical line target, the unilateral cover test was first performed to rule out strabismus while distance and near heterophoria were evaluated using the von Graefe technique in a specially-designed phoropter tripod.15,16 Fusional vergences (positive and negative) were measured using a horizontal prism bar (Gulden B-16 horizontal prism bars-Gulden Ophthalmics, Elkins Park, PA). Negative fusional vergence was measured first before positive fusional vergences.16,21
Accommodation tests performed included the amplitude of accommodation (AA) which was assessed using the Donder’s push-up method with the RAF near point rule,15,16 accommodation response (AR) was measured using the monocular estimated method (MEM) dynamic retinoscopy technique15,16 and accommodative facility (AF) was assessed using the plus/minus 2.00 D flipper lens. Relative accommodation tests were performed on the phoropter, negative relative accommodation (NRA) was measured first followed by positive relative accommodation (PRA).15,16
Data analysisAll data were entered on Microsoft Excel, checked by the author and analyzed by a statistician using the Statistical Package for Social Sciences (SPSS for Windows, Version 21.0, IBM-SPSS, Chicago, IL, USA). Descriptive statistics were presented as means, standard deviation and median. The Kolmogorov-Smirnov (K–S) was used to test for normality of data and given that most data were borderline between normal and non-normal distribution, both parametric and non-parametric statistical tests were applied to analyse most data. Specifically, both the Mann-Whitney test, Kruskal-Wallis and the t-tests were used to compare means and medians of defective clinical measures for stereoacuity and symptoms. Similarly, the Pearson correlation tests were used to compare the correlations between stereoacuity and clinical measures, as well as, with symptoms while Spearman’s rho test was used to examine correlations between clinical measures and symptoms. A p value of ≤ 0.05 was considered statistically significant. The descriptive statistics are presented using tables, while the frequency distributions of stereoscopic threshold are presented using the histogram. The criteria applied to define the clinical measures (Table 1) were derived from a recent study on normative data from the sample using at least the mean ± 1 SD.15,16
Criteria applied to define deficient clinical measured.
| Clinical measures | Cut-off criteria (Fail) |
|---|---|
| Stereoacuity | |
| Reduced stereoacuity (sec arc) | ≥ 60 |
| Vergence | |
| Near point of convergence (NPC) (cm) | ≥ 10 |
| Near exophoria (pd) | ≥ 6 |
| Near esophoria (pd) | ≥ 2 |
| Right near hyperphoria (pd) | ≥ 0.5 |
| Fusional vergences (FV) (pd) | |
| Negative fusional vergence break (pd) | ≤ 12 |
| Positive fusional vergence break (pd) | ≤ 16 |
| Sheard’s criterion = FV ≥ 2 X phoria (pd) | |
| Accommodation | |
| Amplitude of accommodation (AA) (binocular) D | ≤ 12 |
| Accommodative facility (AF) ± 2 (binocular) (cpm) | ≤ 5 |
| Accommodative response (AR) DS | ≥ 0.75 |
| Negative relative accommodation DS | ≥ + 2.50 |
| Positive relative accommodation DS | ≥ −3.00 |
A simple, fast and valid screening tool is required to minimize over referrals and validation of screening tools were achieved through sensitivity, specificity and the Receiver Operation Curve (ROC) analysis. The ability of the test tool to distinguish between children with and without defects in the present study was characterized using the sensitivity and specificity of the tests.18 The sensitivity of the test is calculated as the percentage of children with defects in clinical measures who were correctly identified by the test tool. To be considered useful to identify vision defects, a high sensitivity (or low rate of false-negative results) is required while a high specificity (or low rate of false-positive results) is necessary to conclude that the test is a useful tool for confirming deficiencies in clinical measures.18
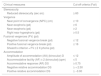
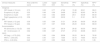
ResultsSample characteristicsA total of 1211 returned their consent and assent forms but 10 students were excluded, (seven had amblyopia, one was diabetic, another was diagnosed with glaucoma and the other had corneal scars due to trauma) leaving 1201. A further 145 children aged 19 and older were excluded from this report as it is intended to report only on participants of official high school age range of 13–18 years in South Africa. Thus, data was analyzed for 1056 participants (a response rate of 87%) with mean age 15.8 ± 1.58 years and a median age 16 years. There were 403 (38%) males and 653 (62%) females. The sample comprised 781 (73.9%) students from grades 8–10 (lower grade level) and 275 (26.0%) from grades 11–12 (higher grade level).There was a high correlation between left and right eyes spherical equivalent refractions (r = 0.645, p = 0.01), therefore, only data for right eye are reported. The prevalence of refractive errors in this sample was: myopia: 6%, astigmatism 2.3%, anisometropia 1.3% and hyperopia 6.8%. The descriptive statistics for refractive, accommodative and vergence measures are shown in Table 2. All results reported are for near accommodative and vergence measures.
Descriptive statistics for accommodative and vergence measures and symptoms.
| Clinical measures | N | Mean, SD | Skew |
|---|---|---|---|
| Symptoms scores | 1052 | 27.38 ± 11.04 | −0.120 |
| Refraction | |||
| Right eye sphere (DS) | 1056 | −0.01 ± 0.36 | −6.22 |
| Right eye cylinder power (DC) | 1056 | −0.07 ± 0.25 | −8.24 |
| Stereoacuity (sec arc) | 1055 | 43.9 ± 25.23 | 4.41 |
| Vergence | |||
| Near point of convergences (NPC) (cm) | |||
| Near point of convergences break (cm) | 1056 | 6.88 ± 2.88 | 6.15 |
| Near point of convergences recovery (cm) | 1056 | 9.48 ± 3.47 | 5.25 |
| Heterophoria (near) (pd) | |||
| Lateral (pd) | 1056 | −1.78 ± 4.24 | 0.26 |
| Vertical (pd) | 1056 | 0.03 ± 0.36 | 14.91 |
| Near fusional vergences (pd) | |||
| Negative fusional vergence break (pd) | 1055 | 17.37 ± 5.45 | 0.66 |
| Negative fusional vergence recovery (pd) | 1055 | 12.52 ± 4.23 | 0.07 |
| Positive fusional vergence break (pd) | 1055 | 25.38 ± 9.16 | −0.41 |
| Positive fusional vergence recovery (pd) | 1055 | 17.49 ± 6.77 | 0.35 |
| Accommodation (D) | |||
| Amplitude of accommodation (bin) (D) | 1056 | 15.6 ± 3.19 | −0.58 |
| Accommodative facility binocular ± 2 (cpm) | 996 | 8.75 ± 3.46 | −0.68 |
| Accommodative response (lag)(D) | 1051 | 0.55 ± 0.21 | 0.06 |
| Negative relative accommodation (D) | 1055 | 2.17 ± 0.48 | −2.76 |
| Positive relative accommodation (D) | 1055 | −2.44 ± 0 .71 | 1.43 |
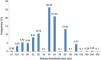
The stereo threshold of 40 arc sec was the most frequent (Fig. 2).
Prevalence and distribution of reduced stereoacuity
The main criteria used to define reduced stereoacuity were ≥60 s arc and this was used for analysis and associations with symptoms. The prevalence of reduced stereoacuity was 199 (18.9%) (95% CI = 16.6–21.4). Other distributions included ≥40 which was 699 (66.5%) (95% CI = 63.5–69.3%) while ≥ 80 was 58 (5.5%) (95% CI = 4.2–7.1%). Gender did not influence the distribution of stereoacuity (males, mean = 43.3 ± 29.3), (females, mean = 44.4 ± 22.4) (t = 0.495, p = 0.68) although participants in the older age-group (16–18 years) had a significantly higher (worse) mean stereoacuity (mean = 45.9 ± 28.0 years) than those in the younger age group (13–15 years) mean stereoacuity = 40.96 ± 20.04 years (t = 3.14, p = 0.002).
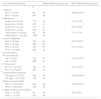
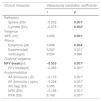
Associations between stereoacuity and clinical measuresGiven that the data for stereoacuity was skewed, the Mann-Whitney test non-parametric test was used to analyse associations between clinical measures and stereoacuity. The median stereoacuities for defective clinical measures were significantly higher (worse) than for normal ranges for most clinical measures except near hyperphoria and positive relative accommodation (Table 3). Furthermore, the Pearson’s correlation test showed significant and moderate correlations between clinical measures and stereoacuity except for vertical phoria (Table 4). The median stereoacuities for convergence measures are higher than accommodative measures indicating that convergence measures have worse stereoacuities with stronger associations.
Associations between stereoacuity and clinical measures.
| Clinical measures/cut-offs | Median stereoacuity (sec arc) | Mann-Whitney test values (p-) | |
|---|---|---|---|
| n | |||
| Vergence | |||
| NPC ( ≥ 10 cm) | 66 | 58 | 36.69 (0.001)* |
| NPC (< 10 cm) | 984 | 40 | |
| Heterophoria | |||
| Exophoria (≥ 6) (pd) | 172 | 40 | 2.47 (0.116) |
| Exophoria( < 6) (pd) | 874 | 40 | |
| Esophoria ( ≥ 2) (pd) | 135 | 40 | 8.31 (0.004)* |
| Esophoria (< 2) (pd) | 908 | 40 | |
| Hyper phoria (≥ 0.5) (pd) | 38 | 40 | 1.71 (0.191) |
| Hyper phoria ( < 0.5) (pd) | 1006 | 40 | |
| Fusional vergences | |||
| NFV (≤ 12) (pd) | 184 | 50 | 19.60 (0.001)* |
| NFV (> 12) (pd) | 863 | 40 | |
| PFV (≤ 16) (pd) | 161 | 50 | 27.41 (0.001)* |
| PFV ( > 16 ) (pd) | 890 | 40 | |
| Accommodation | |||
| AA (binocular) (D) | |||
| AA (≤ 12) (D) | 183 | 50 | 33.04 (0.001)* |
| AA (> 12) (D) | 866 | 40 | |
| AF (binocular) | |||
| AF ± 2 ( ≤ 5) (cpm) | 182 | 50 | 30.47 (0.001) |
| AF ± 2 ((> 5) (cpm) | 807 | 40 | |
| Accommodative response | |||
| AR (lag) (≥ 0.75) (DS) | 252 | 50 | 26.20 (0.001)* |
| AR (lag) ( < 0.75) (DS) | 792 | 40 | |
| Relative accommodation | |||
| NRA ( ≥ +2.50) (DS) | 404 | 40 | 12.90 (0.001)* |
| NRA ( < 2.50) (DS) | 640 | 40 | |
| Positive relative accommodation | |||
| PRA ( ≥ −3)(DS) | 69 | 40 | 3.05 (0.081) |
| PRA ( < −3) (DS) | 975 | 40 | |
Variables with significant associations. NPC = near point of convergence, NFV = near fusional vergence, PFV = positive fusional vergence, AA = amplitude of accommodation, AF = accommodative facility, AR = accommodative response, NRA = negative relative accommodation, PRA = positive relative accommodation.
Correlations between clinical measures and stereoacuity.
| Clinical measures | Stereoacuity correlation coefficients | |
|---|---|---|
| r | p | |
| Refraction | ||
| Sphere (DS) | −0.202 | 0.001* |
| Cylinder (DC) | −0.075 | 0.002* |
| Vergence | ||
| NPC (cm) | 0.292 | 0.001* |
| Phoria | ||
| Exophoria (pd) | 0.088 | 0.004* |
| Esophoria(pd) | 0.240 | 0.001* |
| Vertical(pd) | 0.004 | 0.886 |
| Fusional vergence | ||
| NFV break(pd) | −0.553 | 0.001* |
| PFV break(pd) | −0.365 | 0.001* |
| Accommodation | ||
| AA (binocular ) (D) | −0.116 | 0.001* |
| AF (binocular ) (cpm) | −0.244 | 0.001* |
| AR (lag) (DS) | 0.095 | 0.002* |
| NRA (DS) | −0.138 | 0.001* |
| PRA (DS) | 0.146 | 0.001* |
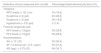
A high percentage of participants who had defective clinical measures also had reduced stereoacuity (Table 5) and participants with accommodation lag had the highest frequency of fails of the stereoacuity test while hyperphoria had the least frequency of failure of stereoacuity
Percentage of defective clinical measures with reduced stereoacuity.
| Defective clinical measures with cut-offs | Percentage failed stereoacuity test (n/%) |
|---|---|
| Vergence | |
| NPC break (≥ 10) ( cm) | 33 (16.6) |
| Exophoria (≥ 6) (pd) | 45 (22.0) |
| Esophoria (> 2) (pd) | 38 (18.6) |
| Hyperphoria (> 0.5) (pd) | 3 (1.4) |
| Fusional vergences (pd) | |
| NFV break (≤ 12)(pd) | 59 (29.8) |
| PFV break (≤ 16)(pd) | 59 (29.6) |
| Accommodation | |
| AA (≤ 12 ) (D) | 52 (26.4) |
| AF ± 2 (binocular ) (≤ 5 ) (cpm) | 50 (27.6) |
| AR (lag) ( ≥ 0.75) (D) | 68 (34.7) |
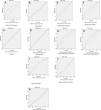
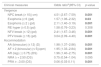
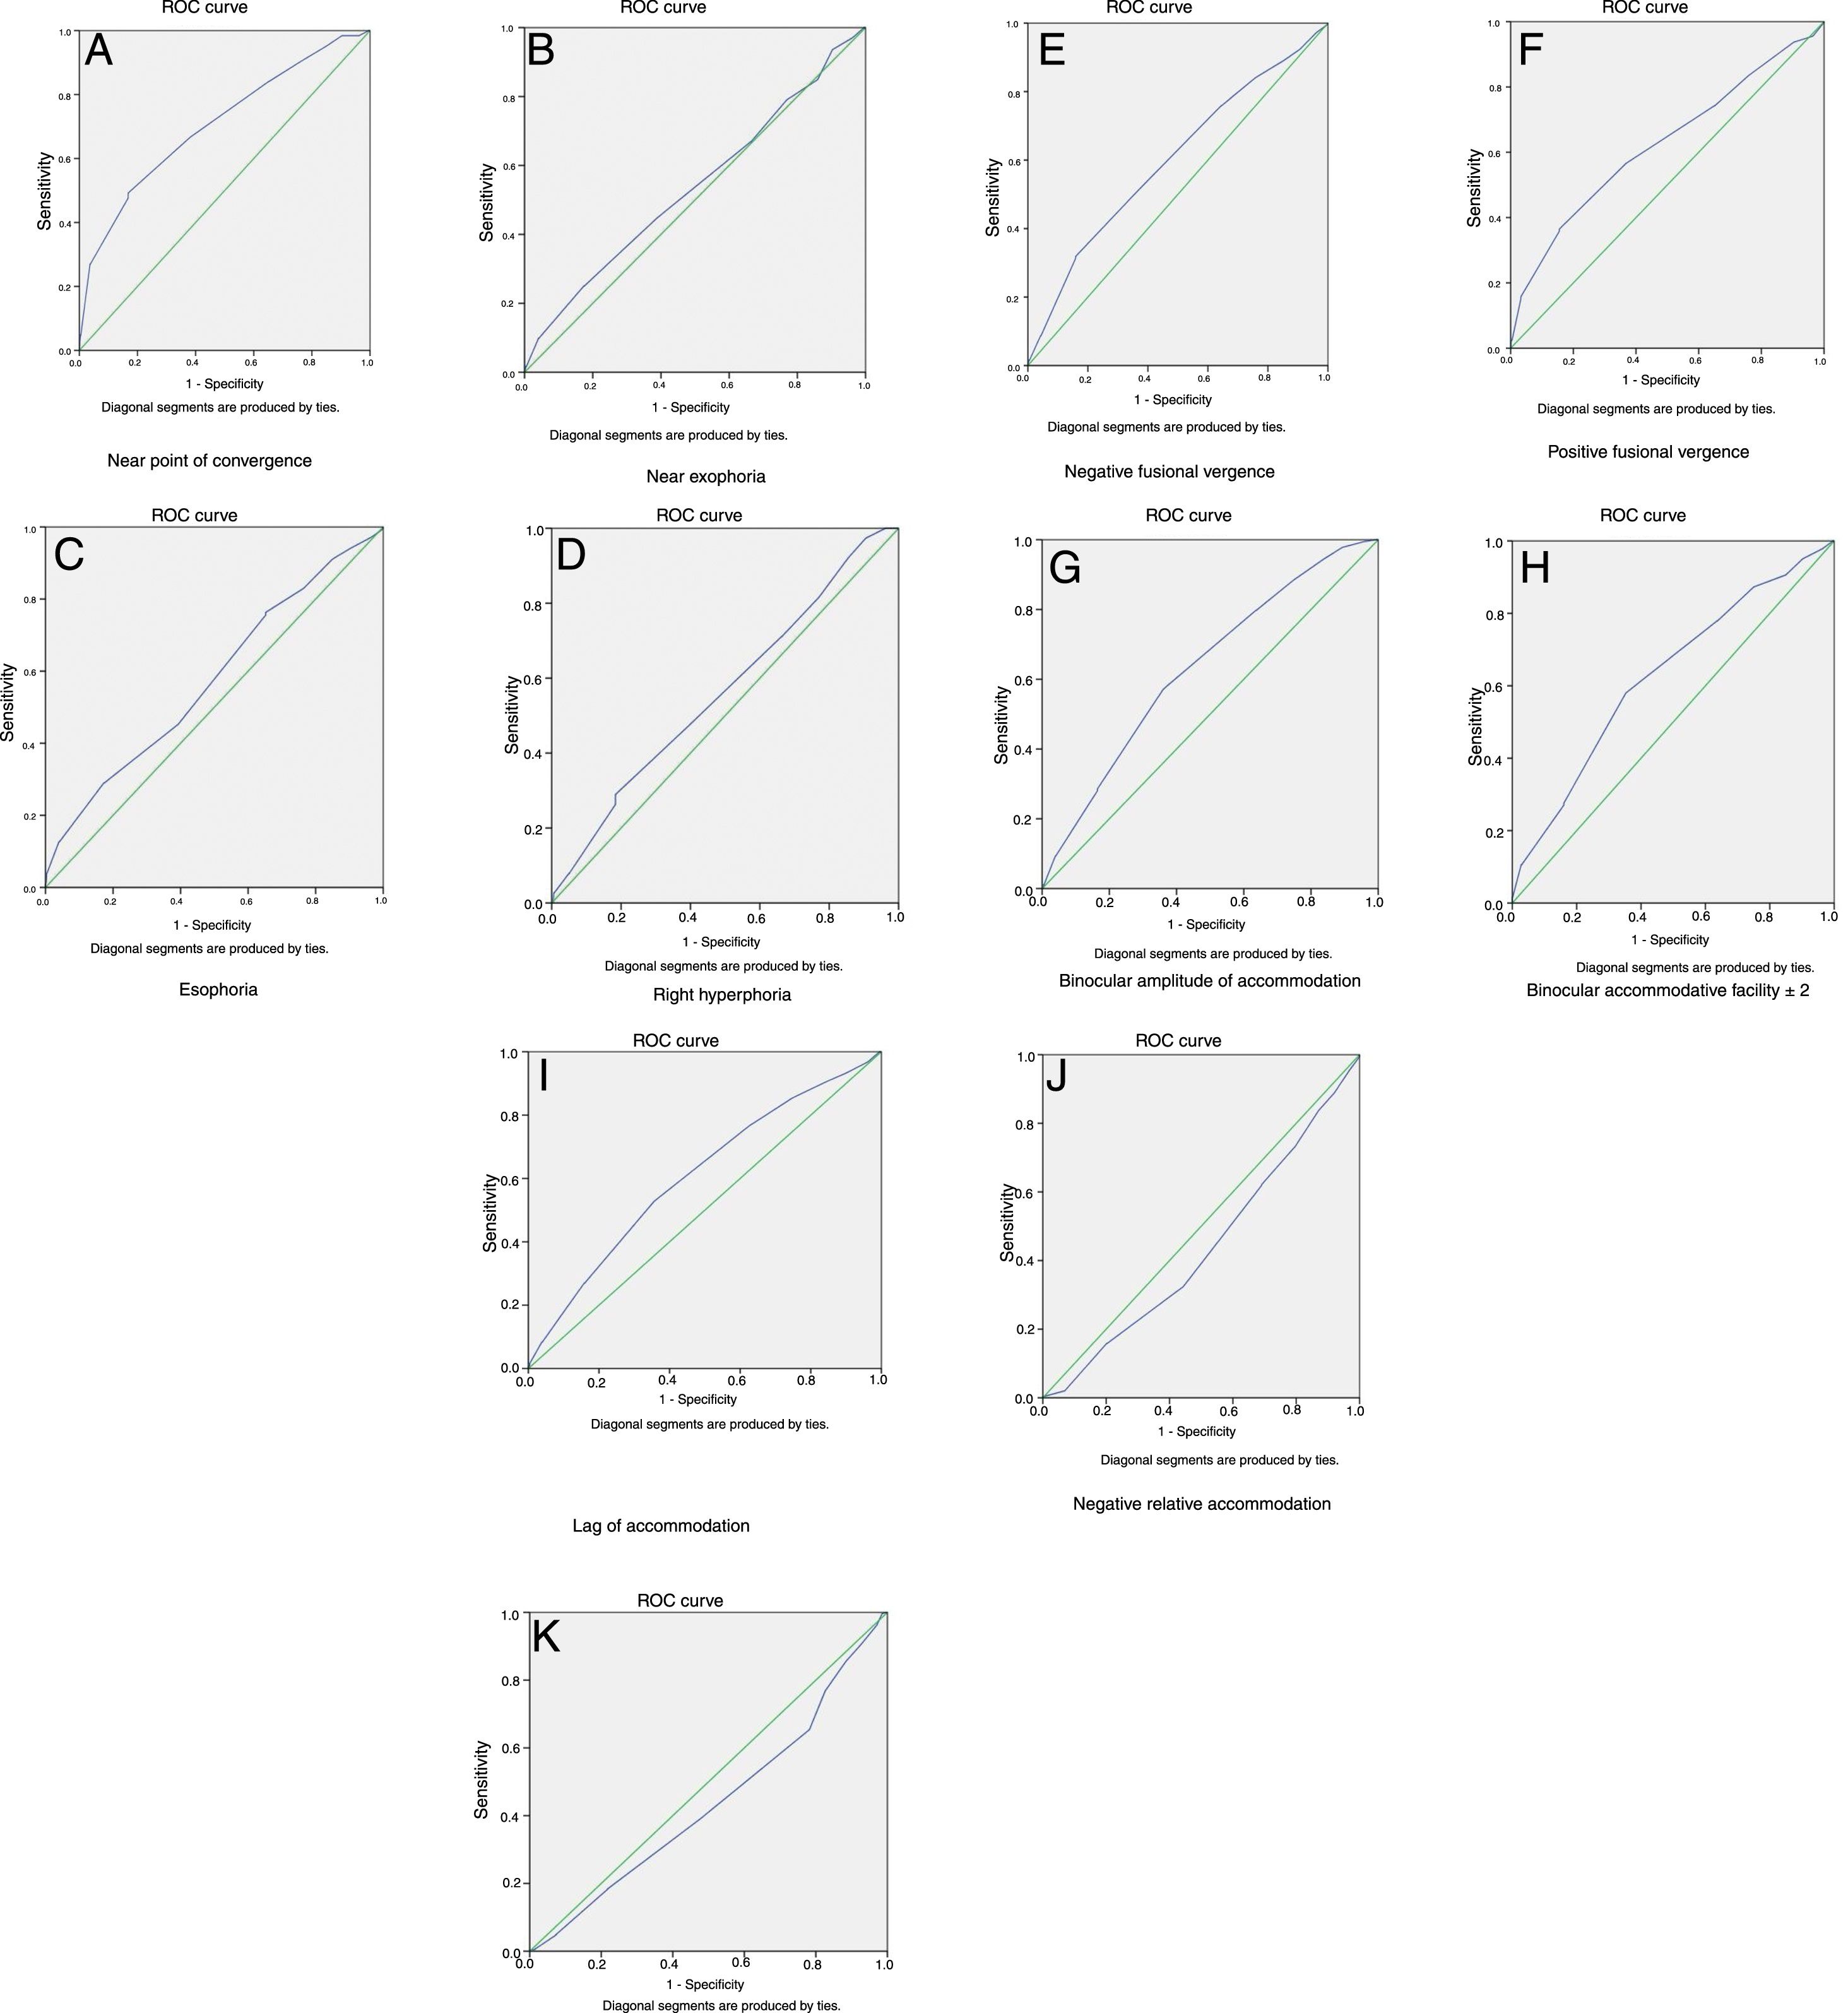
To explore the accuracy of the Randot stereoacuity test to distinguish between normal and defective clinical measures, the sensitivity and specificity estimates (Table 6), the ROC curves characteristics (Fig. 3A–K) as well as, the odds ratios (Table 7) were analyzed. A stereoacuity test (with cut-off of ≥60 s arc) was more likely to be accompanied with reduced NPC break, PFV, reduced AA, AF and lag of accommodation (Table 6). The reverse nature of the plots for relative accommodation shows that Randot stereoacuity test cannot identify defective relative accommodation.
Sensitivity and specificity of diagnosis of defects in accommodative and vergence measures with Randot stereoacuity test.
| Clinical measures | Area under the curve | Lower limit | Upper limit | Sensitivity (%) | PPV* (%) | Specificity (%) | NPV* (%) |
|---|---|---|---|---|---|---|---|
| Vergence | |||||||
| NPC break (≥ 10) (cm) | 0.70 | 0.63 | 0.77 | 47.62 | 15.38 | 83.21 | 96.61 |
| Exophoria (≥ 6) (pd) | 0.53 | 0.48 | 0.58 | 24.86 | 22.05 | 82.63 | 84.76 |
| Esophoria (≥ 2 (pd) | 0.57 | 0.52 | 0.62 | 28.89 | 20.0 | 83.39 | 89.43 |
| Right hyperphoria (≥ 0.5) (pd) | 0.56 | 0.46 | 0.65 | 26.32 | 5.1 | 81.61 | 96.70 |
| NFV break (≤ 12) (pd) | 0.59 | 0.55 | 0.64 | 31.31 | 29.38 | 84.09 | 85.28 |
| PFV break (≤ 16) (pd) | 0.62 | 0.57 | 0.67 | 35.85 | 29.23 | 84.46 | 88.03 |
| Accommodation | |||||||
| AA (binocular) (≤ 12) (D) | 0.63 | 0.59 | 0.67 | 28.18 | 26.42 | 83.55 | 84.62 |
| AF ± 2 (binocular) ≤ 5 (cpm) | 0.62 | 0.58 | 0.67 | 27.07 | 27.53 | 83.98 | 83.91 |
| AR (lag) ( ≥ 0.75) (DS) | 0.60 | 0.56 | 0.64 | 26.98 | 35.23 | 84.16 | 78.30 |
| NRA ≥ + 2.50 (DS) | 0.43 | 0.40 | 0.47 | 15.84 | 33.16 | 79.84 | 60.04 |
| PRA ≥ −3.00 (DS) | 0.43 | 0.37 | 0.50 | 18.26 | 76.72 | 21.74 | 1.85 |
NPC = near point of convergence, NFV = near fusional vergence, PFV = positive fusional vergence, AA = amplitude of accommodation, AF = accommodative facility, AR = accommodative response, NRA = negative relative accommodation, PRA = positive relative accommodation. PPV = positive predictive value, NPV = negative predictive value, Reduced stereoacuity score ≥ 60 s arc.
Relationship between fail of each clinical test and stereoacuity.
| Clinical measures | Odds ratioa(95% CI) | p-value |
|---|---|---|
| Vergence | ||
| NPC break (≥ 10)( cm) | 4.51 (2.67–7.59) | 0.001 |
| Exophoria (≥ 6 )(pd) | 1.57 (1.06–2.32) | 0.03 |
| Esophoria (≥ 2 ) (pd) | 2.11 (1.40–3.19) | 0.001 |
| RE hyper (≥ 0.5) (pd) | 1.58 (0.76–3.23) | 0.308 |
| NFV break (≤ 12) (pd) | 2.41 (1.67–3.46) | 0.001 |
| PFV break (≤ 16) (pd) | 3.04 (2.09–4.40) | 0.001 |
| Accommodation | ||
| AA (binocular) (≤ 12) (D) | 1.98 (1.37–2.86) | 0.001 |
| AF ± 2 (binocular) (≤ 5)(cpm) | 1.95 (1.33–2.84) | 0.001 |
| AR (lag) ( ≥ 0.75) (DS) | 1.96 (1.40–2.75) | 0.001 |
| NRA ≥ + 2.50 (DS) | 0.75 (0.54–1.04) | 0.095 |
| PRA ≥ −3.00 (DS) | 0.06 (0.03-0.11) | 0.001 |
Tests if increase (or decrease) in stereoacuity scores is associated with increase (or decrease) in odds of failing the clinical test. Statistically significant (p < 0.05 are in bold fonts). RE = right eye Hyperphoria. NPC = near point of convergence, NFV = near fusional vergence, PFV = positive fusional vergence, AA = amplitude of accommodation, AF = accommodative facility, AR = accommodative response, NRA = negative relative accommodation, PRA = positive relative accommodation, Reduced stereoacuity score ≥ 60 s arc.
The ROC for the accommodative and vergence were represented by the Fig. 3 (A–K): near point of convergence break, B: exophoria C: esophoria, D: right hyperphoria, E: negative fusional vergence, F: positive fusional vergence, G: amplitude of accommodation, H: accommodative facility, I: accommodative lag, J: negative relative accommodation, K: positive relative accommodation.
Stereoacuity and symptomsFrequency of CISS symptoms scoresUsing the CISS survey, for Part 1 questionnaire, a high percentage 903 (86%) of participants were symptomatic (defined as ≥16) [41.29% were mildly symptomatic, 32% moderately and 27% severely symptomatic when compared to 149 (14%) who were asymptomatic. For Part 2, 562 (53%) were symptomatic whereas 490 (47%) were asymptomatic although the survey was validated only for Part 1 survey.
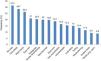
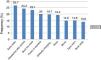
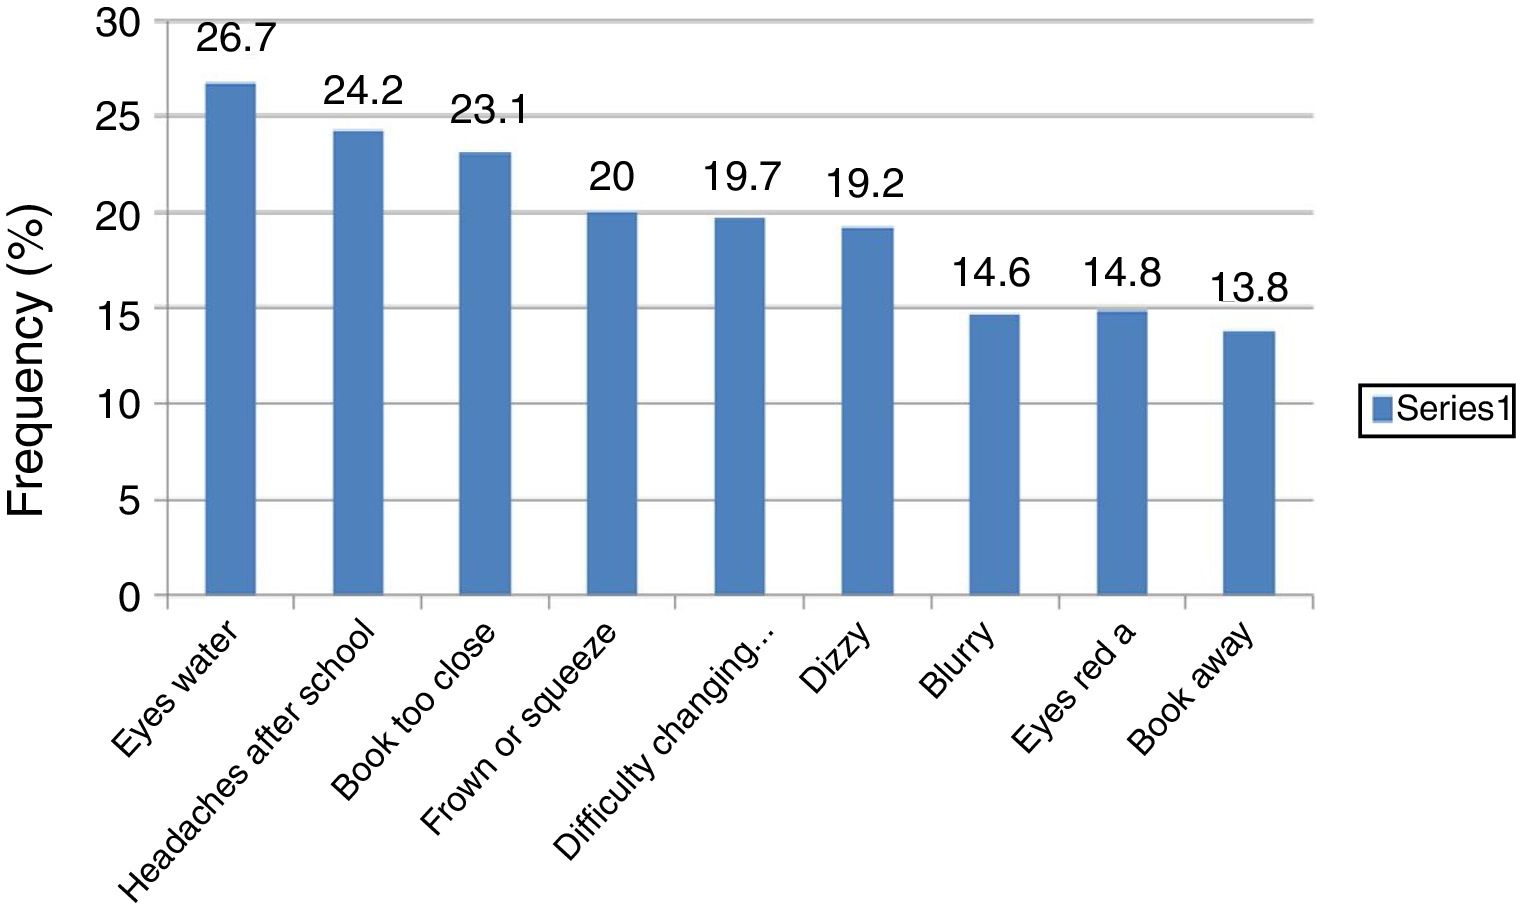
According to Borsting et al.17 the performance-related subscale (PRS) which consisted of six symptoms included loss of concentration, loss of place with reading, reading slowly, trouble remembering what was read, getting sleepy while reading and having to re-read lines. The eye-related subscale consists of nine symptoms specific to visual function or asthenopic-type complaints (such as eyes hurt, diplopia, blurred vision, headaches, eye tiring, eyes sore, words that move and jump, uncomfortable eyes and pulling sensations around the eyes).17 The (PRS) are more frequent than the eye-related which was the case in the present study for four of the PRS symptoms (Fig. 4) Symptoms from Part 2 (Fig. 5) are not part of the validated CISS scale.
Association between symptoms and reduced stereoacuity (Part 1 symptoms survey)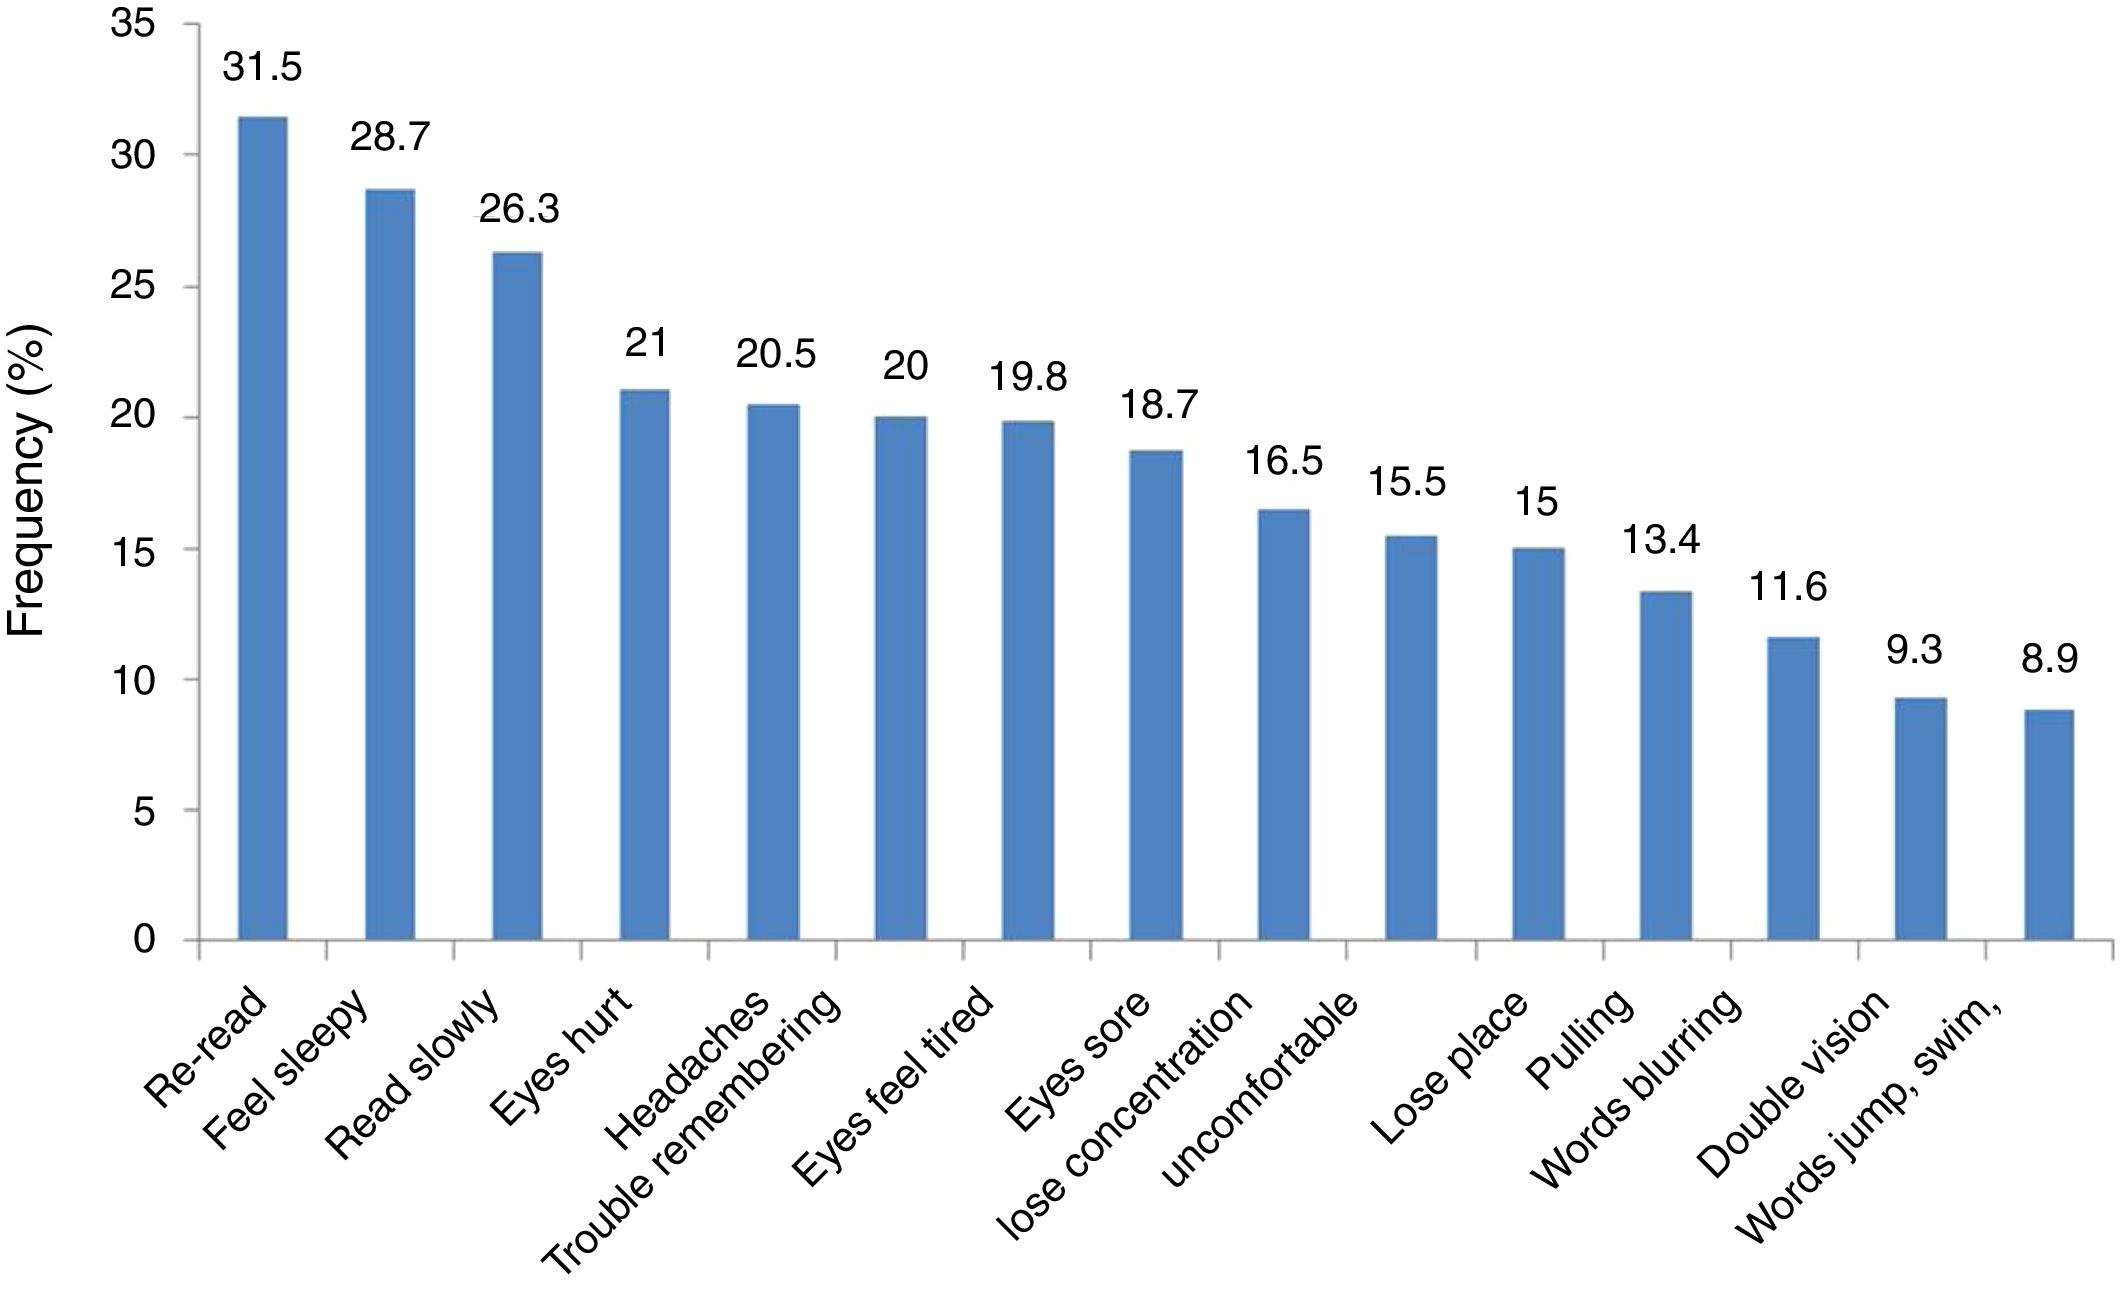
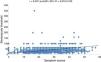
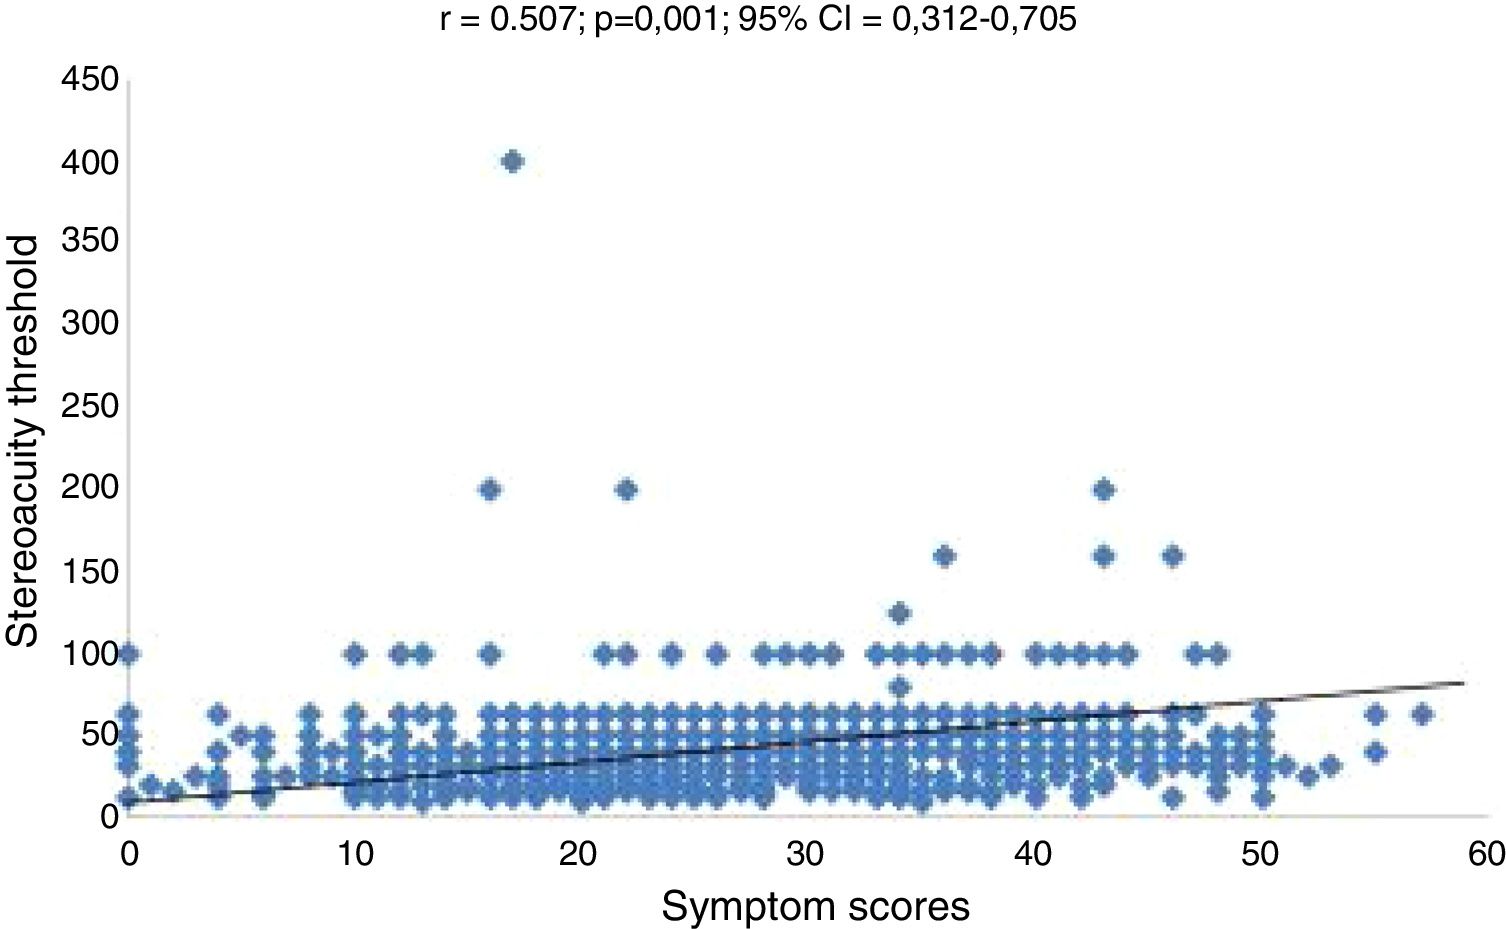
Overall, the mean symptoms scores for Part 1 was 27.38 ± 11.04 and 15.93 ± 7.43 for Part 2 symptoms questionnaire and the mean symptoms score (44.31 ± 24.88) for children with reduced stereoacuity was significantly worse than (39.15 ± 19.50) (p = 0.01) for those with normal stereoacuity. Similarly, symptomatic participants had significantly worse mean stereoacuity (31.96 ± 9.30) than the asymptomatic participants (8.58 ± 5.06) (p = 0.02). However, for percentages, the association between symptoms and reduced stereoacuity was marginally significant (p = 0.05). There were statistically significant moderate positive correlation between stereoacuity and symptoms scores that is, as the symptoms scores increased, the stereoacuity threshold also increased (that is, worsened) (r2 = 0.26 p = 0.001, 95% CI = 0.312−0.705) (Fig. 6). Furthermore, the Pearson correlation tests revealed positive statistically significant but weak relationship between stereoacuity and symptoms scores for Part 2 symptoms scores (r2 = 0.09, 95% CI = 0.125–0.39, p = 0.001).
The mean symptoms for participants with reduced stereoacuity (Mean, 12.94 ± 11.26) were significantly higher than for those with good stereoacuity (Mean, 10.63 ± 10.35, p = 0.01). Furthermore, the relation of stereoacuity with specific response (for “always” responses only) was explored. The mean symptoms for participants with reduced stereoacuity (Mean, 12.94 ± 11.26) were significantly higher than for those with good stereoacuity (Mean, 10.63 ± 10.35) (p = 0.01). Similarly, for Part 2 symptoms survey, the mean symptoms for participants with reduced stereoacuity (mean, 8.18 ± 7.53) was significantly higher than for those with good stereoacuity (Mean 6.75 ± 7.08) (p = 0.01).
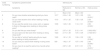
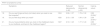
To facilitate differential diagnosis, analysis of associations of stereoacuity with specific symptoms was investigated. For Part 1 symptoms, in 8 out of 15 questions (53%), (Table 8a, highlighted) the reduced stereoacuity category showed significantly higher mean symptoms scores while good stereoacuity had higher mean symptoms scores for 7/15 (47%) (Table 8a). For Part 2 questionnaire with 9 questions, the mean for reduced stereoacuity was significantly higher in only 3 out of 9 questions (33%) (Table 8b). Only variables with significant association with symptoms questionnaire are indicated on Tables 8a and 8b.
Associations between stereoacuity and specific symptoms Part 1.
| CISS numbering | Symptoms questionnaires | Stereoacuity | |||
|---|---|---|---|---|---|
| Symptoms | Reduced (≥ 60) | Normal (< 60) | t-test (p-value | ||
| n | Mean ± SD | Mean ± SD | |||
| 6 | Do you have trouble remembering what you have read? | 1017 | 2.34 ± 1.38 | 1.97 ± 1.29 | 3.51 (0.001)* |
| 7 | Do you have double vision when reading or doing close work? | 1012 | 1.57 ± 1.32 | 1.32 ± 1.29 | 2.38 (0.002)* |
| 8 | Do you see the words move, jump, swim, or appear to float on the page when reading or doing close work? | 1030 | 1.45 ± 1.36 | 1.14 ± 1.31 | 2.95 (0.003)* |
| 9 | Do you feel like you read slowly? | 1017 | 2.37 ± 1.32 | 2.12 ± 1.41 | 2.36(0.002)* |
| 11 | Do your eyes ever feel sore when reading or doing close work? | 1022 | 2.17 ± 1.38 | 1.87 ± 1.36 | 2.73(0.001)* |
| 12 | Do you feel a “pulling” feeling around your eyes when reading or doing close work? | 1022 | 1.91 ± 1.33 | 1.60 ± 1.32 | 2.92 (0.004)* |
| 14 | Do you lose your place while reading or doing close work? | 935 | 1.92 ± 1.47 | 1.67 ± 1.40 | 2.06 (0.004)* |
| 15 | Do you have to re-read the same line of words when reading? | 2.67 ± 1.28 | 2.37 ± 1.31 | 2.79 (0.001)* | |
Associations between stereoacuity and specific symptoms Part 2.
| PART 2 Symptoms survey | |||||
|---|---|---|---|---|---|
| Symptoms | Reduced stereoacuity (≥ 60) | Normal stereoacuity (< 60) | t-test (p-value) | ||
| 18. | Do you see things as blurry (not clear) when you read or use the computer? | 1004 | 2.09 ± 1.37 | 1.78 ± 1.32 | 2.89 (0.004)* |
| 19. | Do you feel dizzy when you read? | 1020 | 2.13 ± 1.39 | 1.84 ± 1.39 | 2.59 (0.001)* |
| 21. | Do you have problems when you look on the chalkboard, back to your textbook, and back to the chalkboard again? | 1027 | 2.10 ± 1.45 | 1.77 ± 1.40 | 2.89 (0.004)* |
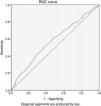
Bivariate logistic regression analysis showed that participants with reduced stereoacuity were 1.67 times more likely to be symptomatic compared to those with normal stereoacuity (OR = 1.67; p = 0.05; 95% CI: 1.027–2.774). To determine the validity of Randot stereoacuity test to distinguish between symptomatic and asymptomatic school children were examined using the sensitivity and specificity test. The maximum validity values of the CISS were: sensitivity was-90.26%, specificity 15.26%, PPV 19.60% and NPV 87.24%. The Receiver Operating Curve (ROC) (Fig. 7) values were: 0.57 (95% CI = 0.53–0.62, p = 0.001). These findings indicate that the accuracy of the Randot stereoacuity test (≥60 s arc) to distinguish between symptomatic and asymptomatic children is poor.
Discussion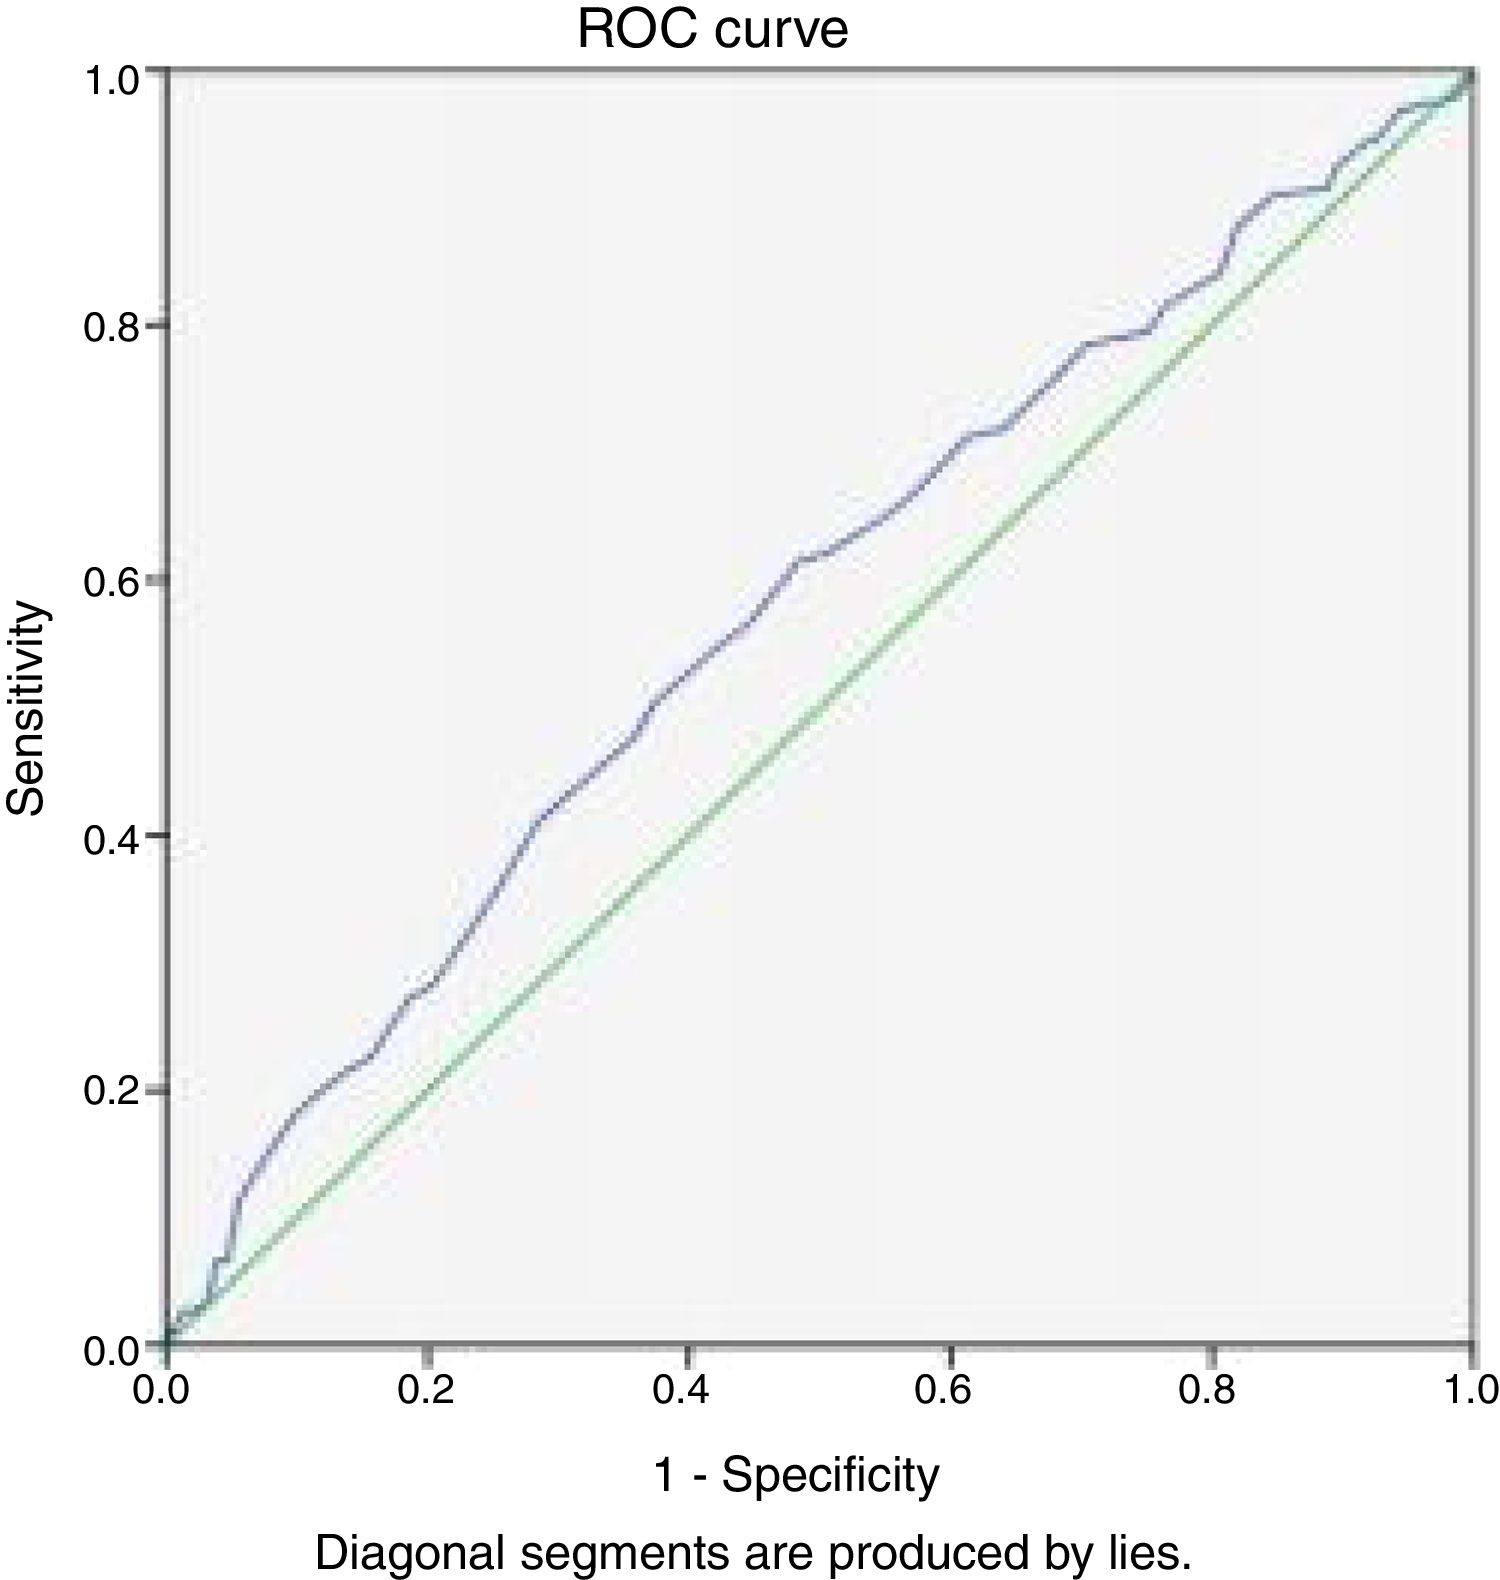
This study explored associations of stereoacuity with clinical measures and symptoms. Reduced stereoacuity and defective clinical measures were prevalent in this sample of high school students. Stereoacuities were worse in children with defects in clinical measures and in symptomatic than in asymptomatic children. The findings suggest that Randot stereoacuity test has a fair accuracy to distinguish between children with or without defective clinical measures of accommodative and vergence. However, it has a low accuracy to identify symptomatic children. This implies that in a clinical setting, reduced stereoacuities could signify reduced clinical measures.
Reduced stereoacuity: prevalence and associations with accommodative and vergence measuresThe prevalence of reduced stereoacuity varied across studies and are influenced by diverse study designs. The prevalence of reduced stereoacuity of 18.9% is higher than 16.8% reported by Ponsonby et al.14 who studied primary school children in Australia. Lack of studies on similar population as present study precludes extensive comparison of results. On the association between clinical measures and stereoacuity the participants with defective clinical measures of accommodation and vergence had significantly worse mean stereoacuities than those with good stereoacuity. Good stereoacuity requires clear retinal image and given the role of accommodation on stereopsis in adjusting focus for clear vision, blur caused by an accommodative error will disrupt the accommodative-convergence synergy and reduce the precision of stereopsis.20–25 With natural pupils, errors of 1 D and 2 D cause nearly two-and ten-fold reductions in stereoacuity, respectively.25 The significant association between reduced stereoacuities and the clinical measures of AI (amplitude, lag and facility) (Table 3) corroborate the reported association between AI and stereoacuity.16
In the literature, the relation of vergences to stereoacuity tends to be of more research interest than with accommodation.6–11 and this may be related to the fact that vergence functions seem to be more relevant to stereoacuity and thus may be more affected than by accommodative parameters. This is evident from the more reduced stereoacuities of convergence measures including the NPC & PFV (Table 3) Findings from earlier studies on the effect of convergence on stereoacuity varied though it seems unanimous from the studies that the role of convergence may mainly be mechanical. The anatomical design of the eyeball enables it to rotate freely therefore convergence sets the eyes in place to commence the process of minimizing disparity6–11 thus enhances the sense of depth.9
A significant correlation between esophoria and stereoacuity corroborates results from previous studies which found that even small degree of esophoria negatively impacted on stereoacuity more than did exophoria.26–27 Differences in stereo-functions between the esophores and exophores may be related to relative strengths of the separate slow vergence adaptation mechanisms3,27 given that exophores have slower convergence (take longer to reduce disparity error) compared to the same persons’ divergence movements.28 Studies30–32 which related stereoacuity to vergence measures were conducted by experimentally inducing vergences stress while stereoacuity was measured. Reduced stereoacuity is often associated with induction of prism.30–34 Biler et al.30 found that the introduction of base in and base out prism caused significant reduction in stereoacuity with reduced stereoacuity occurring at 20 pd for convergence and 13 or divergence. In the present study, reduction of stereoacuity was associated with a mean negative fusional vergence break of less than 12 prism dioptres and less than 16 positive fusional vergence break.
Remarkably, the mean stereoacuities for convergence measures are higher than for accommodative measures which indicates a stronger associations of stereoacuity with vergence than accommodation measures (Table 3). This finding further supports the idea that convergence function is more utilised in eye movement therefore may be prone to more stress than accommodative measures. Overall, the weak correlation among stereoacuity and clinical measures may be related to the low mean values from clinical measures and may be a characteristic of this population. From another perspective, Nicolson and Garzia,13 noted that reduced stereoacuity may not be related to clinical measures due to the nature of the stereoacuity testing where, unlike accommodative facility, stereoacuity testing lacks stimulus which could challenge the system during test. Stronger correlations between clinical measures and stereoacuity may be obtained after an intense near task.
In general, reduced stereoacuity from clinical measures may be related to breakdown in the accommodative-vergence synergy arising from performing near task. For a stimulus to be seen as fused rather than diplopic, the eyes must be converged to a distance close to the object distance. The Panums fusional area measures between 8−12 min of arc near the fovea.21 Beside the foveae, many retinal loci can produce fusion and this area increases towards the periphery.21 The tolerance range of Panum’s fusion area is approximately 15–30 min of arc.21,25 Therefore, vergence errors larger than 15–30 min of arc cause a breakdown in binocular fusion and stereopsis is thereby disrupted.25–35 The individual may develop adaptive changes which cause accommodative-vergence anomalies and those who adapt poorly manifest symptoms.36
Overall, the complex neuronal interactions between the oculomotor and sensory processes which act to reduce excessive retinal disparity suggest a strong link between depth perception and motor fusion.22,37 Thus, it could be argued that if the mechanism that controls fusion or the vergence mechanism is impaired, stereoacuity may also be impaired.37,38 Also, the high vergence effort used to control deviations could cause reduced stereoacuity, which also indicates the limits of practically useful vergence39 because the disparity magnitude exceeds its threshold value (that is, the Panum’s fusional area or tolerance for vergence error).40 Stereopsis occurs when retinal disparity is great enough to permit simple superimposition of the two retinal images, but not enough to elicit diplopia.1,41,42 Although smaller vergence errors may not cause fusion to break, a marked reduction in stereoacuity may be expected.25,35,37 It may thus be inferred that abnormal accommodative-vergence measures could affect stereoacuity, at least up to a critical level for fine stereopsis and greater level of association with vergences may be expected with coarse stereopsis.20,37 Coarse stereopsis is a low-resolution spatial frequency disparity range which plays a role in early development of coordinated binocular eye movements and permits the development of the first-order and high-resolution fine stereoscopic system.20,42
Even though sensory fusion is essential for the highest degree of stereopsis, lower degrees may occur in its absence and in some cases, could occur in heterotropia of less than 10 prism dioptres1,37,39 as well as, in microtropia.1,37,39 Coarse stereopsis is common among people who have normal fine stereoacuity and ocular alignment and in those who may not have binocular vision anomalies.41–43 Jones42 and Richards43 reported a relatively high proportion of individuals who had an adequate binocular vision and normal fine stereopsis but were found to manifest reduced or absent convergent or divergent eye movements with associated stereo anomaly for coarse stereopsis. Another mechanism of reduced stereoacuity under conditions of vergence stress include temporary anomalous retinal correspondence, which are small shifts in retinal correspondence that can occur without disrupting Panum’s fusional process.44
Stereoacuity and symptomsA high percentage (86%) of participants were symptomatic [mild: 41.29%, moderate: 32% and severe: 27%] which is higher than 47.5% reported by Ponsonby et al.14 who also used the CISS and the severity was not categorised. Given that CISS test was appropriately administered, several factors could be proposed for the high prevalence in the present study. The validation of the CISS in only the English language may create some challenges for non-native English speakers rural school children in this study. For example, it may be difficult to understand a distinction between some of the symptoms question options such as infrequently, sometimes and fairly often even when translated to their native isiZulu language. A study in India found that language affects the interpretation of the CISS and recommended the validations of the survey for other languages.45 Secondly, students may exaggerate symptoms in order to be given spectacles. Furthermore, high frequency of symptoms in the present study may also be related to the fact that cases of refractive errors were not excluded as was done in some studies.46–48 These studies46–48 found lower frequencies of symptoms which may have increased the prevalence compared to when refractive errors are excluded. It is also possible that high frequency of symptoms is peculiar with this population and this may require further investigation.
As in the present study, the findings of worse symptoms scores among children with worse stereocuities corroborate results from previous studies.5,14 Given the significant associations between binocular anomalies and symptoms16 and stereoacuity test being a measure of the presence of good binocularity,3,23 an association between reduced stereoacuity and symptoms may be expected and further studies may be needed to validate this.
Different cut-points yield different sensitivities and specificities hence it is difficult to compare sensitivities and specificities reported in different studies. Studies on the validity of stereoacuity to screen for symptoms could not be found. Thus, the present study provides baseline data towards further studies.
Summary, implications and applications of findingsSchool vision screening is often a good avenue to identify children who may be at risk for vision anomalies and with limited access to eye care and unable to afford the independent optometrist. Binocular anomalies predispose the student to develop symptoms as near point visual demands increases. Developing a quick and simple screening tool will enhance screening at every level. Findings from this study could guide subsequent studies towards validation of stereoacuities as a screening tool. The findings from this study showed that:
▪Participants with defective clinical measures had significantly worse stereoacuities than those with normal ranges.
▪Participants with reduced stereoacuity had significantly worse mean symptoms scores than asymptomatic although the weak correlation between stereocuity and symptoms limits interpretation and application.
▪The Randot Stereo test could be used as a screening tool to identify defects in clinical measures and those who may be symptomatic children.
Being a simple and easy-to-administer tool, the Randot stereoacuity test will be useful to researchers, school personnel and clinician as a screening tool.
Lack of cycloplegia is a limitation of this study although it was difficult to get parents and school authorities to permit the use of eye drops on their children. In addition, Laudon49 noted that the use of cycloplegia in studies on near vision anomalies may be unnecessary49 as the use of cycloplegia may disrupt the sequence of testing and school principals do not always allow interruptions of children’s classes. Despite the outlined limitations, the firm research design including large sample size, random sampling, one optometrist collected data are some strengths of the study. In addition, the data was analyzed by a statistician who is a non-eye care practitioner and is unaware of the criteria and terminologies used throughout the study. Consequently, the findings are valid and can be extrapolated to similar populations.
ConclusionReduced stereoacuity, defective clinical measures and symptoms of asthenopia are prevalent in sample of school children studied and those with defective clinical measures and those that are symptomatic are more likely to have reduced stereoacuity. In a screening setting, Randot Stereoacuity test could fairly identify defective clinical measures although the accuracy to identify between symptomatic and asymptomatic school children was poor. Findings highlight the need for a fast and reliable screening tool among school children. Further studies will be needed to validate present findings.
Conflicts of interestThe author has no proprietary interests or conflicts of interest related to this submission.
This submission has not been published anywhere previously and it is not simultaneously being considered by any other publication.
I am grateful to Prof Mark Rosenfield (SUNY College of Optometry New York, USA) and Dr Rekha Hansraj (University of KwaZulu–Natal South Africa) for reviewing some drafts of this manuscript. I also thank Prof Rosenfield for supplying me copies of the classic articles referenced.
The following are Supplementary data to this article:


