


To compare the retinal sensitivity and evaluate its contribution to the foveal sensitivity in patients with and without diabetes who maintain normal visual acuity.
MethodsObservational, descriptive, cross-sectional and prospective study in 20 subjects without diabetes (group 1) and 23 with type 2 diabetes mellitus (group 2) that had no ocular abnormalities. Retinal sensitivity was measured with the macular threshold test by the Humphrey's computerized perimeter. The mean sensitivity in each of the 16 points and the foveal sensitivity were compared between groups using the Mann–Whitney's U test; the correlation between retinal sensitivity and foveal sensitivity was analyzed by the Spearman's test and the contribution of each point to the foveal sensitivity was identified by multiple regression.
ResultsSixty eyes were evaluated, 30 in group 1 and 30 in group 2; the mean foveal sensitivity was 34.77±0.5dB in group 1 and 32.87±0.6 in group 2. The highest sensitivity of the temporal visual field had an inferior paracentral location (point 3) in both groups. In the linear regression analysis, points which contributed to the foveal sensitivity were 1 in group 1 and points 7 and 15 in group 2.
ConclusionsSubjects without diabetes have a significantly higher sensitivity in the temporal retina compared with those with diabetes; points with highest mean retinal sensitivity do not correspond to the central four. The reduced sensitivity in point 1 decreases the mean foveal sensitivity in subjects with diabetes, because this variable correlates with lower perimetry points.
Comparar la sensibilidad de la retina y evaluar su contribución a la sensibilidad de la fóvea en pacientes con y sin diabetes con agudeza visual normal.
MétodosEstudio observacional, descriptivo, transversal y prospectivo en 20 sujetos no diabéticos (grupo 1) y 23 con diabetes mellitus tipo 2 (grupo 2) sin anomalías oculares. La sensibilidad de la retina se midió mediante la prueba de cuantificación del umbral macular realizada con campimetría computarizada Humphrey. La sensibilidad media en cada uno de los 16 puntos y la sensibilidad de la fóvea se compararon entre grupos mediante la prueba U de Mann Whitney; la correlación entre la sensibilidad de la retina y la sensibilidad de la fóvea se analizó mediante la prueba de Spearman, y la contribución de cada punto a la sensibilidad de la fóvea se identificó mediante regresión múltiple.
ResultadosSe evaluaron sesenta ojos: 30 en el grupo 1, y 30 en el grupo 2; la media de la sensibilidad de la fóvea fue de 34,77±0,5dB en el grupo 1, y de 32,87±0,6 en el grupo 2. La mayor sensibilidad del campo visual temporal tuvo una localización paracentral inferior (punto 3) en ambos grupos. En el análisis de regresión lineal, los puntos que contribuyeron a la sensibilidad de la fóvea fueron el punto 1 en el grupo 1, y los puntos 7 y 15 en el grupo 2.
ConclusionesLos sujetos no diabéticos tienen una sensibilidad significativamente mayor en la retina temporal en comparación a los sujetos diabéticos; los puntos con mayor sensibilidad media de la retina no corresponden a los cuatro centrales. La sensibilidad reducida en el punto 1 disminuye la sensibilidad de la fóvea en sujetos diabéticos, ya que esta variable guarda relación con los puntos perimétricos inferiores.
Visual acuity is considered the gold standard for measuring visual function,1 but assessing this entirely requires other ancillary tests, such as measuring retinal sensitivity (RS).
RS is the ability to distinguish a stimulus light from background illumination2; it is measured with a threshold perimetry test that evaluates 20° and 30° central vision,3 which is effective to detect reductions of the visual field in diseases such as glaucoma and other optic neuropathies.4
The most sensitive area of the retina is the macular center, known as the fovea; diseases of this structure cause a localized reduction of RS, which is detectable by threshold tests of 6° and 10°.5,6 The central macular threshold of 6° evaluates the fovea and the sixteen points around it; results are measured in decibels (dB) and allow to quantify the overall function of the macula.7
It has been reported that RS may decrease in systemic diseases such as type 2 diabetes mellitus, even when there is no clinical evidence of diabetic retinopathy.8 This could be due to factors such as reactive oxygen species and angiotensin II, which alter the transmission of the electrical signals of photoreceptors to the central nervous system.9
The sensitivity at the level of the fovea is called foveal sensitivity; its mean in diabetics with focal macular edema without involvement of the foveal center is 29.84±4.48dB.10 In order to estimate the degree of dysfunction that this represents, it is necessary to know the values of foveal sensitivity (and adjacent regions) in subjects with diabetes without retinopathy and in subjects without it, that has not been reported in our population.
Diabetes may affect the function of any region of the macula and reduce foveal sensitivity, even if there is no retinopathy or vision loss; limiting retinal damage in eyes without retinopathy with normal visual acuity, requires identifying the correlation between sensitivity in regions adjacent to the fovea and foveal sensitivity, which has not been described to our knowledge.
A study was performed to compare retinal sensitivity measured by macular threshold test, in subjects with diabetes who had no retinopathy and subjects without diabetes, with normal visual acuity. Additionally, the contribution of the macular perimetry points to the changes of foveal sensitivity was analyzed in subjects without diabetes, and was compared with the contribution in subjects with diabetes.
MethodsAn observational, descriptive, cross-sectional and prospective study in subjects without diabetes and subjects with type 2 diabetes mellitus, who had no ocular abnormalities, was conducted. The target population was subjects of Mexico City and its metropolitan area; the accessible population was subjects who attended a general hospital. A time determined, non-randomized sequential sampling was performed, which included 20 subjects without diabetes that were age-matched with 23 subjects with type 2 diabetes; the study was conducted from June 15th to 30th 2015, and was approved by the Institutional Review Board of the hospital where it was conducted.
Subjects of any gender aged between 40 and 70 years, with corrected visual acuity under subjective refraction equal to 20/20, with stable fixation and who did not have ocular media opacities were included; those who were under evaluation for presumptive diagnosis of diabetes and those who had a history of refractive surgery or cataract, or posterior segment ocular disease, were excluded. Subjects whose macular perimetry had low reliability were eliminated; subjects without diabetes were assigned to group 1 and those with diabetes were assigned to group 2.
The outcome variable was the retinal sensitivity, operationally defined as the ability to distinguish a stimulus light from background illumination, measured by achromatic macular threshold test of 6° (white on white size 3 stimulus), of the Humphrey's computerized perimetry equipment (HFA 750i, Carl Zeiss, Meditec, Dublin, CA). The device automatically determined the foveal sensitivity at 16 points around the fovea in decibels (dB); all macular threshold tests were performed by a single researcher.
The test was considered reliable when fixation losses were fewer than 20% (2.4); for descriptive purposes, each perimetry point was identified as shown in Fig. 1. The mean sensitivity in each of 16 the points and the foveal sensitivity were measured in both groups; Kolmogorov–Smirnov test was used to determine whether the distribution of the variables was normal.

The mean sensitivity at each point and the foveal sensitivity were compared between groups by Mann–Whitney's U test; to find the dependence of the foveal sensitivity with each of the 16 points, a Spearman's test was used in each group. Additionally, to identify the perimetry points that contributed to modify the foveal sensitivity, a multiple regression analysis was performed in each group.
A p value <0.05 was considered significant; the information was stored and analyzed with IBM SPSS software version 22, for Windows.
ResultsSixty eyes of 43 subjects, aged 42–72 years (mean, 53.1±S.E. 0.96) were evaluated; 44 eyes were from females (73.3%). The test duration was 4.42 to 6.03min (mean 5.04±0.07), the mean of fixation losses was 0.4±0.09, which means that the tests were reliable.
Thirty eyes of 20 subjects without diabetes were assigned to group 1 (Table 1); their age was 42–71 years (mean 51.6±1.3). Twenty eyes were from females (73.3%), foveal sensitivity was 27–39dB (mean 34.77±0.5).
Baseline characteristics per group.
| Variables | Group 1 | Group 2 |
|---|---|---|
| Number of subjects | 20 | 23 |
| Number of eyes | 30 | 30 |
| Gender | ||
| Female/Male | 22/8 | 22/11 |
| Foveal sensitivitya | 34.77±0.5 | 32.87±0.6 |
The points with highest sensitivity means (1, 4, and 15) were in the nasal visual field, which represents the activity of the temporal retina; point 3 had the highest mean sensitivity in the temporal visual field. The central points had higher sensitivity means only in the nasal visual field; the highest sensitivity of the temporal visual field was located in an inferior paracentral point.
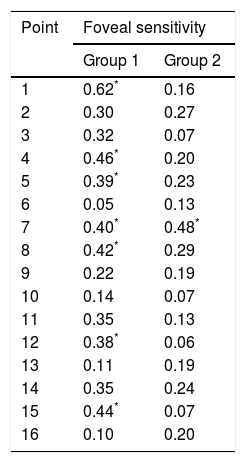
Bivariate correlations between foveal sensitivity and the 16 perimetry points in this group are shown in Table 2. The multiple regression analysis found that only point 1 contributed to the foveal sensitivity was (Beta=0.58).
Correlation coefficients between retinal sensitivity and foveal sensitivity, in subjects without and with diabetes.
| Point | Foveal sensitivity | |
|---|---|---|
| Group 1 | Group 2 | |
| 1 | 0.62* | 0.16 |
| 2 | 0.30 | 0.27 |
| 3 | 0.32 | 0.07 |
| 4 | 0.46* | 0.20 |
| 5 | 0.39* | 0.23 |
| 6 | 0.05 | 0.13 |
| 7 | 0.40* | 0.48* |
| 8 | 0.42* | 0.29 |
| 9 | 0.22 | 0.19 |
| 10 | 0.14 | 0.07 |
| 11 | 0.35 | 0.13 |
| 12 | 0.38* | 0.06 |
| 13 | 0.11 | 0.19 |
| 14 | 0.35 | 0.24 |
| 15 | 0.44* | 0.07 |
| 16 | 0.10 | 0.20 |
Spearman's rho test.
In group 2, 30 eyes of 23 subjects with diabetes without retinopathy were evaluated, aged 43–72 years (mean 54.7±1.3); 22 eyes were from females (73.3%). Foveal sensitivity was 26–38dB (mean 32.87±0.6).
Points 7, 4 and 1 in the nasal field had the highest sensitivity means; point 3 had the highest sensitivity mean in the temporal visual field. Point 17, which corresponds to the foveal sensitivity, had a higher mean than the other surrounding points.
The means of sensitivity in points with statistical difference between groups are shown in Fig. 2; correlations between perimetry points and foveal sensitivity are presented in Table 2. Multiple regression analysis identified that the points that contributed to the foveal sensitivity were 7 and 15 (Beta=0.48).

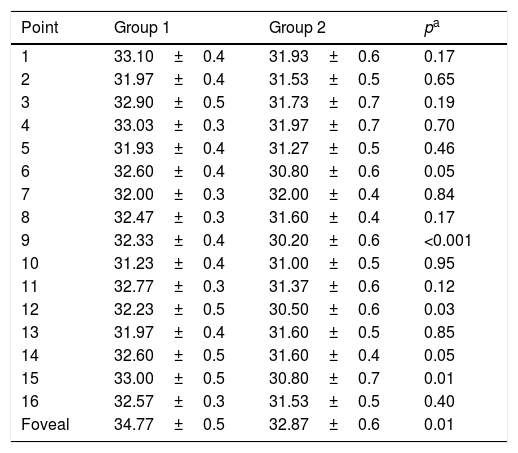
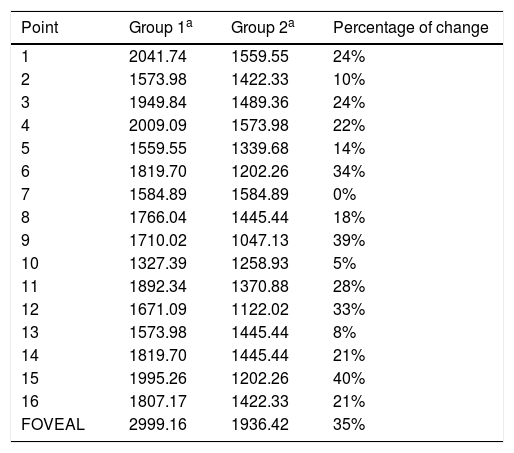
Mean sensitivity of points 6, 9, 12 and 15 was higher in group 1 than in group 2 (Table 3). Although mean sensitivity in most points of group 2 showed a significant reduction in decibels compared to group 1, this represented a percentage increment in the level of luminance (apostilbs [Asb]) required to identify the stimulus. This value corresponded to 35% for the foveal sensitivity; point 15 had the highest percentage increment in value between groups (40%), and point 7 did not show changes (Table 4).
Comparison of macular retinal sensitivity means between groups.
| Point | Group 1 | Group 2 | pa |
|---|---|---|---|
| 1 | 33.10±0.4 | 31.93±0.6 | 0.17 |
| 2 | 31.97±0.4 | 31.53±0.5 | 0.65 |
| 3 | 32.90±0.5 | 31.73±0.7 | 0.19 |
| 4 | 33.03±0.3 | 31.97±0.7 | 0.70 |
| 5 | 31.93±0.4 | 31.27±0.5 | 0.46 |
| 6 | 32.60±0.4 | 30.80±0.6 | 0.05 |
| 7 | 32.00±0.3 | 32.00±0.4 | 0.84 |
| 8 | 32.47±0.3 | 31.60±0.4 | 0.17 |
| 9 | 32.33±0.4 | 30.20±0.6 | <0.001 |
| 10 | 31.23±0.4 | 31.00±0.5 | 0.95 |
| 11 | 32.77±0.3 | 31.37±0.6 | 0.12 |
| 12 | 32.23±0.5 | 30.50±0.6 | 0.03 |
| 13 | 31.97±0.4 | 31.60±0.5 | 0.85 |
| 14 | 32.60±0.5 | 31.60±0.4 | 0.05 |
| 15 | 33.00±0.5 | 30.80±0.7 | 0.01 |
| 16 | 32.57±0.3 | 31.53±0.5 | 0.40 |
| Foveal | 34.77±0.5 | 32.87±0.6 | 0.01 |
Percentages of change per point in terms of the level of luminance (in Asb.) required to identify the stimulus.
| Point | Group 1a | Group 2a | Percentage of change |
|---|---|---|---|
| 1 | 2041.74 | 1559.55 | 24% |
| 2 | 1573.98 | 1422.33 | 10% |
| 3 | 1949.84 | 1489.36 | 24% |
| 4 | 2009.09 | 1573.98 | 22% |
| 5 | 1559.55 | 1339.68 | 14% |
| 6 | 1819.70 | 1202.26 | 34% |
| 7 | 1584.89 | 1584.89 | 0% |
| 8 | 1766.04 | 1445.44 | 18% |
| 9 | 1710.02 | 1047.13 | 39% |
| 10 | 1327.39 | 1258.93 | 5% |
| 11 | 1892.34 | 1370.88 | 28% |
| 12 | 1671.09 | 1122.02 | 33% |
| 13 | 1573.98 | 1445.44 | 8% |
| 14 | 1819.70 | 1445.44 | 21% |
| 15 | 1995.26 | 1202.26 | 40% |
| 16 | 1807.17 | 1422.33 | 21% |
| FOVEAL | 2999.16 | 1936.42 | 35% |
Points 9, 6 and 12 corresponding to the paracentral macular area, required the highest values of percentage increment after foveal sensitivity; points 13 and 10 corresponding to temporal visual field, which represents the function of the nasal retina had the lowest percentage of change.
Although points 1, 4, 7, 8 and 15 had a correlation ≥0.4 with the foveal sensitivity in group 1, only the first contributed at the regression model; in group 2, three of these five points had a correlation <0.3, and point 1 lost its contribution at the regression model. In this group, point 7 contributed to the model, and its correlation with foveal sensitivity increased from 0.40 to 0.48; point 15 had one of the lowest correlations.
Anatomically, the temporal area of the retina (which corresponds to the nasal visual field), had the highest contribution to the foveal sensitivity in both groups. In subjects without diabetes, the point that contributed to the foveal sensitivity had a central localization; the sensitivity of the central points in patients with diabetes was decreased, therefore, the largest contribution to the foveal sensitivity was provided by paracentral points.
DiscussionThe main findings in this work show a loss of retinal sensitivity in the nasal area (which represents temporal retina), in subjects with diabetes without retinopathy compared with those without it, of the same age and visual acuity (20/20). Foveal sensitivity in subjects without diabetes had a significant correlation with the sensitivity at point 1, which is located in the central superior nasal hemi-field; mean sensitivity in the remaining points did not contribute to modify foveal sensitivity. In subjects with diabetes, foveal and point 1 sensitivities decreased and lost their correlation; the mean luminance required by subjects with diabetes at the fovea was 35% higher than that in subjects without it.
The luminance unit used in biological models, is the Asb; in group 2 of this study, a higher Asb value was required than in group 1, to distinguish a stimulus light from background illumination.2
Retinal sensitivity is measured in decibels, an attenuation scale that represents a relation between two measurements; in the perimetry, these correspond to the background illumination of the equipment and the one required for detecting a light stimulus of a higher intensity, according to the functional condition of the retina. Sensitivity is measured as a function of the maximum attenuation of the light stimulus provided by the equipment; therefore, an eye with better function can identify a more attenuated stimulus and has a higher dB value.
Since the decibel scale is logarithmic, its variations at different levels do not represent the same absolute value; however, a 3dB change is equivalent to 50% of the baseline value.11 Foveal sensitivity mean decreased from 34.77 in eyes of subjects without diabetes to 32.87 in eyes of subjects with diabetes without retinopathy; besides, in the last group mean foveal sensitivity only correlated with lower sensitivity points.
In this study, the macular threshold test revealed that mean retinal sensitivity was higher than the reported, both at the fovea and at the 16 points around it, in eyes with normal visual acuity a stable central fixation; these results had not been characterized in our population. The studies that have used perimetry to evaluate macular diseases based their comparisons on global sensitivity measurements and its variations between strategies,12–15 but they have not reported results with macular threshold tests for each of the points.
The perimetry threshold tests have been used to evaluate the functional condition of the central and peripheral vision in diverse optic neuropathies. The 24-2 achromatic (white-on-white) or dichromatic (blue-on-yellow) threshold tests are used in glaucoma,12 and have also been used to evaluate retinal function in diseases like diabetic retinopathy. Cabezos et al., reported that global retinal sensitivity, measured by multichannel perimetry with an achromatic stimulus, was significantly reduced in diseases such as diabetes and glaucoma.16
Bengtsson et al.,17 identified using a regression model that achromatic perimetry was a more useful tool to detect visual function loss caused by macular damage, than the blue-on-yellow perimetry. In that study, they used the 10-2 and 24-2 threshold tests; the evaluation of central function in the last is restricted because it does not measure the points around the fovea.
Sepah et al.,18 analyzed the relation between sensitivity and macular thickness in healthy eyes and in eyes with macular edema caused by uveitis, using a 28-point microperimetry, with a size-III stimulus; they demonstrated that 100% of the eyes had stable central fixation, and that mean macular sensitivity in healthy eyes was 16.48±2.06dB. Sampson et al. in 2012,19 also using microperimetry, identified a mean global retinal sensitivity of 22.15dB, in eyes of subjects with diabetes without optic neuropathies; the mean sensitivity in a 10° circle was 24.27dB.
Previously reported sensitivity means are lower than those found in this study, because the level of background illumination of the microperimeter modifies the dB scale. The macular threshold test measures sensitivity in four-central points localized at 1° from the fixation point and in 12 points around them, localized at 3°; in this study, the evaluation identified that the points 1, 4, 15 and 3 had the highest means of sensitivity in group 1.
The four points with the highest sensitivity did not include point 2 of the central-temporal area; sensitivity was higher in the inferior-nasal field, which indicates a better function of the temporal retina.20 Although it was expected that the four-central points had higher sensitivity, the distribution in our sample was different; this finding could indicate topographic differences of macular function, which will require further evaluation.
Retinal sensitivity may decrease in diseases that affect the central-temporal area of the macula and involve point 1, which has the highest contribution to explain foveal sensitivity in subjects without diabetes; when the nasal side of the macula is affected, the impact on visual function could be lower, because the temporal-central area has the highest sensitivity in healthy eyes. On the other hand, Hombrebueno et al. reported that diabetes can damage the synapses at the outer plexiform layer, mainly between photoreceptors and bipolar cells; this effect was attributed to hyperglycemic toxicity and oxidative damage of bipolar or horizontal cells.21 Furthermore, the activation22 and increased expression23 of the angiotensin II AT1 receptors promotes retinal neural damage in diabetes, particularly to ganglion cells. The earliest microvascular complications in diabetic retinopathy such as microaneurysms, are mainly located in the temporal macula24; this also could explain a reduced RS and visual acuity in this cases, where only the nasal side will be playing a compensatory role.
The four central points in the macular threshold test evaluate a region outside the foveal avascular zone and the maximum resolution area (which is before 1° of the visual field)2; in diseases such as macular edema that affects the central point of the macula, sensitivity may decrease at the fovea but not at the four central points. Treatment in these eyes should aim at improving the function of the central area, besides treating retinal thickening; reducing retinal thickness alone would allow the eye to reach the maximum residual function, which does not necessarily correspond to the maximum visual acuity area.
One of the strengths of this study was the complete evaluation of the 6° in the macular area that allows representing the macular function; in contrast, a potential limitation was that we did not explore the whole macular area with the same distribution of points at 10°, which could have been useful to compare this function in the temporal perifoveal zone.
In order to evaluate foveal function before the central 3°, sensitivity could be analyzed with the 10-2 threshold test, which has a measurement at 2°; that test would complete the results of the study, because it would allow estimating a gradient of sensitivity change at the fovea.
ConclusionsRetinal sensitivity in the nasal visual field and foveal sensitivity were lower in subjects with diabetes than in subjects without it; point 1 significantly contributed to foveal sensitivity in subjects without diabetes, and this effect disappeared in subjects with diabetes, where foveal sensitivity correlated with points of lower sensitivity.
Conflicts of interestThe authors have no conflicts of interest to declare.


