

Videokeratoscopy images can be used for the non-invasive assessment of the tear film. In this work the applicability of an image processing technique, textural-analysis, for the assessment of the tear film in Placido disc images has been investigated.
MethodsIn the presence of tear film thinning/break-up, the reflected pattern from the videokeratoscope is disturbed in the region of tear film disruption. Thus, the Placido pattern carries information about the stability of the underlying tear film. By characterizing the pattern regularity, the tear film quality can be inferred. In this paper, a textural features approach is used to process the Placido images. This method provides a set of texture features from which an estimate of the tear film quality can be obtained. The method is tested for the detection of dry eye in a retrospective dataset from 34 subjects (22-normal and 12-dry eye), with measurements taken under suppressed blinking conditions.
ResultsTo assess the capability of each texture-feature to discriminate dry eye from normal subjects, the receiver operating curve (ROC) was calculated and the area under the curve (AUC), specificity and sensitivity extracted. For the different features examined, the AUC value ranged from 0.77 to 0.82, while the sensitivity typically showed values above 0.9 and the specificity showed values around 0.6. Overall, the estimated ROCs indicate that the proposed technique provides good discrimination performance.
ConclusionsTexture analysis of videokeratoscopy images is applicable to study tear film anomalies in dry eye subjects. The proposed technique appears to have demonstrated its clinical relevance and utility.
Pueden utilizarse las imágenes del videoqueratoscopio para la evaluación no invasiva de la película lagrimal. En este trabajo se ha investigado la capacidad de aplicación de una técnica de procesamiento de imágenes, análisis de la textura, para evaluar la película lagrimal en las imágenes del disco de Placido.
MétodosEn presencia del adelgazamiento/rotura de la película lagrimal, el patrón reflejado por el videoqueratoscopio se altera en la región de la alteración de la película lagrimal. Por ello, el patrón de Placido aporta información acerca de la estabilidad de la película lagrimal subyacente. Al caracterizar la regularidad del patrón, puede inferirse la calidad de la película lagrimal. En este trabajo se utiliza la evaluación de las características de la textura para procesar las imágenes del disco de Placido. Este método aporta un conjunto de características de textura, a partir del cual puede obtenerse una estimación de la calidad de la película lagrimal. El método se probó para detectar el ojo seco en una base de datos retrospectiva que incluía a 34 pacientes (22 normales, y 12 con ojo seco), realizándose las mediciones suprimiendo el parpadeo.
ResultadosPara evaluar la capacidad de cada parámetro de textura para discriminar entre el ojo seco y los pacientes normales, se calculó la curva operativa del receptor (ROC), extrayéndose el área bajo la curva (AUC), la especificidad y la sensibilidad. Para las diferentes características examinadas, el valor del AUC osciló entre 0,77 y 0,82, mientras que la sensibilidad mostró normalmente valores superiores a 0,9, y la especificidad reflejó unos valores cercanos a 0,6. Generalmente, las ROC estimadas indican que la técnica propuesta aporta un buen rendimiento discriminatorio.
ConclusionesEl análisis de la textura mediante la imagen del videoqueratoscopio es aplicable al estudio de anomalías de la película lagrimal en pacientes con ojo seco. La técnica propuesta parece haber demostrado su relevancia y utilidad clínicas.
Assessing the quality and stability of the pre-corneal tear film is a common clinical task that is important for assessing suitability for contact lens wear, refractive surgery and in the detection and monitoring of dry eye disease.1 Traditional clinical techniques to assess the tear film typically rely upon invasive and/or subjective methods like the fluorescein tear break-up time test to assess the integrity of the tear film. This commonly used technique has the disadvantage that the instillation of dye may alter the natural tear film composition.2 Thus, the development of reliable non-invasive, objective methods of tear film assessment is crucial for improved diagnosis and clinical monitoring of tear film disorders.
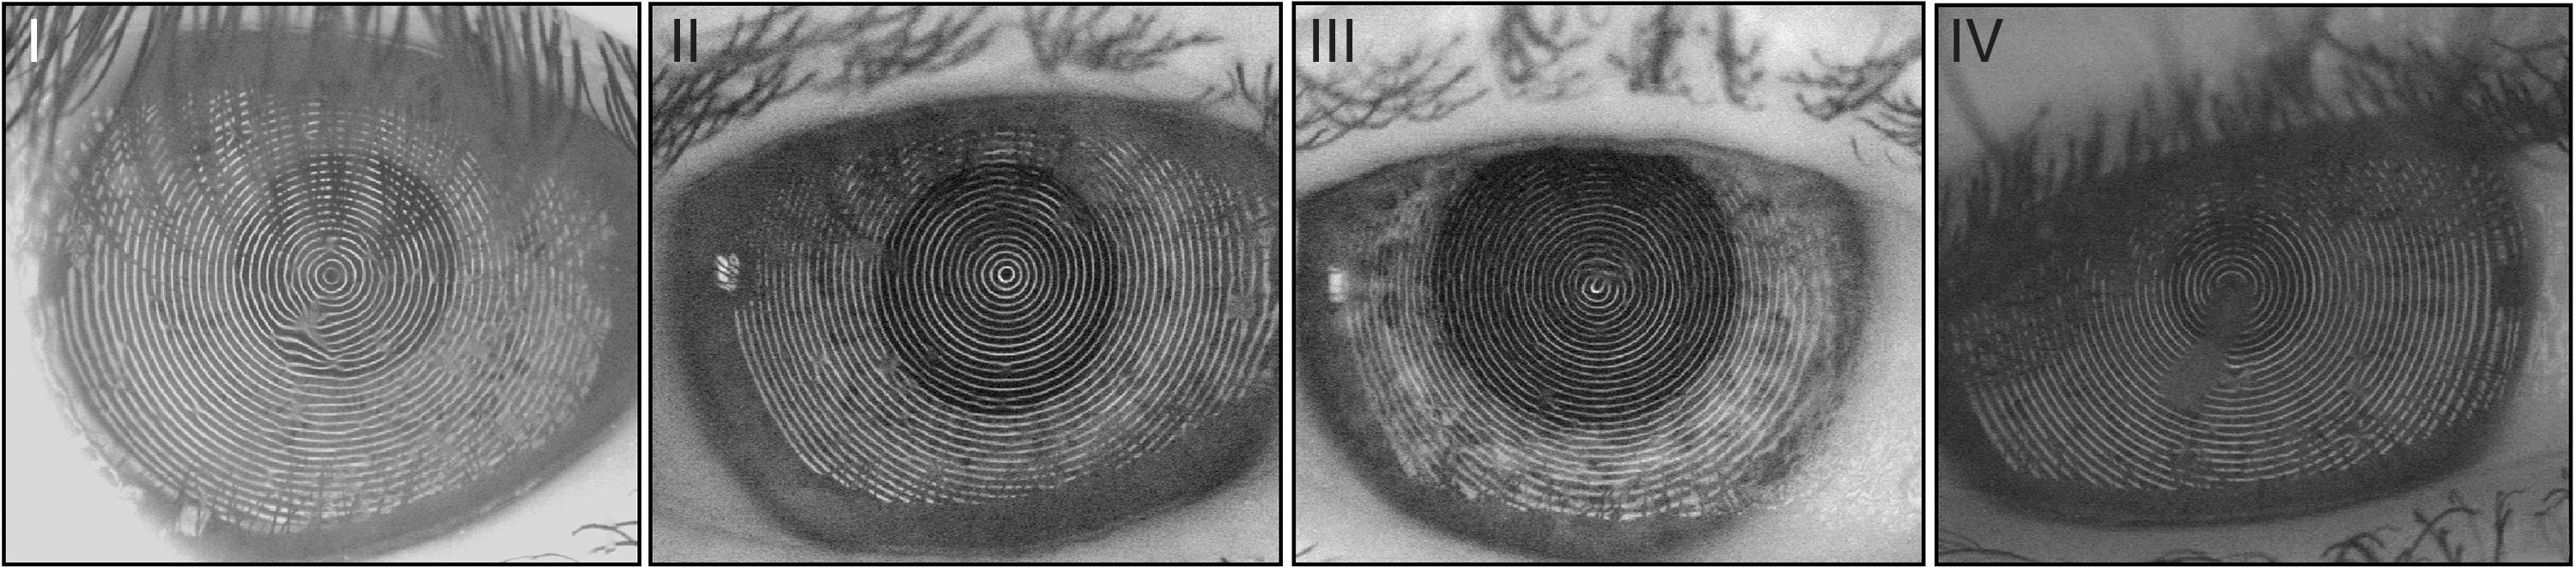
One of the objective, non-invasive techniques for tear film assessment is the dynamic videokeratoscopy technique, which analyses a continuous recording of images from a Placido disc corneal topographer, and provides dynamic information regarding changes in the tear film. Early work with this technique used the changes in the estimated topography data derived from the instrument to assess the tear film.3,4 However, as demonstrated by Alonso-Caneiro et al.5, the actual topography data may no longer be calculable or accurate under tear film thinning or break-ups. Thus, methods for assessing the tear film surface based on the raw Placido disc images rather than topography have been proposed.6,7 The tear film layer is known to act like a mirror and reflects the projected Placido disc ring pattern. Thus, a healthy and regular tear film surface forms a well-structured reflected pattern, while a tear film that is thinning, irregular or breaking up forms a non-structured reflected pattern. From now on and following engineering terminology, we will refer to the well-structured pattern as the signal, and the unstructured pattern as the interference. A set of exemplary videokeratoscopy images with different kinds of interference is shown in Fig. 1.
. Note that the areas in the image containing shadows from the eyelashes are not considered in this study. These example images I–IV are used to examine aspects of the performance of the proposed image processing technique.")
A set of 4 representative videokeratoscopy images with tear film-related interference (irregular patterns-due to tear thinning and break-ups). Note that the areas in the image containing shadows from the eyelashes are not considered in this study. These example images I–IV are used to examine aspects of the performance of the proposed image processing technique.
In previous studies, measurements of pattern coherence8 (a metric describing the consistency or regularity of the local orientation of the image) have been used to quantify the reflected pattern,6 from which the tear film behaviour was inferred. The coherence measurement has shown promising clinical results for the classification of patient symptoms9 and the quantification of tear film surface quality over time.6 However, a more sensitive indicator is still required for cases in which the tear film is of poor quality. For those cases, common in dry eye patients and contact lens wearers,10 the reflected pattern loses much of its orientation and becomes less structured. Thus, there is a need to identify techniques that provide a more detailed quantification of the underlying behaviour of the tear film surface.
Several methods of image processing have been proposed for the analysis and characterization of unstructured image patterns (such as the ones seen under suboptimal tear film conditions),11 including fractal dimension, run-length encoding, discrete wavelet transform, and co-occurrence matrices. Of those mentioned, texture analysis based on co-occurrence matrices is one of the most commonly used to analyze and interpret images. Texture analysis is a tool which provides a set of parameters to measure the variation of the intensity of a surface and to quantify image properties such as smoothness, coarseness, and regularity. In this paper, the capability of using the second-order texture statistics12 to classify interference patterns in videokeratoscopy images was investigated. In this way, by setting the co-occurrence matrix to maximize the likelihood of separation between the signal and the interference, it is expected to extract key features that may more comprehensively characterize an unstructured pattern. Thus, the ultimate goal of the proposed set of image processing techniques is to quantify the Placido disc regularity, in order to provide a more detailed assessment of the tear film than provided by currently available techniques.
MethodologyData collection and preliminary analysisRetrospective data from a study of the tear film using high-speed videokeratoscopy, captured at 25 frames per second, were used.13 The study cohort involved 22 subjects with normal tear film and 12 subjects diagnosed with dry eye syndrome. Only the right eyes of the subjects were measured. Dry eye was diagnosed if the subject exhibited all three of the following characteristics of dry eye; significant subjective dry eye symptoms (McMonnies test score, >14), objective signs of tear film instability (FTBUT, <10s), and surface staining (corneal and/or conjunctiva stain score, >3 (National Eye Institute grading scale14)). Further details on the study can be found in Ref. 13.
For the initial phase of this study, a number of representative images and videos were manually selected from the whole data set (Fig. 1), and analyzed to obtain the best parameter selection for the proposed method. Thus, these data derived from the images in Fig. 1 are used to test the proposed method, while in the second phase of the study, the whole data set which contained measurements from 22 normal and 12 dry eye subjects was used to evaluate the performance of the proposed technique in assessing tear film surface quality.
The videokeratoscopic grey scale intensity digital image forms a 2D matrix I[n,m], with n=1, 2,…,N and m=1, 2,…,M. In the videokeratoscope used for this study, Medmont E300 (Melbourne, Australia), the matrix is N=648 by M=572 pixels. Before the calculation of the Grey Level Co-occurrence Matrix (GLCM), an area of analysis is manually selected. This area contains the maximum rectangular area of the image that is not affected by the shadows from eyelashes. To extract this region, which avoids the undesirable effect from eyelashes, a methodology that has previously been presented in detail6 was used. The key focus of this paper is the separation between tear film related interferences and the signal. The selected area is further divided into non-overlapping blocks of equal size. The block size is optimized so it contains a significant amount of information without reducing the spatial resolution when locating the potential interference. In our case, the image was divided into square blocks of 25×25 pixels. Given that the maximum width of a ring is approximately 8.78 pixels,15 a 25×25 pixel block is sufficient to encompass a significant amount of information (at least two rings) and to keep sufficiently high spatial resolution.
A videokeratoscopy image is composed of two elements: the background (the anterior eye – iris and pupil) and the foreground (the reflected pattern of the Placido disc rings). The background does not provide any essential information for the analysis of the pattern. For that reason it is important to remove it from the image to avoid misleading information in further processing. This can be achieved with statistical block normalization, in which the intensity information is normalized to zero mean and unit variance.15
GLCM parameter selectionThe Grey Level Co-occurrence Matrix (GLCM), proposed by Haralick et al.,12pθ(d), for an image is the joint conditional probability density function (a two dimensional histogram), p(i,j|φ(d,θ)); where φ(d,θ) is a vector of length d and angle θ measured from an element in the image. The joint conditional probability density function represents the probability of finding grey levels, i and j, at the base and termination points of the vector φ(d,θ) for any pixel within the image.
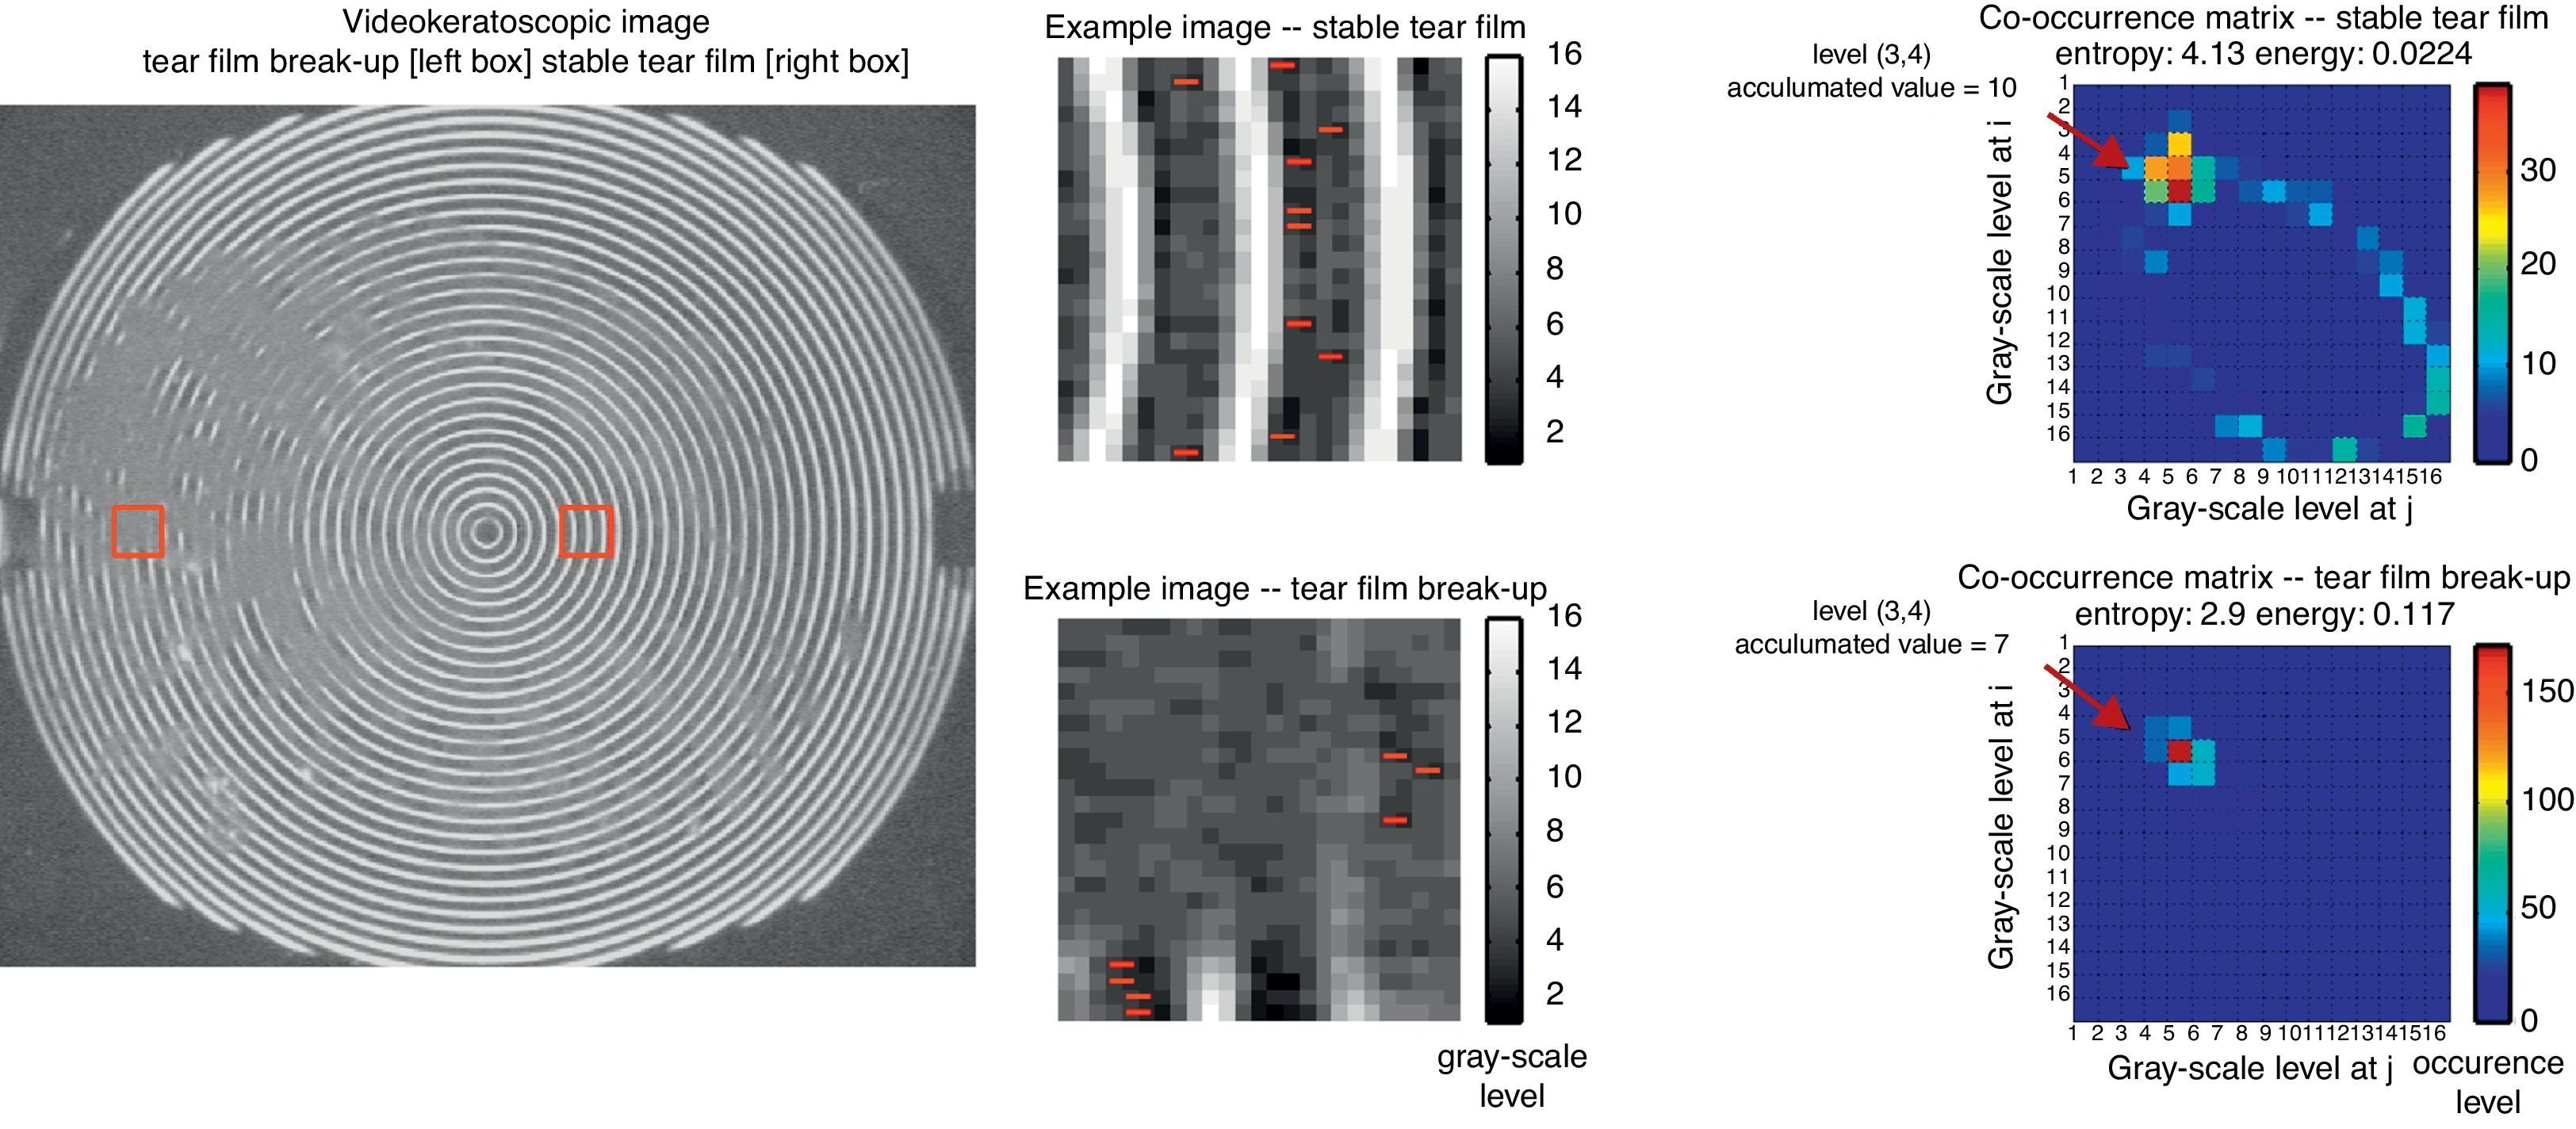
Fig. 2 shows an example of the GLCM (for d=1 and θ=0). Therefore, in this example the GLCM calculates how often a pixel with grey-level (grey-scale intensity) value i occurs horizontally adjacent to a pixel with the value j. In Fig. 2, two different sections from a videokeratoscope image are presented: an optimal (top) and sub-optimal (bottom) reflected pattern. As an example, the occurrence values at grey level (3,4) (i.e., grey level 3 at the start of the vector and 4 at the end) are shown in the images (with red lines) and its corresponding occurrence/cumulative GLCM value. The high occurrence level around the (5,5) grey level corresponds to the background. In general, for the optimally reflected pattern, extra information can be seen in the GLCM. From these GLCMs a set of texture statistical descriptors can be extracted which represent global measures of the data. Two representative features are presented here as an example. The Entropy (measures the randomness of the distribution) and the Energy (measurement of the texture uniformity, the opposite of entropy) are provided in Fig. 2 (right side), and as expected based upon the definitions of these metrics, both values behave in opposing ways in these two examples. The rest of the set of texture features used in this study are described in detail in Table 1.
 from a videokeratoscopic image (left) with their corresponding co-occurrence matrices (right). The top subplots represent an example with optimal reflection conditions (good tear film) while the bottom subplots represent suboptimal reflection conditions (poor tear film). The red lines in the central block image illustrate the pixels in each of the block images with occurrence values of grey level equal to (3,4) (see text for details).")
Two representative blocks (centre) from a videokeratoscopic image (left) with their corresponding co-occurrence matrices (right). The top subplots represent an example with optimal reflection conditions (good tear film) while the bottom subplots represent suboptimal reflection conditions (poor tear film). The red lines in the central block image illustrate the pixels in each of the block images with occurrence values of grey level equal to (3,4) (see text for details).
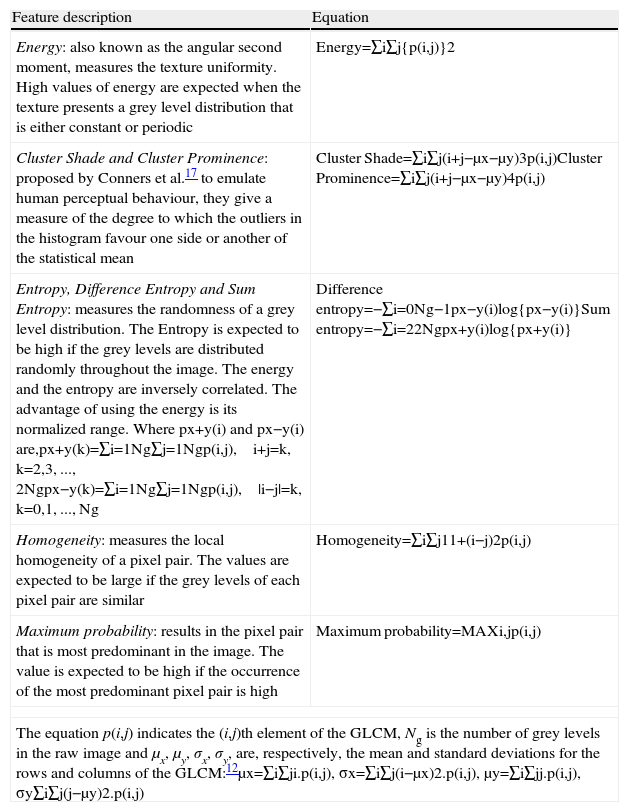
Definition of the texture features used in this study along with the equation applied to the Grey Level Co-occurrence Matrix (GLCM).
| Feature description | Equation |
| Energy: also known as the angular second moment, measures the texture uniformity. High values of energy are expected when the texture presents a grey level distribution that is either constant or periodic | Energy=∑i∑j{p(i,j)}2 |
| Cluster Shade and Cluster Prominence: proposed by Conners et al.17 to emulate human perceptual behaviour, they give a measure of the degree to which the outliers in the histogram favour one side or another of the statistical mean | Cluster Shade=∑i∑j(i+j−μx−μy)3p(i,j)Cluster Prominence=∑i∑j(i+j−μx−μy)4p(i,j) |
| Entropy, Difference Entropy and Sum Entropy: measures the randomness of a grey level distribution. The Entropy is expected to be high if the grey levels are distributed randomly throughout the image. The energy and the entropy are inversely correlated. The advantage of using the energy is its normalized range. Where px+y(i) and px−y(i) are,px+y(k)=∑i=1Ng∑j=1Ngp(i,j), i+j=k, k=2,3, ..., 2Ngpx−y(k)=∑i=1Ng∑j=1Ngp(i,j), |i−j|=k, k=0,1, ..., Ng | Difference entropy=−∑i=0Ng−1px−y(i)log{px−y(i)}Sum entropy=−∑i=22Ngpx+y(i)log{px+y(i)} |
| Homogeneity: measures the local homogeneity of a pixel pair. The values are expected to be large if the grey levels of each pixel pair are similar | Homogeneity=∑i∑j11+(i−j)2p(i,j) |
| Maximum probability: results in the pixel pair that is most predominant in the image. The value is expected to be high if the occurrence of the most predominant pixel pair is high | Maximum probability=MAXi,jp(i,j) |
| The equation p(i,j) indicates the (i,j)th element of the GLCM, Ng is the number of grey levels in the raw image and μx, μy, σx, σy, are, respectively, the mean and standard deviations for the rows and columns of the GLCM:12μx=∑i∑ji.p(i,j), σx=∑i∑j(i−μx)2.p(i,j), μy=∑i∑jj.p(i,j), σy∑i∑j(j−μy)2.p(i,j) | |
A range of different GLCMs can be generated from each image depending on the choice of vector length (d) and orientation (θ), which should be selected in a way to maximize the likelihood of separating the interference pattern from the signal. Using visually representative images from each pattern type, various choices for vector length and orientation were examined. Although the examples provided here are for a reduced number of images, they represent a typical set of images that can be encountered in videokeratoscopy. The effect of the level of quantization (Ng), which is the specific number of grey-levels to scale the image, is not considered in this paper. In general, the lower is the values of Ng, the lower the classification accuracy. The images from the videokeratoscope have a 256 grey-scale level, however choosing Ng=64 keeps the computational load low, while ensures that the classification accuracy will not be affected.16
FeaturesOnce the GLCM is generated, a set of texture statistical descriptors can be extracted. In Haralick's initial study 14 features were described.12 This set has been extended in other works.17,18 Through a preliminary trial, those features that appeared to be the most sensitive for the classification of the different videokeratoscopy textures were identified. Following the notation provided in Haralick et al.12 definitions of these features along with a brief explanation of the aspect of the image that they quantify are presented in Table 1.
Statistical analysisThe receiver operating characteristic (ROC) curves are commonly used to measure the performance of a two-class classification. The ROC curve provides the sensitivity and specificity of the measurement in separating the interference from the signal. Eight different ROC curves were calculated to show the capability of each of the texture features listed in Table 1 to discriminate between interference and signal pattern in the videokeratoscopic images.
Once the image is divided into blocks, the GLCM and the features are extracted for each of the blocks. In order to calculate the ROC, the data of the features from each of the two groups of pattern (i.e., signal and interference) were used to estimate the probability density function. This was achieved by using kernel density estimator with an Epanechnikov window.19 The ROC curves were then numerically evaluated from each such pair of non-parametric kernel density estimators. From the ROC curve, the area under the curve (AUC) was calculated using numerical integration. The AUC is normally used as a measure of the performance of how well detection is carried out, value of AUC=1 indicates an ideal detection, while a value of AUC=0.5 corresponds to random classification. Additionally, this approach utilizing ROC curve analysis was also applied to examine the effectiveness of each of the texture features in discriminating between normal patients and those with dry eye. Additionally to the AUC, the sensitivity and specificity of each texture-feature to detect dry eye was also calculated.
ResultsStatistical performance: signal versus interference separationThis section examines the optimum selection of the vector length and its orientation for the texture feature analysis, in such a way as to maximize the likelihood of separating the interference pattern from the signal, using a set of representative images (images I–IV in Fig. 1).
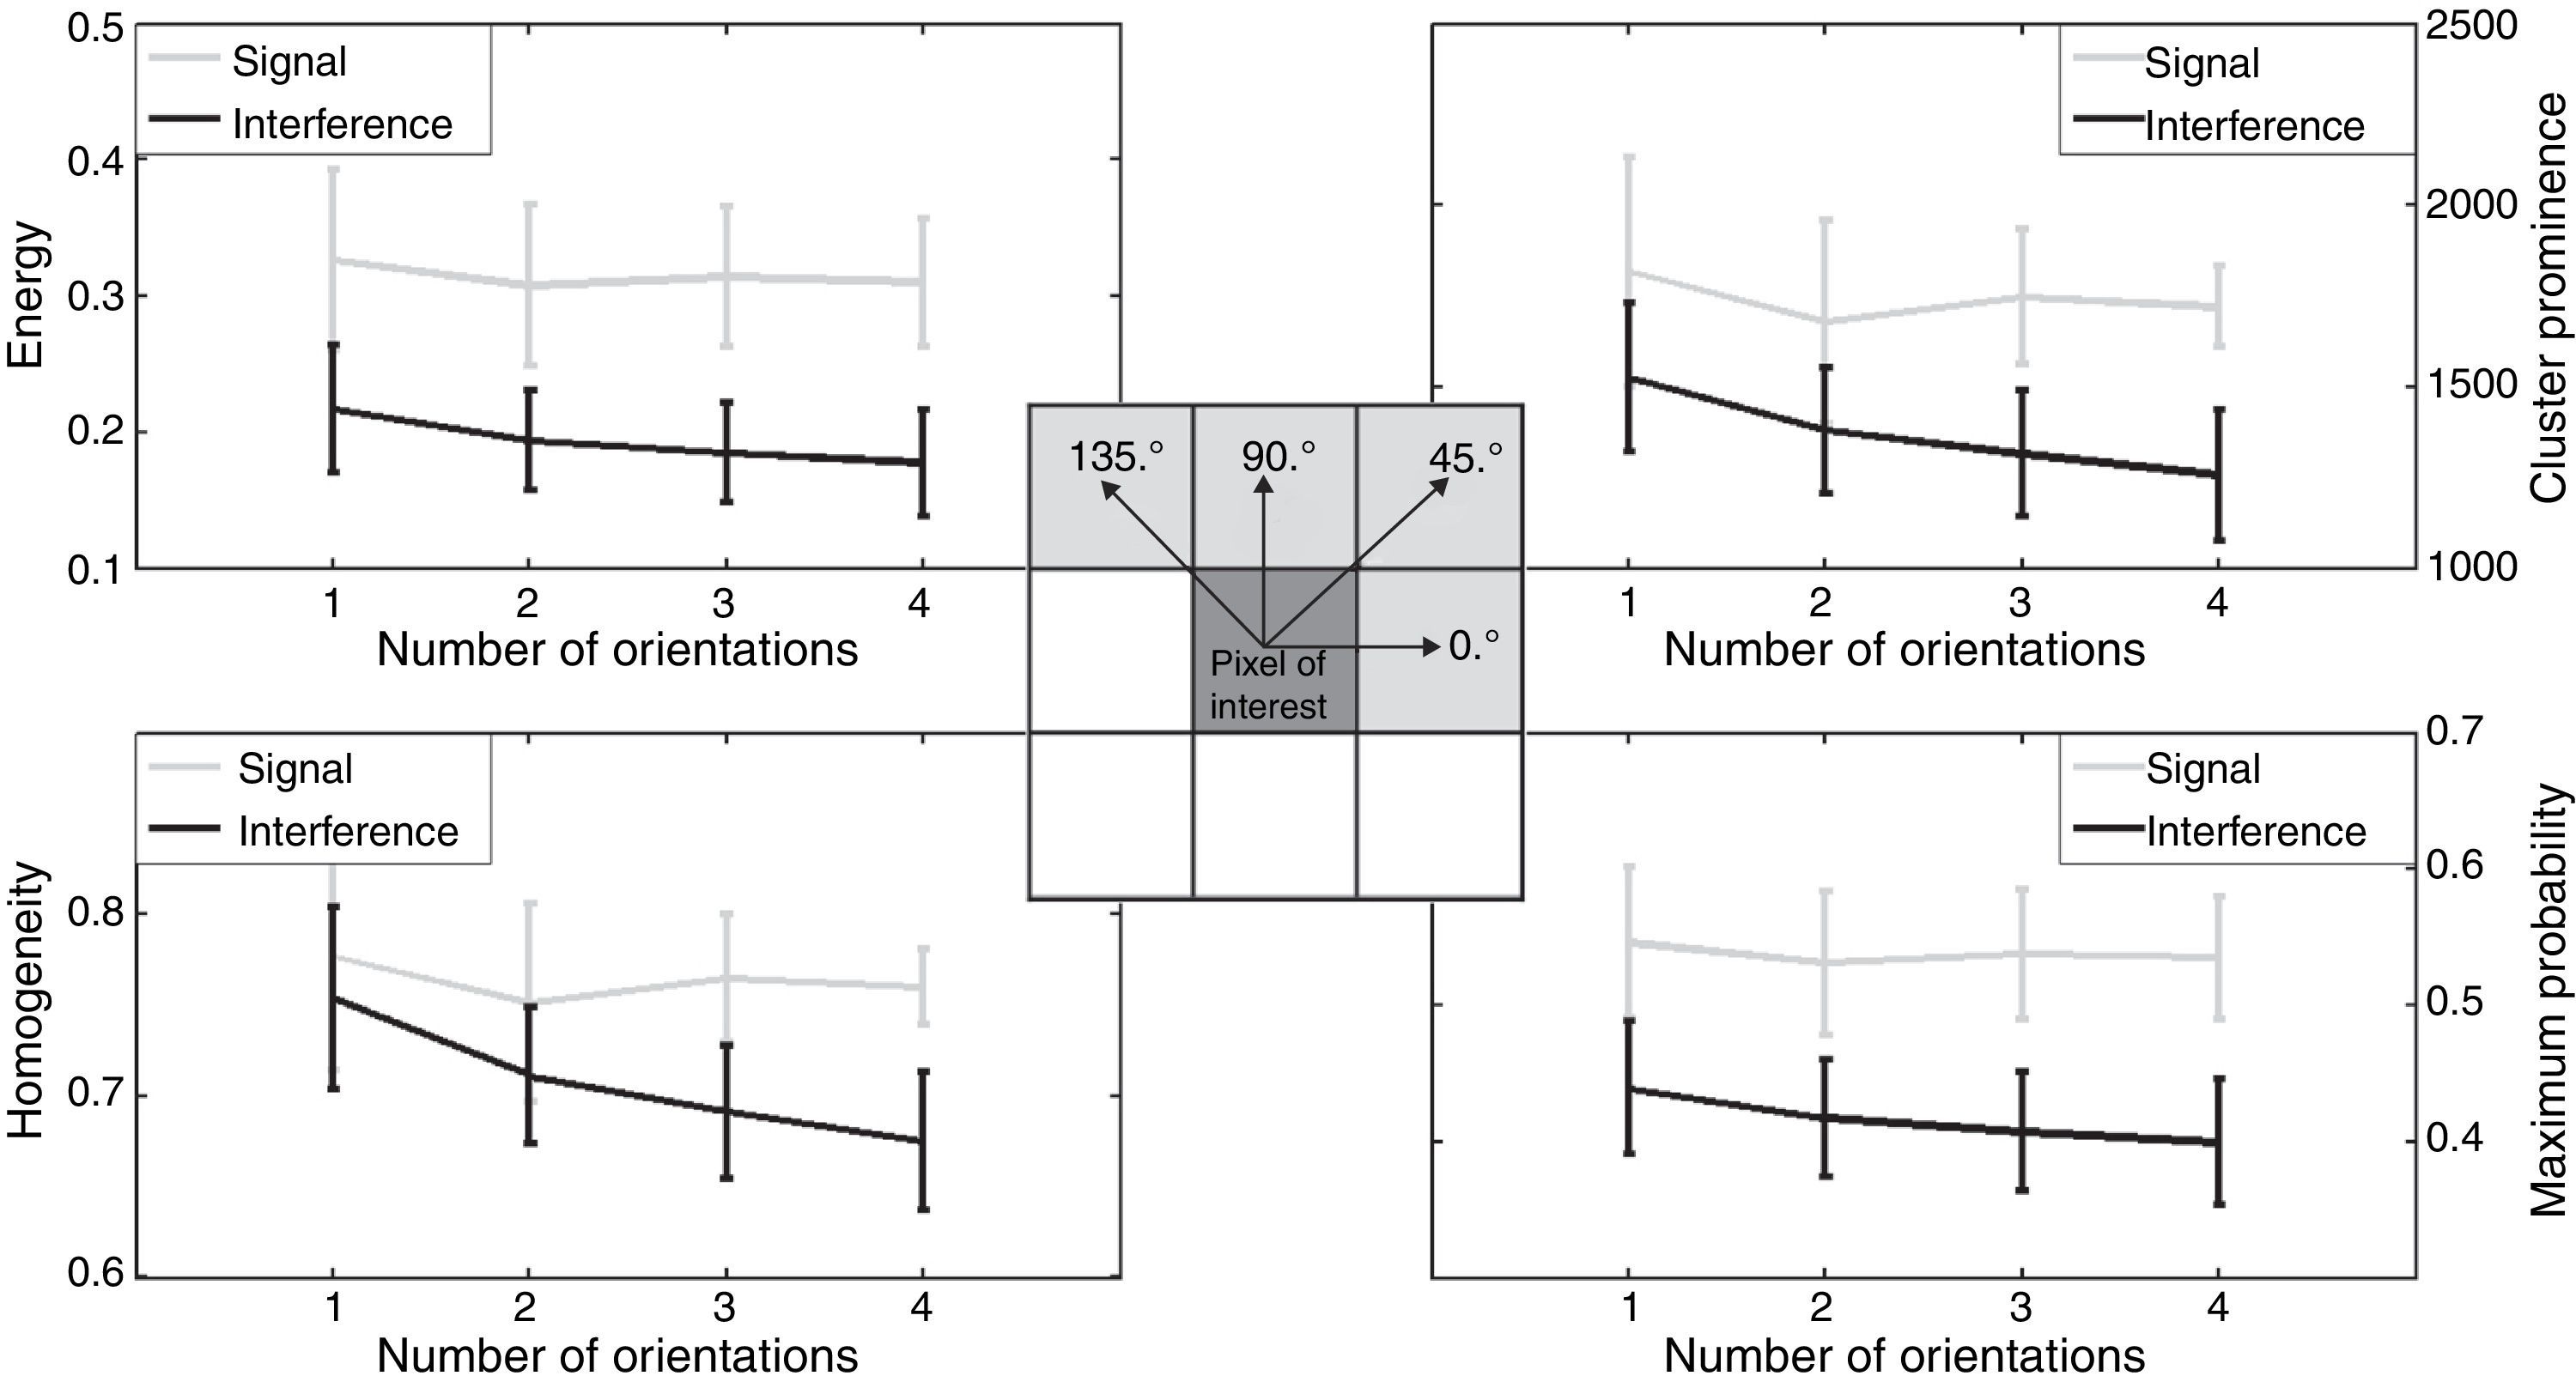
OrientationIt is important to differentiate between the pattern's directionality and the GLCM orientation. In the example shown in Fig. 2 (top), the pattern's (Placido disc) directionality is vertical while for this example the GLCM orientation to create the co-occurrence matrix was chosen horizontally (red lines in the image). The reflected videokeratoscopy pattern has directionality associated with it; hence it is important to ensure that the GLCM is not biased by this pattern's direction. Thus the vector's orientation used to create GLCM should be chosen to ensure that the statistics generated from the GLCM are rotationally invariant. To reduce the angular variance of the statistics, the GLCM can be generated using multiple vectors at the same time, so that each pixel contributes multiple times to the final GLCM. Fig. 3 shows the orientation dependency of four different features for four different vector orientations. As the number of orientations used to created GLCM increases, the separation of statistics (mean) between signal and interference increases, hence the separation between these two classes strengthens. This means that to properly characterize the GLCM matrix different orientations need to be considered. This effect is particularly clear when three or four orientations are used simultaneously (see Fig. 3). For our application, discrete angles theta=[0°, 45°, 90°, 135°] were selected, these values correspond to the adjacent pixels as shown in the inset of Fig. 3. As shown in the example, the advantage of using this approach is that it avoids the angular-dependency of GLCM.
![Class statistics, mean±one standard deviation, of four different texture features as a function of the number of orientations considered. 1=[0°], 2=[0°, 45°], 3=[0°, 45°, 90°], 4=[0°, 45°, 90°,135°]. The central inset shows a diagram with the relation between the angle and the adjacent pixels.](https://static.elsevier.es/multimedia/18884296/0000000600000004/v1_201311140028/S1888429613000587/v1_201311140028/en/main.assets/gr3.jpeg?xkr=ue/ImdikoIMrsJoerZ+w93meMsSv3kCFu9ka1kgzl/xrK32s3f4YRcWD6Dd7AXareZt5PpmUwJa48xlhaiEV6Y2Uly2KEZfJz/j0u3p3cRMWHxmvMt11ciV4zAdzubmJLV5oaYmNRWTm+iz3ExJCwI0eXbbYPD2sAKUA7Kd7uYjW55UlGe23BECQKyEt6mElPK5nKHXP0abtfrw3ohYSBIvbLsVeBGyrOYbsmlGsxJeXPWgyRZDfEckFIlKho69OkTM8w8INytfWt5fovOu4mplZXAbyq6ggAfgisODT+Nw= "Class statistics, mean±one standard deviation, of four different texture features as a function of the number of orientations considered. 1=[0°], 2=[0°, 45°], 3=[0°, 45°, 90°], 4=[0°, 45°, 90°,135°]. The central inset shows a diagram with the relation between the angle and the adjacent pixels.")
Class statistics, mean±one standard deviation, of four different texture features as a function of the number of orientations considered. 1=[0°], 2=[0°, 45°], 3=[0°, 45°, 90°], 4=[0°, 45°, 90°,135°]. The central inset shows a diagram with the relation between the angle and the adjacent pixels.
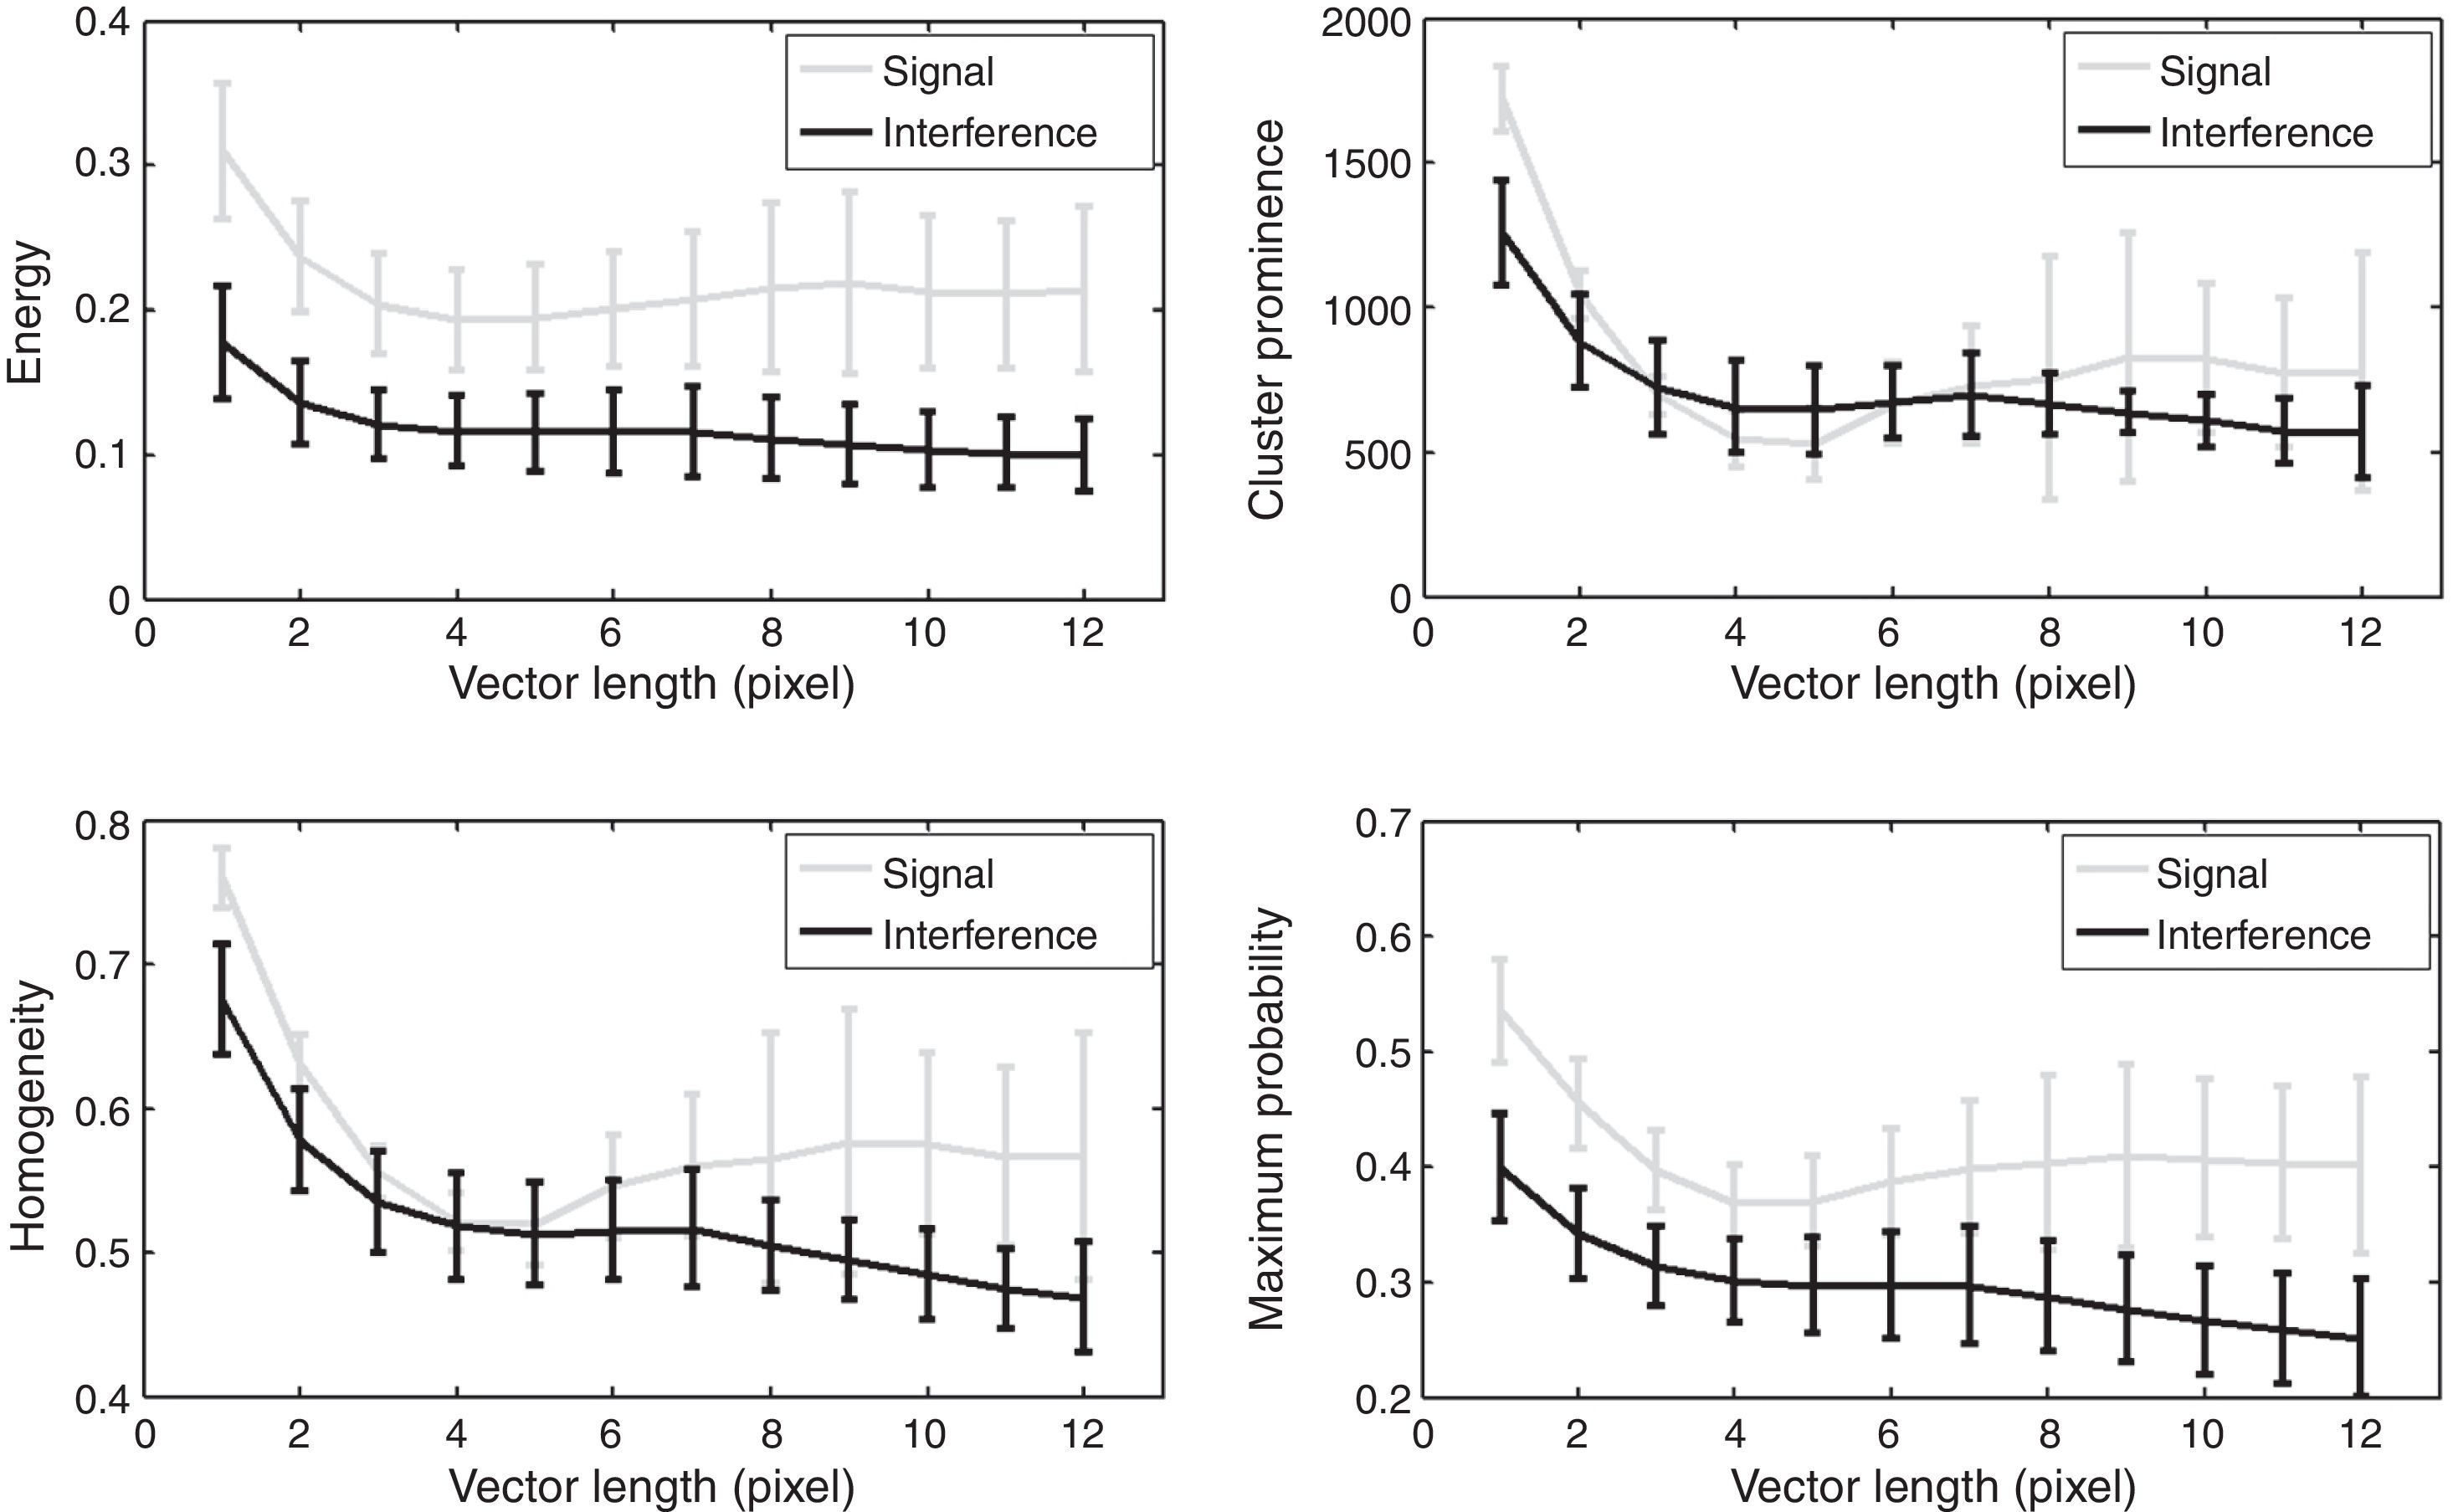
Similar to the orientation parameter, the choice of the vector's length has a substantial impact on the feature's statistics. Fig. 4 shows the influence of the length on the class statistics. A vector length of 1 pixel is the optimal option in this case and shows good separation between the classes as well as being the shortest possible length. The shorter the length, the more entries go into the GLCM.

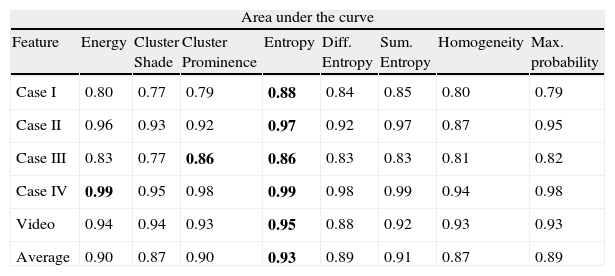
In order to evaluate the performance of the proposed technique the algorithm was tested on a number of representative videokeratoscopy images, shown in Fig. 1, as well as on a video sequence. The video, composed of 330 frames, corresponds to a full interblink interval of a dry eye patient. The detailed results from the ROC curve analysis for the performance of each of the features are given in Table 2. The area under the curve (AUC) is provided for the eight different considered features. It is worth noting that the entropy feature results in the largest AUC for all the cases, hence separating more effectively the interference from the signal. Overall, none of the considered features performs below AUC=0.77. Of special interest is the high AUC values obtained on the video sequence.
Area under the curve for the eight considered texture features for the four videokeratoscopic images from Fig. 1 and the video sequence. The bold numbers indicate the best feature within each case (highest AUC).
| Area under the curve | ||||||||
| Feature | Energy | Cluster Shade | Cluster Prominence | Entropy | Diff. Entropy | Sum. Entropy | Homogeneity | Max. probability |
| Case I | 0.80 | 0.77 | 0.79 | 0.88 | 0.84 | 0.85 | 0.80 | 0.79 |
| Case II | 0.96 | 0.93 | 0.92 | 0.97 | 0.92 | 0.97 | 0.87 | 0.95 |
| Case III | 0.83 | 0.77 | 0.86 | 0.86 | 0.83 | 0.83 | 0.81 | 0.82 |
| Case IV | 0.99 | 0.95 | 0.98 | 0.99 | 0.98 | 0.99 | 0.94 | 0.98 |
| Video | 0.94 | 0.94 | 0.93 | 0.95 | 0.88 | 0.92 | 0.93 | 0.93 |
| Average | 0.90 | 0.87 | 0.90 | 0.93 | 0.89 | 0.91 | 0.87 | 0.89 |
In order to evaluate the performance of the proposed technique to discriminate normal subjects from those with dry eye, data collected in a previous clinical study13 from 34 subjects (22 normal and 12 dry eyes) were used. The data were acquired under suppressed blinking conditions (SBC). In the SBCs, three measurements were taken. Subjects were asked to blink several times before the beginning of the measurement and then focus on the instrument's fixation target and keep their eyes open as long as they could. The maximum time of the recording sequence was 30s and a 3-min break was given between measurements. More details on the measurement protocol are given in Ref. 13.
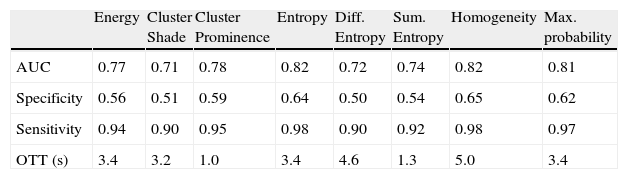
The subject's data corresponding to each blink was cropped to a specific length. The first 5s of each recording was used, excluding the first second after the blink to avoid the effect of tear film formation/spreading on the estimates of TFSQ. The 5s interval ensures that 100% of the subjects were included in each group in the analysis (i.e., all subjects had a minimum of 5s or more of data prior to a blink in the recording). The three recordings per subject were averaged into one single measurement. Receiver operating characteristic (ROC) curves were calculated to show the capability of the considered texture features to discriminate dry eye from normal tear film subjects. To arrive at the best possible detection performance for the non-invasive test, a group of ROC curves were evaluated at different sampling intervals between the time interval from the 1st second to the 6th second. This may provide an optimal time threshold in terms of discrimination performance. A detailed result of each of the features performance in terms of area under the curve (AUC), specificity and sensitivity as well as its optimal time threshold is given in Table 3. The entropy and homogeneity features resulted in the largest AUC, in other words the best dry eye detection. For all the considered texture features, the AUC value range from 0.77 to 0.82, while the sensitivity shows values above 0.9 and the specificity shows values around 0.6.
The area under the curve (AUC), sensitivity and specificity for the different texture features, showing the performance of the technique to diagnose dry eye. The optimal time threshold (OTT) indicates the time of optimal discrimination.
| Energy | Cluster Shade | Cluster Prominence | Entropy | Diff. Entropy | Sum. Entropy | Homogeneity | Max. probability | |
| AUC | 0.77 | 0.71 | 0.78 | 0.82 | 0.72 | 0.74 | 0.82 | 0.81 |
| Specificity | 0.56 | 0.51 | 0.59 | 0.64 | 0.50 | 0.54 | 0.65 | 0.62 |
| Sensitivity | 0.94 | 0.90 | 0.95 | 0.98 | 0.90 | 0.92 | 0.98 | 0.97 |
| OTT (s) | 3.4 | 3.2 | 1.0 | 3.4 | 4.6 | 1.3 | 5.0 | 3.4 |
We have investigated the applicability of an image processing technique, textural feature analysis, for the classification and detection of interference in videokeratoscopic images. In the method grey level co-occurrence matrix (GLCM) was used to extract a set of textural features, in which the GLCM was optimally calculated to maximize the likelihood to separate the signal and interference in the videokeratoscopy images. The results from the ROC analysis, with AUC values ranging from 0.77 to 0.82, demonstrate the capability of these features to discriminate between signal and interference in static images. Additionally, the good performance, particularly of specific textural features, such as entropy that exhibited an AUC of 0.82 (sensitivity=0.98, sensitivity=0.64) for the discrimination between normal and dry eye patients, indicates the potential of this technique to assess the tear film quality. These findings suggest that the values derived from the videokeratoscopy images using the texture feature analysis could provide relevant clinical information regarding the quality of the tear film surface. We have previously examined the ability of dynamic videokeratoscopy images for the discrimination of normal and dry eye patients,13 and found that analysis of the images using a pattern coherence approach exhibited good discriminative ability for the detection of dry eye (AUC of 0.72). The slightly greater AUC found for some of the textural features examined in this manuscript (e.g., entropy) suggests that image analysis using textural features may provide better discrimination compared to other image analysis approaches for the analysis of videokeratoscopy images from dry eye patients. Thus with the proposed software algorithm, the clinical corneal topographer can be used to provide further information regarding the integrity of the tear film, potentially contributing to improved detection of dry eye. However, we recognize that the detection and monitoring of dry eye syndrome is a complex clinical issue, which cannot rely solely on measures from a single instrument. Therefore we anticipate that this method could be one of a battery of tests that is used to facilitate the clinical diagnosis and monitoring of dry eye.
Other videokeratoscopy analysis techniques have been previously proposed in the literature. However, they have typically been based upon the assessment of tear film break-up time rather than the specific analysis of the quality of the Placido disc pattern provided in our proposed method. Taking into consideration the difference between studies and the principle of the techniques, the methods in the current paper appear to be comparable to previously developed methods, such as Mengher et al.20 (specificity=0.83, sensitivity=0.85) and Goto et al.21 (specificity=0.98, sensitivity=0.63), which also showed a good discrimination power. We are yet to extract the measurements of break-up time from dynamic-area HSV, since the aim of this study was to use the surface quality indicator as a measurement to discriminate between dry eye and normal tear film subjects.
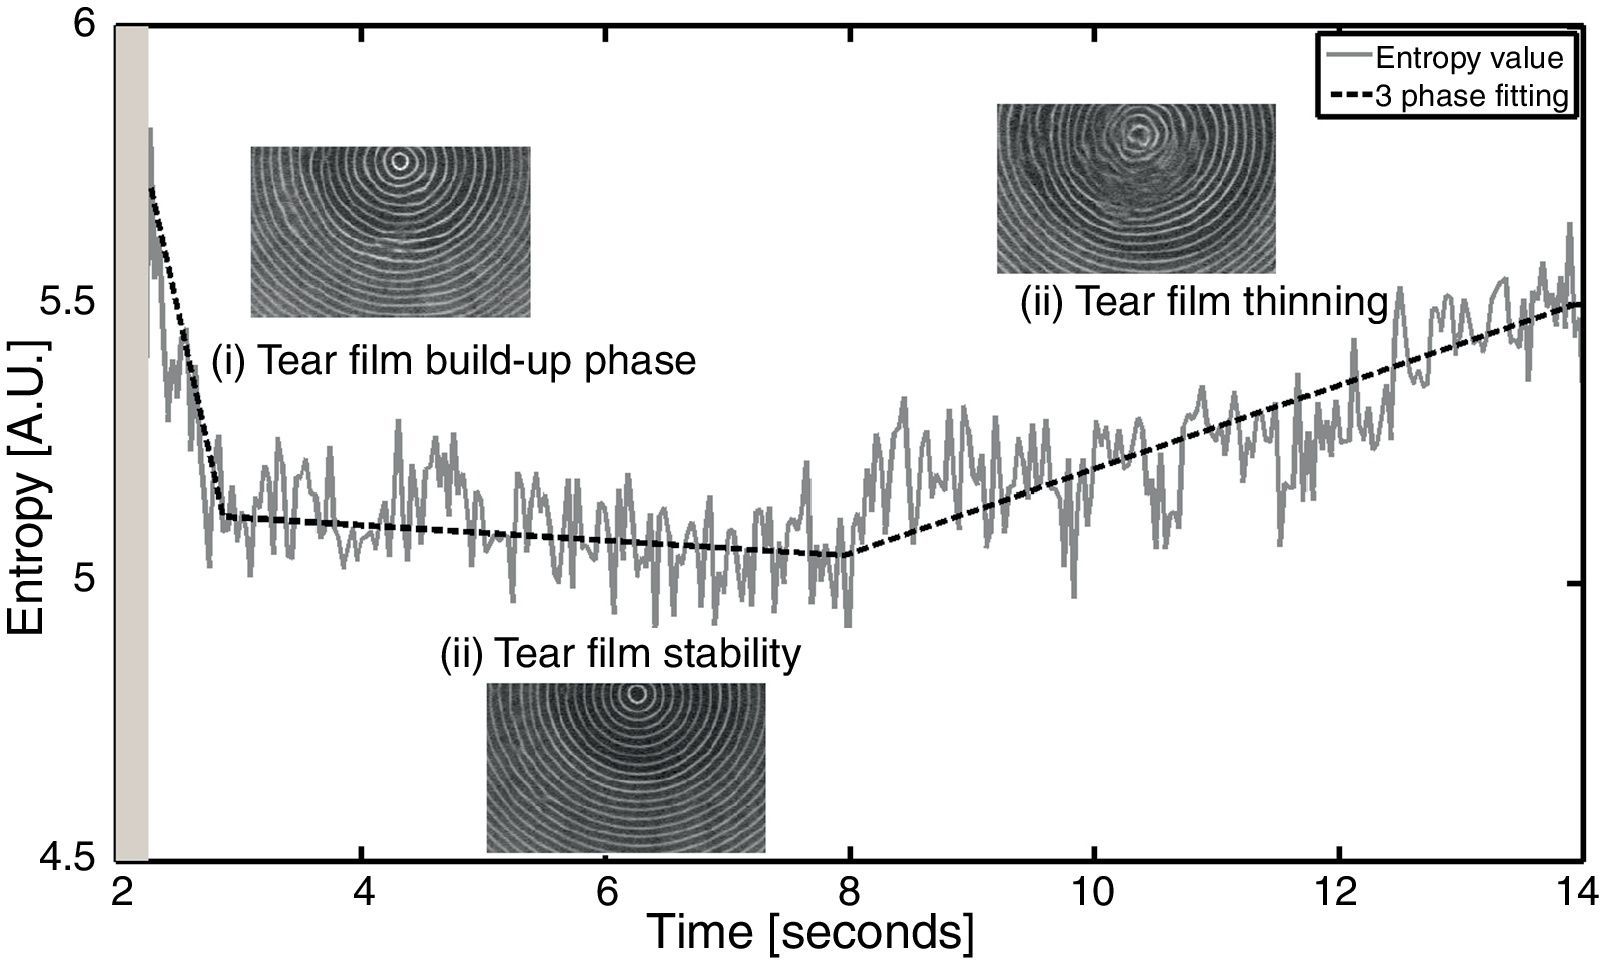
In general, from the set of texture statistical descriptors that have been considered, it appears that the entropy descriptor achieves the best AUC values for the majority of the examples. This result was expected because entropy represents a measure of the randomness of the distribution of the image, which changes as the tear film becomes thinner and the reflected pattern becomes more unstructured, as previously shown in Fig. 2. Additionally, the technique could also be used to extract information about the tear film kinetics, expanding the flexibility of the proposed method to extract relevant clinical information such as estimates of the break-up time. Fig. 5 shows an example of the estimated entropy values from a representative video sequence, the subject presented a build-up time of 0.6s and the tear film started to deteriorate 5.7s after the blink. In the plot, a clear example of the three-phase model of tear film kinetics can be seen.9 In the first phase following the blink a short build-up time (tear spreads over the ocular surface) is observed, then a stable period of about 5s and finally the tear film thinning and deterioration phases are observed. An example of the image region analyzed in the kinetics calculation is given within the plot.

Detecting interference patterns in videokeratoscopy images and identifying key textural features to characterize this interference can be useful in quantifying the tear film surface behaviour, especially in dry eye patients and contact lens wearers, in which the stability of the patterns orientation is known to be poor. The proposed techniques provide us with tools that can be used to extract useful information from a videokeratoscopy image for the assessment of the tear film surface quality; however, further work is needed to understand the reliability and repeatability of the technique. Additionally, the technique could be applied to extract tear film kinetics information and for dry eye detection, which demonstrates the flexibility of the proposed technique to quantify videokeratoscopy images and obtain relevant clinical information.
Conflicts of interestThe authors have no conflicts of interest to declare.
DS-I was supported by the Young Cadre 2015 Plus, 40/PD/2012 – the project was co-financed by the European Union and the Polish state budget through the European Social Fund.


