


To compare the short-term visual and optical performance of silicone hydrogel contact lenses for myopia ≥ −3.00D.
MethodsThis was a short-term, non-dispense, double-masked, randomized study investigating Night&Day (ND), PureVision (PV), O2 Optix (O2), Biofinity (BF), Acuvue Advance (AA) and Acuvue OASYS for myopia ≥ −3.00D. Testing was conducted under scotopic conditions. Measures (one eye only) included: high- and low-contrast visual acuity (HCVA/LCVA), contrast sensitivity, subjective clarity of vision ratings (0-100 scale using reference images, with test image representing grade 50) and ocular aberrations (up to the 4th order, analyzed across individual scotopic pupil sizes).
ResultsThree males and 27 females participated, with a mean (± SD) age of 24.9 ± 7.7 yrs (range 19 to 53 yrs), sphere of −5.30 ± 1.73D (range −3.00 to −10.75D) and cylinder −0.36 ± 0.23D (range 0 to −0.75D). Mean (± SEM) logMAR HCVA ranged from 0.06 (PV) to 0.10 (AA) (± 0.02), LCVA from 0.33 (BF) to 0.40 (AA) (± 0.02) and contrast sensitivity from 2.33 (BF) to 2.53 (ND) (± 0.15) (differences not statistically significant; all p > 0.05). Subjective ratings for the test image ranged from 59 (PV) to 64 (ND) (± 4) and 56 (AA) to 65 (ND) (± 4), for monochromatic and polychromatic reference images, respectively (all p > 0.05). There was a statistically significant impact on ocular aberrations with all study lenses compared to no lens. Between-lens differences were statistically significant for defocus (Z02), horizontal coma (Z 13) and spherical aberration (Z04).
ConclusionsDespite some differences in ocular aberrations, there were no significant differences in HCVA, LCVA, contrast sensitivity or subjective ratings across lenses.
Comparar el rendimiento visual y óptico a corto plazo de la lentes de contacto de hidrogel de silicona (HS) para miopía ≥ −3,00 D.
MétodosSe trata de un estudio a corto plazo con doble enmascaramiento, aleatorizado y sin prescripción facultativa que investiga las lentes para miopía ≥ −3,00D Night&Day (ND), PureVision (PV), O2 Optix (O2), Biofinity (BF), Acuvue Advance (AA) y Acuvue OASYS (AO). La prueba se realizó en condiciones escotópicas. Las medidas (un ojo sólo) incluyeron: agudeza visual de alto y bajo contraste (AVAC/AVBC), sensibilidad al contraste, claridad subjetiva de visión (escalas 0–100 con imágenes de referencia, imágenes de prueba que representan grado 50) y deformaciones oculares (hasta orden 4, analizadas en tamaños de pupilas individuales en condiciones escotópicas).
ResultadosParticiparon 3 hombres y 27 mujeres, con una edad media (± DS) de 24,9 ± 7,7 años (intervalo 19 a 53 años), esfera de −5,30 ± 1,73D (intervalo de −3,00 a −10,75D) y cilindro −0,36 ± 0,23D (intervalo de 0 a −0,75D). La logMAR AVAC media (± EEM) osciló de 0,06 (PV) a 0,10 (AA) (± 0,02), la AVBC de 0,33 (BF) a 0,40 (AA) (± 0,02) y la sensibilidad al contraste de 2,33 (BF) a 2,53 (ND) (± 0,15) (diferencias sin significación estadística; p > 0,05). Las puntuaciones subjetivas para la imagen de prueba variaron entre 59 (PV) y 64 (ND) (± 4) y entre 56 (AA) y 65 (ND) (± 4), para imágenes de referencia monocromáticas y policromáticas, respectivamente (p > 0,05). Se observó un efecto estadísticamente significativo sobre las deformaciones oculares con todas las lentes del estudio al comparar con la ausencia de lente. Las diferencias entre lentes fueron estadísticamente significativas para deformaciones fuera de foco (Z02), coma horizontal (Z 13) y deformación esférica (Z04).
ConclusionesA pesar de algunas diferencias de las deformaciones oculares, no hubo diferencias significativas en AVAC, AVBC, sensibilidad al contraste o puntuaciones subjetivas entre las lentes.
The corneal and internal optics of the eye are balanced in such a way to optimize visual performance. 1 Specifically, it has been shown that the crystalline lens has positive spherical aberration, which is partially compensated for by the cornea having negative spherical aberration due in part to its prolate shape. 1,2 When a contact lens is placed on the eye, there is the potential for a disruption of this balanced system. Soft contact lenses are a popular option for refractive error correction, 3 and there have been reports of reduced optical quality with soft contact lenses compared to spectacle lenses and rigid gas permeable contact lenses. 4–8
Previous investigations measuring the optical performance of soft contact lenses, specifically longitudinal spherical aberration, concentrated on theoretical ray tracing methods and corneal models. 9,10 Using these methods, higher amounts of spherical aberration were reported for lens powers greater than + 3.00D and −6.00D and for spherical versus aspheric lens designs. 9 Unfortunately, these previous methods are indirect and do not capture the interaction of the contact lens with the cornea, which is influenced by many factors including lens design, lens modulus, lens fit and corneal curvature, or include the contribution from the internal optics of the eye. Consequently, this limits the clinical application of these results. Wavefront aberrometry, however, provides a clinical measure of optical quality for the whole eye, which includes information regarding both lower-order and higher-order aberrations and has been shown to provide a way of understanding the optical effects of contact lenses in situ. 5
López-Gil et al. 11 investigated custom designed soft lenses with aspheric and asymmetric surfaces using a Shack-Hartmann aberrometer. They measured a small amount of residual aberration with an aberration-free contact lens sample in situ, highlighting the importance of the interaction of aberrations between the contact lens and whole eye. 11 Jiang et al. 4 investigated the optical quality of eyes wearing different types of soft contact lenses using aberrometry. This report suggests that wavefront aberrations vary depending on lens type, possibly due to differences in manufacturing techniques. 4 In 2006, Roberts et al. 12 evaluated changes in wavefront aberrations with and without soft contact lens wear in 15 subjects. The results from this study showed that soft contact lenses for myopia induced a significant increase in total higher order aberrations. 12 Using 20 subjects and various powers of a particular silicone hydrogel contact lens, Awwad et al. 13 report that the lens inherently demonstrated positive spherical aberration and coma and that negative spherical aberration increased as the negative power of the lens increased. 13 Finally, Efron et al. 14 have investigated the optical and visual performance between an aspheric and spherical soft contact lens: they report no statistically significant difference in aberrations or vision between lens designs. 14
Despite these previous reports of changes in aberrations as a result of contact lens wear, 4,5,11–14 the impact of these changes on visual performance is still unclear. Therefore, the purpose of our study was to provide a comprehensive investigation of the visual and optical performance of different silicone hydrogel lenses.
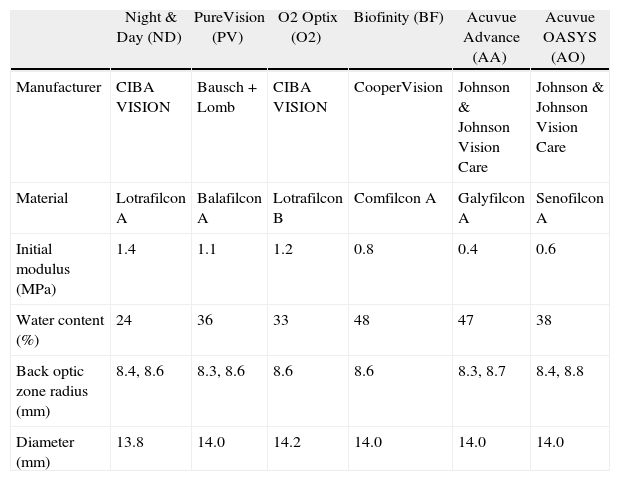
Subjects and methodsA prospective, randomized, double-masked, non-dispensing experiment was conducted at the Centre for Contact Lens Research. The study received ethics clearance from the University's Ethics Review Board, and informed consent was obtained from each subject prior to study entry. All procedures followed the tenets of the Declaration of Helsinki. Thirty adapted soft contact lens wearers were recruited for this study and six currently marketed spherical silicone hydrogel contact lenses were tested (lens details are provided in Table 1). Subjects were screened and enrolled only if they satisfied all inclusion criteria, including no ocular disease, prior ocular surgery, corneal opacities, systemic disease, or medication that could potentially affect vision. Three males and 27 females were enrolled, with a mean (± SD) age of 24.9 ± 7.7 yrs (range 19 to 53 yrs), sphere of −5.30 ± 1.73D (range −3.00 to −10.75D) and cylinder −0.36 ± 0.23D (range 0 to −0.75D). Subjects with a scotopic pupil size less than 5.0 mm were excluded.
Lens details
| Night & Day (ND) | PureVision (PV) | O2 Optix (O2) | Biofinity (BF) | Acuvue Advance (AA) | Acuvue OASYS (AO) | |
| Manufacturer | CIBA VISION | Bausch + Lomb | CIBA VISION | CooperVision | Johnson & Johnson Vision Care | Johnson & Johnson Vision Care |
| Material | Lotrafilcon A | Balafilcon A | Lotrafilcon B | Comfilcon A | Galyfilcon A | Senofilcon A |
| Initial modulus (MPa) | 1.4 | 1.1 | 1.2 | 0.8 | 0.4 | 0.6 |
| Water content (%) | 24 | 36 | 33 | 48 | 47 | 38 |
| Back optic zone radius (mm) | 8.4, 8.6 | 8.3, 8.6 | 8.6 | 8.6 | 8.3, 8.7 | 8.4, 8.8 |
| Diameter (mm) | 13.8 | 14.0 | 14.2 | 14.0 | 14.0 | 14.0 |
Testing was conducted under scotopic conditions with a chart background luminance of 0.1–0.3 cd/m2 measured with a Minolta CS-100 photometer (Minolta Canada, Inc. Mississauga, ON). Low luminance (scotopic) conditions were used because total higher order ocular aberrations increase with a larger pupil size, which can negatively impact visual performance. 15 All participants had approximately the same amount of light adaptation prior to dark adaptation. High contrast visual acuity (HCVA), 10 % low contrast visual acuity (LCVA) and Weber contrast sensitivity were measured using the Freiburg Visual Acuity and Contrast Test (FrACT). 16 The FrACT is a program that enables automatic and observer-independent determination of visual acuity at a defined optotype contrast or contrast sensitivity at a specific optotype size. The FrACT uses an eight-alternative forced choice and the best parameter estimation by sequential testing (PEST) algorithm for threshold determination. 16 Subjects indicated the positions of the perceived gap of a Landolt C on a computer keyboard. A learning session was completed viewing through the best sphere trial lens in a trial frame at the screening visit.
Subjective clarity of vision with each lens was rated for a digitally projected monochromatic and polychromatic image on a 0 to 100 scale. Prior to each rating, two reference images were shown. The first was a perfectly clear image (i.e. grade 100) and the second was a highly aberrated image (i.e. grade 0). Subjects were then asked to rate an image that was aberrated by 1/2 the amount of the highly aberrated image. Therefore, it was anticipated that ratings would be around 50 out of a 100. Simulated images were produced by VOL-CT software (Sarver and Associates, Inc. Carbondale, IL), as described elsewhere. 17
Lenses were fitted at a screening visit where eligibility was confirmed and optimal base curve and lens power were determined. Fitting criteria included movement not greater than 0.2 mm and decentration not greater than 0.2 mm in any direction. During the study visits, lenses were inserted straight from their blister packs, which were over-labelled to conceal everything on the package, including the lens name and manufacturer, and were worn for approximately 45 minutes for the testing. To minimize visual fatigue, there were two study visits completed on separate days. Three study lenses were randomly tested at each visit following a five-minute period of lens settling and dark adaptation. Additionally, there was a 10-minute break period between lenses. Scotopic pupil size was measured following this period of dark adaptation using a Colvard pupillometer (OASIS Medical, Inc., Glendora, CA). The order of vision measurements and subjective ratings were randomized for each lens, however aberrometry was always measured last, prior to lens removal, due to instrument location.
Wavefront measurements were taken in a dark room using a Shack-Hartmann aberrometer (LADARWave; Alcon Laboratories, Inc., Fort Worth, TX), which uses a dynamic fogging method to relax accommodation. It has been found that tear break-up can increase the higher order aberrations measured by a Shack-Hartmann aberrometer, 18 therefore subjects were asked to blink three times prior to each measurement to ensure proper wetting of the cornea or contact lens and by carefully assessing the wavefront image quality prior to saving the data. If the lenslet pattern was blurred in any way, the measurement was rejected and then repeated. Five measurements were taken and the averages of the best three were used for the analyses.
Ocular aberrations have been described using Zernike polynomials. The units are micrometres (μm) and positive values indicate that the reflected wavefront emerging from the eye is phase-advanced relative to the wavefront at the center of the pupil. Negative values indicate that the reflected wavefront emerging from the eye is phase-retarded relative to the wavefront at the center of the pupil. As recommended by the Vision Science and Its Applications (VSIA) taskforce, 19 a right-hand coordinate system and the double-index naming convention (Zmn) was used. Aberrations have been analyzed across the individual scotopic pupil size for each subject. Lower (2nd order) and higher (3rd through 4th order) aberrations have been reported.
A sample size of 30 was based on a previous investigation measuring higher-order aberrations induced by soft contact lenses using wavefront aberrometry. 12 Normality of the outcome variables was checked using Kolmogorov-Smirnov tests in Statistica 7 statistical software (StatSoft Inc., Tulsa, OK). The majority of the variables were normal but a small number were not. We examined the distributions for symmetry and the presence of outliers — there were no outliers in the non-normal data sets and they were approximately symmetrical. Because the design was balanced with a relatively large sample size, we chose to use more powerful and versatile parametric analyses that have been reported to be robust under these circumstances 20,21 Repeated Measures analyses of variance and Tukey's HSD (Honestly Significant Difference) test were used to determine significance, which was set at p ≤ 0.05. Exploratory analyses were done using R: A Language and Environment for Statistical Computing statistical software (R Foundation for Statistical Computing, Vienna, Austria). 22 Additional details relating to the exploratory analyses are described in the discussion. All analyses included the right eye only.
ResultsThe mean (± standard error of the mean [SEM]) scotopic pupil size was 6.7 mm (± 0.18 mm) and ranged from 5.0 mm to 8.1 mm. There was no statistically significant difference in maximum scotopic pupil size between any of the lens types or between the various lens types and no lens (all p > 0.05). The average of the standard deviation of pupil size between lenses was 0.22 mm. Compared to no lens, there was a statistically significant change in higher-order aberrations with all study lenses. Specifically, Z−13 and Z 13 increased with ND (0.04 μm no lens vs. 0.17 μm ND and 0.03 μm no lens vs. 0.24 μm ND for Z−13 and Z 13, respectively, both p < 0.05) and there was a statistically significant change in Z04 with all lenses except ND (0.12 μm no lens vs. 0.01 μm PV, −0.01 μm O2, −0.05 μm BF, −0.03 μAA, −0.05 μm AO (all p < 0.05) and 0.14 μm ND (p > 0.05).
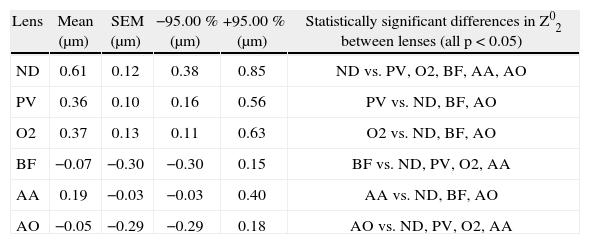
Between silicone hydrogel lenses, the following differences existed: Z02 differed between lenses as shown in Table 2. With respect to higher order aberrations, ND was different from all lenses for Z 13 (0.24 μm ND vs. 0.09 μPV, 0.04 μm O2, 0.09 μm BF, 0.04 μm AA, 0.03 μAO; all p < 0.05) and Z04 (0.14 μm ND vs. 0.01 μm PV, −0.01 μm O2, −0.05 μm BF, −0.03 μm AA and −0.05 μm AO; all p < 0.05). Figures 1 and 2 are plots showing the differences across all lenses for Z04 (spherical aberration) and Z 13 (horizontal coma), respectively. There were no statistically significant differences in higher order aberrations between PV, O2, BF, AA and OA (all p > 0.05).
Difference in Z02 (defocus) between lenses
| Lens | Mean (μm) | SEM (μm) | −95.00 % (μm) | +95.00 % (μm) | Statistically significant differences in Z02 between lenses (all p < 0.05) |
| ND | 0.61 | 0.12 | 0.38 | 0.85 | ND vs. PV, O2, BF, AA, AO |
| PV | 0.36 | 0.10 | 0.16 | 0.56 | PV vs. ND, BF, AO |
| O2 | 0.37 | 0.13 | 0.11 | 0.63 | O2 vs. ND, BF, AO |
| BF | −0.07 | −0.30 | −0.30 | 0.15 | BF vs. ND, PV, O2, AA |
| AA | 0.19 | −0.03 | −0.03 | 0.40 | AA vs. ND, BF, AO |
| AO | −0.05 | −0.29 | −0.29 | 0.18 | AO vs. ND, PV, O2, AA |
Mean, standard error of the mean (SEM), and ± 95 % confidence intervals are shown.
AA: Acuvue Advance; AO: Acuvue OASYS; BF: Biofinity; ND: Night&Day, O2: O2 Optix; PV: PureVision.
, baseline (no lens) and experimental (with lens) across lens types. AA: Acuvue Advance; AO: Acuvue OASYS; BF: Biofinity; ND: Night&Day, O2: O2 Optix; PV: PureVision.")
, baseline (no lens) and experimental (with lens) across lens types. AA: Acuvue Advance; AO: Acuvue OASYS; BF: Biofinity; ND: Night&Day, O2: O2 Optix; PV: PureVision.")
Figure 3 illustrates the relationship between modulus and defocus. Although the Pearson correlation coefficient was high (r = 0.7), this association was not statistically significant (p > 0.05).
 for each lens type. AA: Acuvue Advance; AO: Acuvue OASYS; BF: Biofinity; ND: Night&Day; O2: O2 Optix; PV: PureVision.")
Mean (± SEM) logMAR HCVA ranged from 0.06 (PV) to 0.10 (AA) (± 0.02) and LCVA from 0.33 (BF) to 0.40 (AA) (± 0.02) (see Figure 4). Weber contrast sensitivity ranged from 2.33 % (BF) to 2.53 % (ND) (± 0.15). Subjective ratings ranged from 59 (PV) to 64 (ND) (± 4) and from 56 (AA) to 65 (ND) (± 4) for the monochromatic and polychromatic image, respectively (see Figure 5). These differences between lenses for HCVA, LCVA, contrast sensitivity and subjective ratings were not statistically significant (all p > 0.05).
 across lens types. AA: Acuvue Advance; AO: Acuvue OASYS; BF: Biofinity; ND: Night&Day; O2: O2 Optix; PV: PureVision.")
 across lens types. First = monochromatic image, Second = polychromatic image. AA: Acuvue Advance; AO: Acuvue OASYS; BF: Biofinity; ND: Night&Day; O2: O2 Optix; PV: PureVision.")
The findings of our study are in agreement with the literature that soft contact lens wear has an impact on static, distance ocular higher order aberrations. 4,5,11–13 Our results specifically show that spherical aberration and coma are most affected, however not to the same degree for all lenses. ND was the only lens not to significantly impact spherical aberration compared to no lens and it was the only lens to significantly increase both horizontal and vertical coma compared to no lens wear.
Lens design can have an impact on spherical aberration. If not addressed, negative spherical aberration would inherently increase with increasing minus lens power. Papas et al. 23 have shown that power profiles differ between silicone hydrogel lenses, with ND having more minus power in the periphery as negative lens powers increase. 23 This results in less inherent negative spherical aberration in a minus ND lens. This corresponds to our findings, where there was a significant change in spherical aberration with all lenses compared to no lens, with the exception of ND.
The increase in horizontal and vertical coma with ND compared to no lens and the difference in horizontal coma between ND and the rest of the lenses is more difficult to account for. Coma is thought to be due to misalignment or decentration of an optical system. Guirao et al. 24 report that decentering a higher-order aberration primarily results in induced aberrations with a radial order that is one less (i.e. n −1). For example, decentering spherical aberration (a 4th order aberration, n = 4) would theoretically result in induced coma (a 3rd order aberration, n = 3). 24 Buhren et al. 25 have shown using a cat model that optical zone decentration with photorefractive keratectomy resulted in under-correction of sphere and induced astigmatism and coma. Precise measurements were not performed, however all lenses in this study had clinically acceptable centration (decentration not greater than 0.2 mm). These changes in aberrations could also be related to the specific design of the lens, which could be investigated by measuring “off-eye” higher-order aberrations of the lens. Awwad et al.13 suggest that ND induces coma independent of lens power, however they do not indicate whether the induced coma is vertical or horizontal. Another possibility for the difference in horizontal coma with ND compared to the other lenses could be due to an asymmetrical lens fit, possibly as a result of its higher modulus. Future studies on the impact of alignment or centration errors on higher order aberrations with specific contact lens designs may be useful. One method could be to systematically decenter various contact lenses and measure the resultant aberrations. Subtle topographical changes with and without a lens could also be explored.
The inclusion criteria of ≥ −3.00D of myopia was chosen because spherical aberration has been associated with increasing minus lens power 10,13 and it was our intention to see whether there were differences between silicone hydrogel lenses for moderate myopia. Despite the differences in optical performance between study lenses, we did not find any significant difference in short-term visual performance. One possibility could be due to insufficient power to detect differences in an effect size that is small.
When someone accommodates the aberration structure of the eye changes, as well as pupil size. Pupil constriction at near reduces the visual impact of higher order aberrations; therefore the greatest visual impact of higher order aberrations would be expected for distance viewing. The paper mentioned previously 23 in which lens power profiles are reported, also presented the short-term, distance visual performance of 28 subjects who wore four different silicone hydrogel lenses and one traditional hydrogel lens. There were statistically significant differences in power profiles between lenses, but there were no differences in HCVA, LCVA or low illumination HCVA. 23 Our study is in agreement with these results in that there were differences in optical performance between lenses, but no statistically significant difference in visual performance. Cox and Holden 10 reported that added negative spherical aberration in traditional hydrogel contact lenses had a lesser detrimental effect on contrast sensitivity than added positive spherical aberration at mid-spatial frequencies. Wearing ND resulted in the most positive spherical aberration compared to the other study lenses, but this did not correspond to a decrease in vision, possibly because the amount of positive spherical aberration was small and similar to the amount with no lens. Applegate et al. 17 showed that as root-mean-square (RMS) error increases by 0.05 mm, HCVA and LCVA decrease linearly for a single Zernike mode. They also reported that absolute levels of aberrations equivalent to 0.07 D and 0.12 D defocus reduced the number of letters read on a five-letter logMAR chart by 1.5-2.7 letters (about 0.03 to 0.05 logMAR). 17 As an approximation, the largest mean difference in total RMS error (low order and high order) in our study was between ND (0.75 mm) and AO (0.30 mm). The absolute magnitude of this difference is 0.45 mm, corresponding to an equivalent defocus of approximately 0.35D, if calculated over a 6.0 mm pupil. 17 Possible reasons this difference was not detected using the vision measures in this study could be due to the interaction between aberrations, which may have improved vision, 26,27 and/or the variability in visual acuity and contrast sensitivity testing. Test-retest variability of visual acuity measurements in normal subjects has been reported to be between ± 0.07 logMAR 28 and ± 0.16 logMAR, 29 and to be greater in the presence of small amounts of optical defocus. 30,31
In addition to the hypothesis driven analysis conducted, because of the relatively large number of outcome variables collected and the lack of clarity about how they might be related to each, exploratory data analysis was also conducted 32 using graphical methods, factor analysis, cluster analysis, linear discriminant analysis and regression tree methods. 33
Although there were numerous significant outcomes, few results were illuminating. However, with lens type as the outcome variable, two Zernike polynomials were able to significantly partition the lens group outcome.
The regression tree is shown in Figure 6 and illustrates that there were differences in (scotopic pupil) aberrations that could be used to separate the lens types. In this analysis, the outcome was lens type and the exploratory question was “can the aberration predictor variables separate lens type in a significant way?”. As is illustrated in this figure, with the BF lenses on, approximately 40 % of subjects had defocus ≤ −0.37 μm and when defocus was > −0.37 μm, spherical aberration was important. For example, in the lower right section of the graph, 40 % of subjects using ND had Z02 > −0.37 μm and Z04 > 0.01 μm. This type of analysis points to the combination being statistically able to separate the lenses and is not revealed in the scalar analyses carried out when testing hypotheses in the earlier “traditional” methods. Regression tree analysis revealed that the ratings could also be partitioned based on aberration structure, although this result was simpler. The regression tree explored whether the outcome could be predicted from a collection of predictor variables. The tree, however, only includes a small subset of the predictors. The predictors not included in the tree are of no value at any level in predicting the outcome and so, therefore, are excluded. Figure 7 shows that subject ratings that tended to be lower occurred in those with smaller measured Z04 (spherical aberration) components. This relationship is not clear when the two variables are plotted against each other (as in the scatterplot matrix in the upper left inset in Figure 7). Because of the large overlap in ratings, however, the separation of the two groups by the aberration is relatively poor. Large classification error rates were also produced when linear and quadratic discriminant analysis was used to group the six lenses.


An interesting finding was the relationship between lens modulus and defocus across lenses. Although not statistically significant, this does suggest that perhaps with more than the six lenses used in this experiment, this relationship could be demonstrably statistically significant. If this were the case, it would illustrate that physical, non-optical contact lens material characteristics do have (perhaps anticipated) optical effects as well.
There was no intentional gender sampling bias for our sample, however twenty-seven out of the thirty subjects in this study were female. Regardless, we do not feel that this impacted our results since differences between lenses were assessed within an individual, rather than across individuals. Additionally, within the mean age of subjects in this study, gender has not been associated with ocular aberrations 34 or refractive error. 35 There have been conflicting reports as to whether gender has an impact on corneal curvature. 36,37 Douthwaite et al. report that males have slightly flatter apical cornea compared to females. 37
A limitation of this study could be that vision testing was conducted under sctotopic conditions. The rationale for this was to maximize the pupil size for each individual in order to explore the relationship between vision and higher order aberrations. However, scotopic vision is dominated by rod photoreceptors, which may be impacted differently by ocular aberrations compared to photopic (cone-mediated) or mesopic (rod and cone-mediated) vision. 38 However, the acuity results suggest that even though luminance was low, vision was dominated by cone function.
Another limitation of this study was that lenses were assessed after a short (five-minute) settling period. Dumbleton et al. 39 investigated comfort and adaptation of various silicone hydrogel lenses and report that all lens types were reported by the subjects to have settled within 30 to 45 sec of insertion. Additionally, Brennan et al. 40 report that optimal predictability of lens fitting at eight hours was achieved five minutes after lens insertion, which has also been used as a settling time by others. 41 Therefore, while some lens designs, such as toric or multifocals may take longer to settle, it is believed that five-minutes is an adequate settling time for spherical lenses worn by adapted contact lens wearers our study. Other factors that could potentially affect visual and optical performance, such as lens wettability 18,42 and surface roughness, should also be considered. Minimal deposition would have been expected after such short periods of lens wear, however there is evidence that wettability with silicone hydrogel lenses can vary between materials. 43 While an attempt was made during waverfront aberrometry to minimize the effects of poor tear stability on the results, it cannot be ruled out that these factors did not play a role.
In summary, despite some differences in ocular aberrations, there were no statistically significant differences in HCVA, LCVA, contrast sensitivity or subjective vision ratings across lens types. More precise vision measurements or new metrics related to visual performance, including information on neural transfer functions, 44–46 may further our understanding of the clinical significance of changes in higher order aberrations with soft contact lens wear. 17
Conflict of interestThis study was supported by a Vistakon Research Grant through the American Optometric Foundation. The authors have no commercial or proprietary interest in the materials presented herein.


