
To study the prevalence of nearpoint vergence anomalies (convergence insufficiency, convergence excess and fusional vergence dysfunction) and association with gender, age groups, grade level and study site (suburban and rural).
MethodsThe study design was cross sectional and data was analyzed for 1201 high school students aged 13–19 years who were randomly selected from 13 high schools in uMhlathuze municipality. Of the total sample, 476 (39.5%) were males and 725 (60.5%) were females. The visual functions evaluated included refractive errors, heterophoria, near point of convergence, accommodative functions and fusional vergences. Possible associations between vergence anomalies and demographic variables (gender, age groups, school grade levels and study site) were explored.
ResultsPrevalence estimates were 11.8%, 6% and 4.3% for low suspect, high suspect and definite convergence insufficiency, and 1.9% for the pseudo convergence insufficiency. Convergence excess prevalence was 5.6%, and fusional vergence dysfunction was 3.3%. The prevalence of low suspect CI was significantly higher in suburban than in rural participants (p=0.01), the reverse was the case for pseudoconvergence insufficiency while the prevalence of convergence excess was significantly higher in the younger than in the older age group (p=0.02). No other category showed any statistically significant associations with vergence anomalies.
ConclusionThe prevalence estimates for vergence anomalies in a sample of black high school students in South Africa were relatively low. Only study location and age influenced some vergence anomalies. Identification and referrals are important steps toward diagnosis and treatment for vergence anomalies. Further studies to compare vergence anomalies in various racial populations will be relevant.
: Estudiar la prevalencia de las anomalías de vergencia del punto próximo (insuficiencia de convergencia, exceso de convergencia y disfunción de la vergencia fusional) y su asociación con las variables de sexo, grupos de edad, nivel del curso y ubicación del estudio (suburbana y rural).
MétodosEl diseño del estudio fue transversal, y se analizaron los datos de 1201 estudiantes de secundaria de edades comprendidas entre 13 y 19 años seleccionados al azar, en 13 escuelas de secundaria del municipio de uMhlathuze. De la muestra total, 476 (39,5%) participantes eran varones y 725 (60,5%) eran mujeres. Las funciones visuales evaluadas fueron: errores refractivos, heteroforia, punto próximo de convergencia, funciones acomodativas y vergencias fusionales. Se exploraron las posibles asociaciones entre las anomalías de vergencia y las variables demográficas (sexo, grupos de edad, niveles del curso escolar y ubicación del estudio).
ResultadosLos cálculos de la prevalencia fueron de 11,8%, 6% y 4,3% para la insuficiencia de convergencia de baja sospecha, alta sospecha y definitiva, y de 1,9% para la pseudo insuficiencia de convergencia. La prevalencia del exceso de convergencia fue del 5,6%, y para la disfunción de la vergencia fusional del 3,3%. La prevalencia de la insuficiencia de convergencia de baja sospecha fue considerablemente más elevada en los participantes del medio suburbano que en los del medio rural (p=0,01), contrariamente a la insuficiencia de pseudo-convergencia, mientras que la prevalencia del exceso de convergencia fue significativamente más elevada en el grupo joven que en el de mayor edad (p=0,02). Ninguna otra categoría reflejó asociaciones estadísticamente significativas con las anomalías de vergencia.
Conclusión: Los cálculos de la prevalencia en las anomalías de vergencia, en una muestra de estudiantes de secundaria de raza negra en Sudáfrica fueron relativamente bajos. Únicamente la ubicación del estudio y la edad influyeron en las anomalías de vergencia. La identificación y las referencias constituyen pasos importantes para el diagnóstico y tratamiento de las anomalías de vergencia. Serán pertinentes los estudios adicionales para comparar las anomalías de vergencia en diversas poblaciones raciales.
Vergence anomalies are disorders of binocular vision which result in either a failure of fusion or an inability to sustain comfortable bifoveal fixation.1 The focus of the current study was on vergence anomalies (VAs) such as convergence insufficiency (CI), convergence excess (CE) and fusional vergence dysfunction (FVD) which affect near functions. Convergence insufficiency (CI) is a non-strabismic binocular anomaly characterized by the eyes’ inability to accurately converge or sustain convergence for a considerable period of time when a near task is performed.2 Convergence excess (CE) is a binocular anomaly characterized by a tendency for the eyes to over converge at near.2 In fusional vergence dysfunction (FVD), there are deficiencies in the fusional vergence dynamics,2 characterized by inability of the fusional vergence system to respond rapidly and accurately to changing vergence demands over time.3
The ability to read and perform related near tasks comfortably involve an efficient accommodative and vergence system.1,2,4,5 This is relevant given that a great amount of time that a child spends on academic activities both at school and home entails using the accommodative–vergence mechanism.6,7 It has been reported that children with accommodative–vergence anomalies are at greater risk for reading and learning problems.4,7 Etiological factors in functional vergence anomalies relate to Skeffington's5 model of near point stress, which attributes the development of binocular dysfunctions to deficiencies in the relation between accommodative and vergence interactions.5 Such deficiencies and associated symptoms are primarily aggravated by prolonged visually demanding, near-centered tasks such as reading, writing or computer-based work.2,4,5 The symptoms in VAs that include blur vision at near, diplopia, eye strain, watery eyes, eyes tiring and headaches create discomfort, impair efficient near tasks and may affect a child's academic performance, intellectual development and overall quality of life.2,4 Other negative consequences associated (non-causal) with VAs include reported associations between CI and attention deficit hyperactivity disorder (ADHD), anxiety, emotional and social problems.7
Various studies8–29 on VAs have been conducted in school children in various racial or ethnic populations. Convergence insufficiency is the most researched, reported and most prevalent of the VAs. Two main classification systems were applied to define CI. When defined using a single-sign criteria9,14 such as receded near point of convergence (NPC), the prevalence of CI ranged between 5.2 and 33%. When defined using multiple clinical signs including exophoria, NPC and positive fusional vergence (PFV), the prevalence of total CI ranged between 2.1 and 33.3%.15–29 Clinically significant CI (CI with a minimum of two clinical signs) ranged between 8.4 and 18%.15–23 The prevalence of CE ranged between 0.8 and 15%.19–22 The prevalence of FVD was 0.4% and reported in only one study.22 Although previous studies were fairly consistent in the use of measurement techniques, the possible limitations include use of small sample size with a consequent poor precision and limited statistical power. In addition, most studies were conducted on children aged between 6 and 15 years while only the studies by Dwyer9 and Scheiman et al.22 conducted on clinic samples had participants up to 18 years old. More so, available studies on VAs9–29 were conducted mainly on Caucasian and Asian populations and studies conducted on white populations reported the influence of socio-economic status,8 gender,15 age,22 grade level13 race/ethnicity and study location8,16 on vergence anomalies. Overall, there is a paucity of data on the relation between VAs and the main epidemiological variables such as race, age, gender and socio-economic status in the black population. Thus, our study differs from previous ones9–29 as participants comprise a large sample of high school students aged between 13 and 19 years who were randomly selected from 13 high schools in a black South African population of relatively low socio-economic status. The high school population is of interest noting that the near task demands for primary school children may not be intense enough to aggravate many symptoms and cause VAs compared to high school students.4
Given the clinical importance of VAs, identifying and quantifying such anomalies is an important step in addressing the problems. Thus, the aim of the present study was to determine the prevalence and distribution of VAs, in relation to demographic variables including gender (male/females), age groups (13–16/17–19), school grade levels (8–10/11–12) and study site (suburban/rural). This study enabled identification of children at risk for binocular vision anomalies. Epidemiological data are useful in health policy planning particularly in resource allocations. These demographic variables are likely to influence VAs given that various studies8,15,16,22 have found such association. Thus, the evidence-based hypothesis we tested was that race, age, gender, grade levels and study location may affect VAs.
MethodsStudy designThis study was a cross sectional descriptive study designed to determine the prevalence, and distribution of vergence anomalies. The study protocol was approved by the Biomedical Research Ethics Committee of the University of KwaZulu-Natal Durban, South Africa. Written informed consents for access to the schools were obtained from the Department of Education and the school principals. Information sheets and consent forms, which were written in English language and the learners’ indigenous language (isi-Zulu) were distributed to all learners and their parents. The leaflets contained information which explained the purpose and procedure of the study. Parental consents and child assents were duly obtained from parents and students respectively. Overall, the conduct of the study complied with the Declaration of Helsinki regarding research on human subjects30 and data collection commenced only after ethical clearance was obtained.
Participants and study settingThe target population was black high school students in the uMhlathuze municipality. The study sample comprised high school students selected from 13 high schools out of a total of 60 high schools in the uMhlathuze municipality in the province of KwaZulu-Natal, South Africa. The sample comprised 1211 children (481 males and 730 females) and their ages ranged between 13 and 19 years. Participants were selected using stratified, multistage cluster, random sampling (from the municipality to classroom levels). Students that were of African descent and of either gender were eligible subjects for the study. Participants were excluded from the study if they had any systemic conditions such as diabetes, hypertension and multiple sclerosis, were on any systemic medication, or had amblyopia, suppression, strabismus, ocular diseases, nystagmus or vertical phoria.
Sample size determination and justificationThe sample size calculation was performed using the formula for a prevalence (descriptive) study.
Using the formula31:
where n=sample size; Zα=1.96=(CI: 95%) (level of significance); p=expected prevalence or proportion (in decimal point)=estimate of 17.9% prevalence of convergence anomalies from our pilot study.7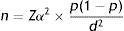
D=precision or margin of error (repeatability, consistency or reproducibility of a study finding, that is, how close the findings will be if the study is repeated several times.31
with a design effect of 1.8=(627×1.8)=1129 and additional 60 participants were added to the number to compensate for non-response, missing data and sub-group analysis thus making the required sample size to be 1189. This sample size was expected to give a power of 1.00 (that is, 100%) to detect significant differences among groups. Suppose that the probability of a Type II error (fail to reject a false null hypothesis) occurring is denoted by β, then power is equal to 1−β. Power is the probability of rejecting the null hypothesis when the alternative is in fact true.31Materials and procedure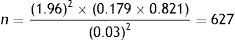
Students who returned the consent and assent forms were included in the study. A room was provided by the school principal at the school venue where the visual examinations were conducted. The purpose and procedure for every technique was fully explained to each participant before the start of the eye examination. To ensure that the participants understood all the instructions, trial testing was performed for complex tests such as accommodative facility and fusional vergences. The applicability and feasibility of all the techniques was confirmed in an earlier pilot study7 whose participants were not included in the main study. Validated optometric instrument and procedures were used as described in standard optometry books2,32 and used in previous studies.9–29 The test procedures and testing conditions across participants and study sites were standardized and an average of three test measurements were taken for near tests. Our earlier pilot study confirmed the suitability of all techniques.7 The screening techniques comprised two main stations. The techniques performed in the first station by trained personnel include case history, recording of participants’ demographic details, the case history and visual acuity measurement. The case history comprised information on the history of ocular and systemic conditions as well as the history related to near tasks.
Station two comprised measurement of the binocular functions by an optometrist. To minimize bias, the assistant who collected the participants’ demographic details worked independent of the optometrists, To eliminate potential inter-examiner variability, all tests were performed by one optometrist who is experienced in performing the techniques but not familiar with the classification criteria applied in the study. All vision testing was performed in the mornings between 8:30am and 1:30pm and over a period of one year between March 2013 and May 2014. The same conditions including test distances and room illumination were applied for all the sessions. Described in brief, the following tests were performed as described in standard optometry textbooks.2,32
Preliminary tests2,32: routine case history was taken and visual acuity was assessed for each eye using the Logarithm of Minimum Angle of Resolution (LogMAR) chart (Precision vision, USA) at both distance and near. Ocular health status was evaluated using a direct ophthalmoscope. Suppression was evaluated at near using the Worth-4-dot test (Bernell Corporation, Mishawaka Inc., USA). Stereoacuity was assessed using the Randot stereo test (Vision Assessment Corporation USA) and ocular motility was evaluated using the Broad-H-test.
Refractive errors were evaluated objectively using an autorefractor (MRK/3100; Huvitz) and subjectively using the phoropter. Cycloplegia was not applied as the study entailed several near tests and our intention was to evaluate students’ binocular vision status in their habitual state. All cases were treated as new although most students did not wear glasses. The starting point for subjective refraction was the autorefractor results and was performed monocularly and binocularly (with binocular balancing) to the best VA with maximum convex (positive) and minimum concave (negative) lenses. Astigmatic power and axis were refined using the Jackson crossed cylinder.
Vergence functions2,32: The near point of convergence (NPC) was measured using the Royal Air Force (RAF) rule33 with a vertical line target which was moved slowly toward the child. The break point was recorded for analysis when the child reported diplopia.2,32 The unilateral cover test was first performed to rule out strabismus. Distance and near heterophoria were evaluated using the von Graefe technique in a specially designed phoropter tripod using a single 20/30 Snellen letter target. Fusional vergences (positive and negative) were measured using a horizontal prism bar (Gulden B-16 horizontal prism bars-Gulden Ophthalmics, Elkins Park, PA) while the patient fixated a hand-held fixation target (Gulden fixation Stick #15302) with a single column of letters which correspond to a near visual acuity of 20/30 equivalent at a distance of 40cm. As vergence facility was not measured, another way of classifying vergence anomaly was to compare the magnitude of the blur/break/recovery values to representative values for race, age, gender. Accommodative and vergence tests were performed at 40cm, with the best refractive compensation in place. The tests were performed three times and average reading taken for analysis.
Accommodation functions2,32: The amplitude of accommodation (AA) was assessed using the Donder's push-up method with a Royal Airforce (RAF) near point rule.33 The target was a row of letters. As the target was moved slowly toward the participant, he was instructed to keep the letters clear and to report when the target become and remained blurry. The accommodation response (AR) was measured using the monocular estimated method (MEM) dynamic retinoscopy technique. The target was letters and/or pictures on the MEM card which was attached to the retinoscope. As the retinoscopic reflex was observed, spherical lenses were then interposed briefly until neutrality was achieved. Accommodative facility (AF) was assessed using the ±2.00D flipper lens. The test target was letters on a 6/9 range on a near point card. As the examiner flipped the lenses, the participant was instructed to report each time the print became clear. The number of cycles completed per minute was recorded. One cycle means clearing both the plus and minus lens sides. For relative accommodation, negative relative accommodation (NRA) was measured first followed by positive relative accommodation (PRA). The participant fixated on a reading target (letter size or picture) and reported when the letters became blurry, that is, not as clear and sharp as they were even if he could still read them (sustained blur) as the lenses were added. Positive lenses were added for NRA while negative lenses were added for PRA in 0.25D until sustained blur was reported.
All identified cases were referred to the optometrist or ophthalmologist.
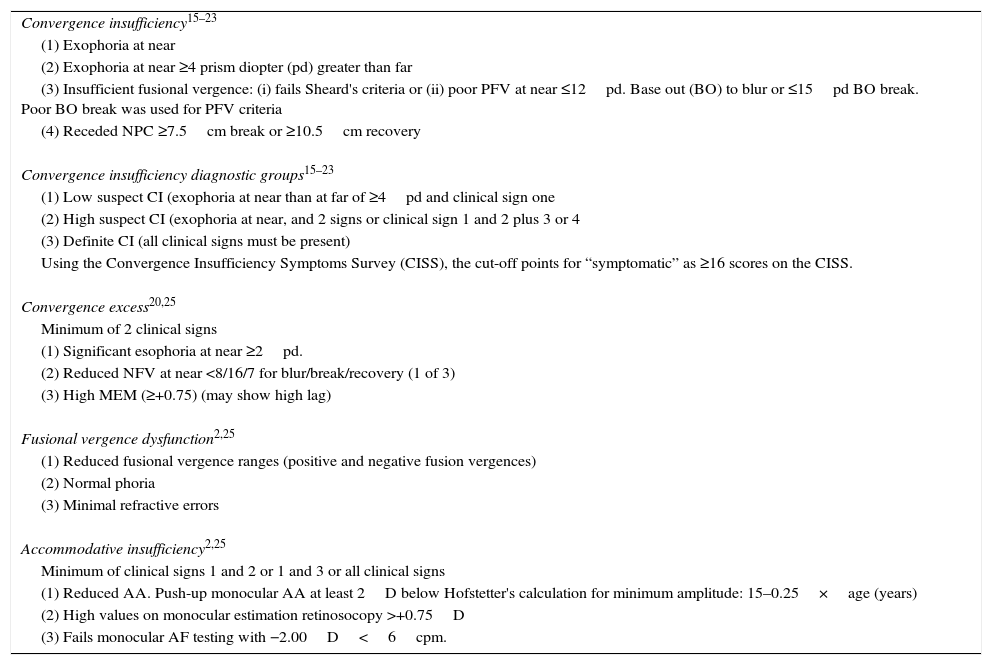
Classifications of outcome variablesThe primary outcome measures of the study were CI, PCI, CE and FVD. All outcome variables were classified based on criteria used in other studies (Table 1).9–29
Classification criteria for all anomalies.
| Convergence insufficiency15–23 |
| (1) Exophoria at near |
| (2) Exophoria at near ≥4 prism diopter (pd) greater than far |
| (3) Insufficient fusional vergence: (i) fails Sheard's criteria or (ii) poor PFV at near ≤12pd. Base out (BO) to blur or ≤15pd BO break. Poor BO break was used for PFV criteria |
| (4) Receded NPC ≥7.5cm break or ≥10.5cm recovery |
| Convergence insufficiency diagnostic groups15–23 |
| (1) Low suspect CI (exophoria at near than at far of ≥4pd and clinical sign one |
| (2) High suspect CI (exophoria at near, and 2 signs or clinical sign 1 and 2 plus 3 or 4 |
| (3) Definite CI (all clinical signs must be present) |
| Using the Convergence Insufficiency Symptoms Survey (CISS), the cut-off points for “symptomatic” as ≥16 scores on the CISS. |
| Convergence excess20,25 |
| Minimum of 2 clinical signs |
| (1) Significant esophoria at near ≥2pd. |
| (2) Reduced NFV at near <8/16/7 for blur/break/recovery (1 of 3) |
| (3) High MEM (≥+0.75) (may show high lag) |
| Fusional vergence dysfunction2,25 |
| (1) Reduced fusional vergence ranges (positive and negative fusion vergences) |
| (2) Normal phoria |
| (3) Minimal refractive errors |
| Accommodative insufficiency2,25 |
| Minimum of clinical signs 1 and 2 or 1 and 3 or all clinical signs |
| (1) Reduced AA. Push-up monocular AA at least 2D below Hofstetter's calculation for minimum amplitude: 15–0.25×age (years) |
| (2) High values on monocular estimation retinosocopy >+0.75D |
| (3) Fails monocular AF testing with −2.00D<6cpm. |
All data were entered on Microsoft Excel, checked by the first author and thereafter imported into and analyzed by a statistician using the Statistical Package for Social Sciences (SPSS) version 21. Descriptive statistics were presented as means, standard deviation and median. The Pearson chi-squared test was performed to test for differences in proportions for categorical variables among groups. The two sample t-test was applied to examine differences in the means between groups while the analysis of variance (ANOVA) was applied to compare differences in means among groups. Multinomial logistic regressions were used to examine odds ratios and multivariate associations. Distributions of variables were presented using tables. Proportions and corresponding 95% confidence intervals were presented as an estimate of the prevalence. A significance level of 5% was applied.
ResultsSample characteristicsA total of 1211 out of 1230 returned their consent forms were included. Ten learners were excluded. Of those excluded seven had amblyopia, one was diabetic, one had glaucoma and one had corneal scars due to trauma. Thus, data was analyzed for 1201 children, which supposes a response rate of 97.6%. The participants mean age was 16.27±1.79 and median age was 16 years, 476 (39.5%) were males and 725 (60.5%) were females; 631 (52.5%) were aged 13–16 years (younger age group) while 570 (47.5%) were 17–19 years old (older age group). Furthermore, the sample comprised 803 (66.86%) students from grades 8 to 10 (lower grade level) and 398 (33.14%) from grades 11 to 12 (higher grade level), 810 (67.4%) participants from eight suburban schools and 391 (32.7%) from five rural schools.
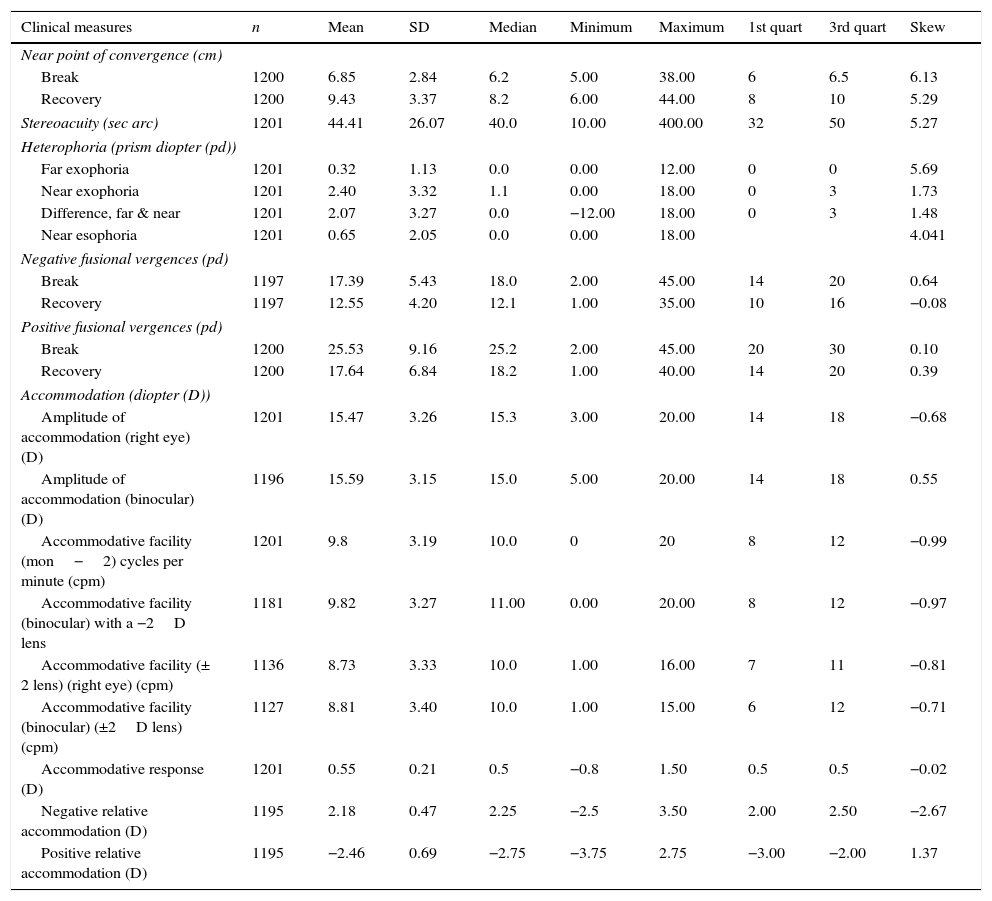
Descriptive statistics (mean, SD and median) for all variablesOne student could not complete the NPC tests, 4 could not complete the NFV and one could not complete the PFV test (Table 2). All participants whose data were analyzed had normal near visual acuity (N5). The mean distance visual acuity of the right eye was 0.035±0.49 and left eye was 0.035±0.42. The mean spherical refraction: right eye −0.01±0.43 and left eye 0.01±0.33. For fusional vergences, the break points were used for analysis as the blur points reported by participants were inconsistent.
Descriptive statistics for all variables.
| Clinical measures | n | Mean | SD | Median | Minimum | Maximum | 1st quart | 3rd quart | Skew |
|---|---|---|---|---|---|---|---|---|---|
| Near point of convergence (cm) | |||||||||
| Break | 1200 | 6.85 | 2.84 | 6.2 | 5.00 | 38.00 | 6 | 6.5 | 6.13 |
| Recovery | 1200 | 9.43 | 3.37 | 8.2 | 6.00 | 44.00 | 8 | 10 | 5.29 |
| Stereoacuity (sec arc) | 1201 | 44.41 | 26.07 | 40.0 | 10.00 | 400.00 | 32 | 50 | 5.27 |
| Heterophoria (prism diopter (pd)) | |||||||||
| Far exophoria | 1201 | 0.32 | 1.13 | 0.0 | 0.00 | 12.00 | 0 | 0 | 5.69 |
| Near exophoria | 1201 | 2.40 | 3.32 | 1.1 | 0.00 | 18.00 | 0 | 3 | 1.73 |
| Difference, far & near | 1201 | 2.07 | 3.27 | 0.0 | −12.00 | 18.00 | 0 | 3 | 1.48 |
| Near esophoria | 1201 | 0.65 | 2.05 | 0.0 | 0.00 | 18.00 | 4.041 | ||
| Negative fusional vergences (pd) | |||||||||
| Break | 1197 | 17.39 | 5.43 | 18.0 | 2.00 | 45.00 | 14 | 20 | 0.64 |
| Recovery | 1197 | 12.55 | 4.20 | 12.1 | 1.00 | 35.00 | 10 | 16 | −0.08 |
| Positive fusional vergences (pd) | |||||||||
| Break | 1200 | 25.53 | 9.16 | 25.2 | 2.00 | 45.00 | 20 | 30 | 0.10 |
| Recovery | 1200 | 17.64 | 6.84 | 18.2 | 1.00 | 40.00 | 14 | 20 | 0.39 |
| Accommodation (diopter (D)) | |||||||||
| Amplitude of accommodation (right eye) (D) | 1201 | 15.47 | 3.26 | 15.3 | 3.00 | 20.00 | 14 | 18 | −0.68 |
| Amplitude of accommodation (binocular) (D) | 1196 | 15.59 | 3.15 | 15.0 | 5.00 | 20.00 | 14 | 18 | 0.55 |
| Accommodative facility (mon−2) cycles per minute (cpm) | 1201 | 9.8 | 3.19 | 10.0 | 0 | 20 | 8 | 12 | −0.99 |
| Accommodative facility (binocular) with a −2D lens | 1181 | 9.82 | 3.27 | 11.00 | 0.00 | 20.00 | 8 | 12 | −0.97 |
| Accommodative facility (± 2 lens) (right eye) (cpm) | 1136 | 8.73 | 3.33 | 10.0 | 1.00 | 16.00 | 7 | 11 | −0.81 |
| Accommodative facility (binocular) (±2D lens) (cpm) | 1127 | 8.81 | 3.40 | 10.0 | 1.00 | 15.00 | 6 | 12 | −0.71 |
| Accommodative response (D) | 1201 | 0.55 | 0.21 | 0.5 | −0.8 | 1.50 | 0.5 | 0.5 | −0.02 |
| Negative relative accommodation (D) | 1195 | 2.18 | 0.47 | 2.25 | −2.5 | 3.50 | 2.00 | 2.50 | −2.67 |
| Positive relative accommodation (D) | 1195 | −2.46 | 0.69 | −2.75 | −3.75 | 2.75 | −3.00 | −2.00 | 1.37 |
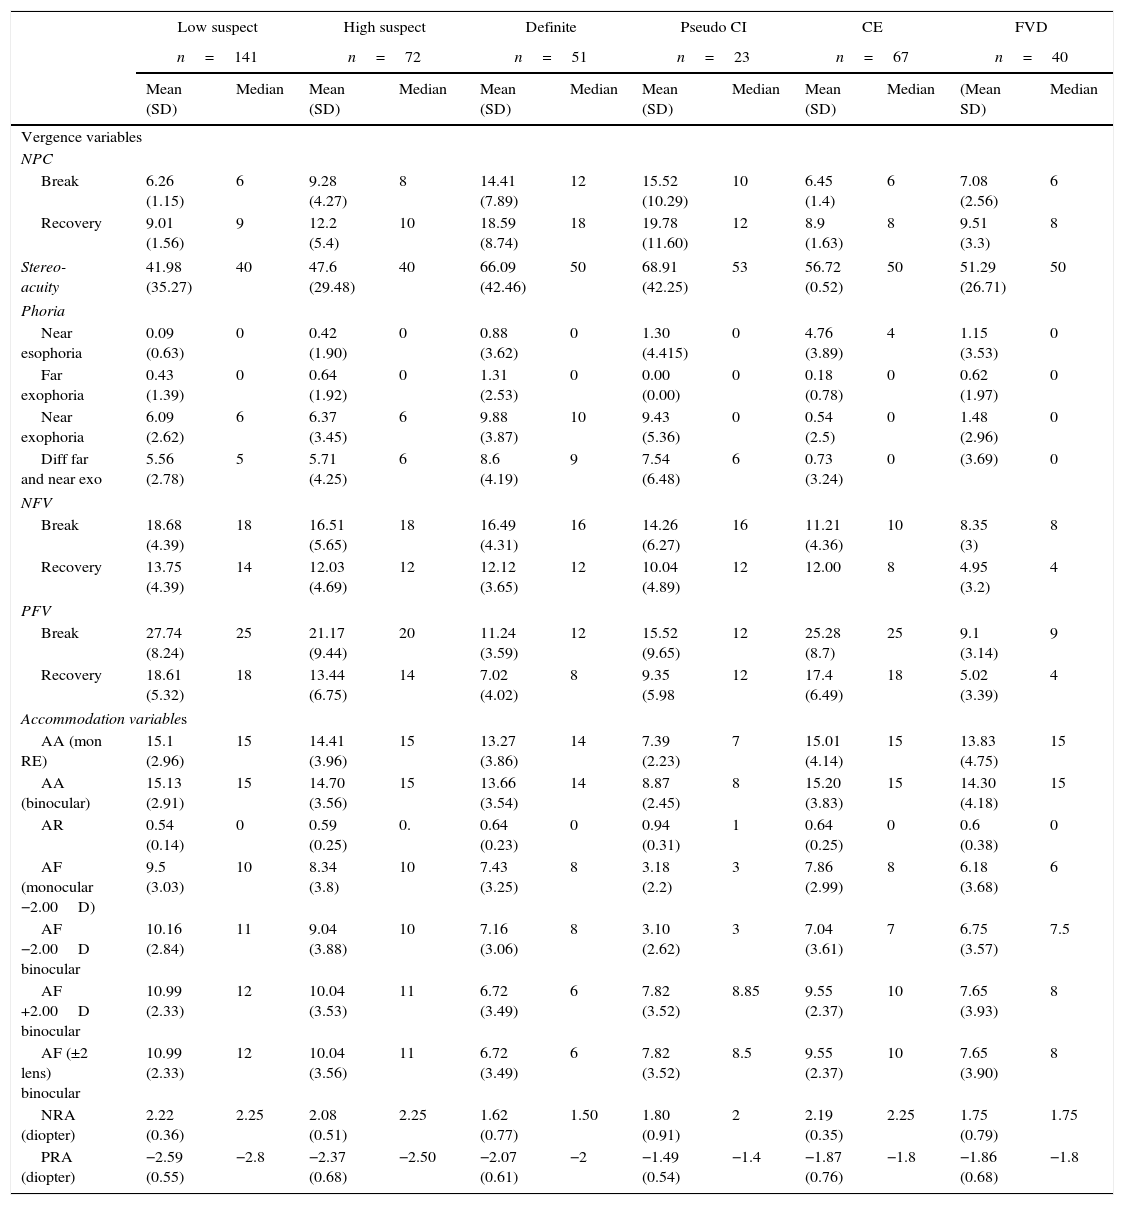
Data were analyzed to determine the extent to which accommodative–vergence parameters were influenced by vergence anomalies by comparing overall means (Table 2), with means for the vergence anomalies (Table 3). The main clinical measures for CI variables (NPC, near exophoria and PFV) were influenced by severity of the CI as the NPC was more receded; no significant change for CI-I (p=1.00) though NPC was significantly receded for CI-2 and CI-3. [ANOVA F(3, 1186)=249.76, p=0.00)] Regarding convergence recovery; no significant change was found for CI-I (p=1.00) but it significantly poorer in CI-2 and CI-3 [ANOVA, F(3, 1186)=248.32, p=0.00)]. Near exophoria increased significantly with the severity of all CI [ANOVA, F(3, 1189)=527.17, p=0.00)]. The PFV break reduced (became poorer) significantly for CI-2 and CI-3, [ANOVA, F(3, 1188)=58.95, p=0.00)] as the severity increased. However, break and recovery did not change significantly (break, p=0.37 and recovery, p=1.00) for CI-I. Similarly, both monocular and binocular AA reduced significantly with severity of the CI especially with CI-2 and CI-3 under monocular [ANOVA, F(3, 1185)=13.10, p=0.00)] and [ANOVA, F(3, 1184)=11.25, p=0.00)] and binocular conditions. There was no change for CI-1 (p=0.185 for monocular and (p=0.07) under binocular conditions. The lag of accommodation increased (poorer) but significantly only for CI-3 [ANOVA, F(3, 1179)=4.16, p=0.006)] and the AF decreased but significantly for only CI-3 [ANOVA, F(3, 1177)=26.40, p=0.00)].
Mean, standard deviation and median of the vergence and accommodation anomalies variables.
| Low suspect | High suspect | Definite | Pseudo CI | CE | FVD | |||||||
|---|---|---|---|---|---|---|---|---|---|---|---|---|
| n=141 | n=72 | n=51 | n=23 | n=67 | n=40 | |||||||
| Mean (SD) | Median | Mean (SD) | Median | Mean (SD) | Median | Mean (SD) | Median | Mean (SD) | Median | (Mean SD) | Median | |
| Vergence variables | ||||||||||||
| NPC | ||||||||||||
| Break | 6.26 (1.15) | 6 | 9.28 (4.27) | 8 | 14.41 (7.89) | 12 | 15.52 (10.29) | 10 | 6.45 (1.4) | 6 | 7.08 (2.56) | 6 |
| Recovery | 9.01 (1.56) | 9 | 12.2 (5.4) | 10 | 18.59 (8.74) | 18 | 19.78 (11.60) | 12 | 8.9 (1.63) | 8 | 9.51 (3.3) | 8 |
| Stereo-acuity | 41.98 (35.27) | 40 | 47.6 (29.48) | 40 | 66.09 (42.46) | 50 | 68.91 (42.25) | 53 | 56.72 (0.52) | 50 | 51.29 (26.71) | 50 |
| Phoria | ||||||||||||
| Near esophoria | 0.09 (0.63) | 0 | 0.42 (1.90) | 0 | 0.88 (3.62) | 0 | 1.30 (4.415) | 0 | 4.76 (3.89) | 4 | 1.15 (3.53) | 0 |
| Far exophoria | 0.43 (1.39) | 0 | 0.64 (1.92) | 0 | 1.31 (2.53) | 0 | 0.00 (0.00) | 0 | 0.18 (0.78) | 0 | 0.62 (1.97) | 0 |
| Near exophoria | 6.09 (2.62) | 6 | 6.37 (3.45) | 6 | 9.88 (3.87) | 10 | 9.43 (5.36) | 0 | 0.54 (2.5) | 0 | 1.48 (2.96) | 0 |
| Diff far and near exo | 5.56 (2.78) | 5 | 5.71 (4.25) | 6 | 8.6 (4.19) | 9 | 7.54 (6.48) | 6 | 0.73 (3.24) | 0 | (3.69) | 0 |
| NFV | ||||||||||||
| Break | 18.68 (4.39) | 18 | 16.51 (5.65) | 18 | 16.49 (4.31) | 16 | 14.26 (6.27) | 16 | 11.21 (4.36) | 10 | 8.35 (3) | 8 |
| Recovery | 13.75 (4.39) | 14 | 12.03 (4.69) | 12 | 12.12 (3.65) | 12 | 10.04 (4.89) | 12 | 12.00 | 8 | 4.95 (3.2) | 4 |
| PFV | ||||||||||||
| Break | 27.74 (8.24) | 25 | 21.17 (9.44) | 20 | 11.24 (3.59) | 12 | 15.52 (9.65) | 12 | 25.28 (8.7) | 25 | 9.1 (3.14) | 9 |
| Recovery | 18.61 (5.32) | 18 | 13.44 (6.75) | 14 | 7.02 (4.02) | 8 | 9.35 (5.98 | 12 | 17.4 (6.49) | 18 | 5.02 (3.39) | 4 |
| Accommodation variables | ||||||||||||
| AA (mon RE) | 15.1 (2.96) | 15 | 14.41 (3.96) | 15 | 13.27 (3.86) | 14 | 7.39 (2.23) | 7 | 15.01 (4.14) | 15 | 13.83 (4.75) | 15 |
| AA (binocular) | 15.13 (2.91) | 15 | 14.70 (3.56) | 15 | 13.66 (3.54) | 14 | 8.87 (2.45) | 8 | 15.20 (3.83) | 15 | 14.30 (4.18) | 15 |
| AR | 0.54 (0.14) | 0 | 0.59 (0.25) | 0. | 0.64 (0.23) | 0 | 0.94 (0.31) | 1 | 0.64 (0.25) | 0 | 0.6 (0.38) | 0 |
| AF (monocular −2.00D) | 9.5 (3.03) | 10 | 8.34 (3.8) | 10 | 7.43 (3.25) | 8 | 3.18 (2.2) | 3 | 7.86 (2.99) | 8 | 6.18 (3.68) | 6 |
| AF −2.00D binocular | 10.16 (2.84) | 11 | 9.04 (3.88) | 10 | 7.16 (3.06) | 8 | 3.10 (2.62) | 3 | 7.04 (3.61) | 7 | 6.75 (3.57) | 7.5 |
| AF +2.00D binocular | 10.99 (2.33) | 12 | 10.04 (3.53) | 11 | 6.72 (3.49) | 6 | 7.82 (3.52) | 8.85 | 9.55 (2.37) | 10 | 7.65 (3.93) | 8 |
| AF (±2 lens) binocular | 10.99 (2.33) | 12 | 10.04 (3.56) | 11 | 6.72 (3.49) | 6 | 7.82 (3.52) | 8.5 | 9.55 (2.37) | 10 | 7.65 (3.90) | 8 |
| NRA (diopter) | 2.22 (0.36) | 2.25 | 2.08 (0.51) | 2.25 | 1.62 (0.77) | 1.50 | 1.80 (0.91) | 2 | 2.19 (0.35) | 2.25 | 1.75 (0.79) | 1.75 |
| PRA (diopter) | −2.59 (0.55) | −2.8 | −2.37 (0.68) | −2.50 | −2.07 (0.61) | −2 | −1.49 (0.54) | −1.4 | −1.87 (0.76) | −1.8 | −1.86 (0.68) | −1.8 |
NFV=negative fusional vergence; PFV=positive fusional vergence; AA=amplitude of accommodation; mon=monocular; RE=right eye; AF=accommodative facility; AR=Accommodative response; NRA=negative relative accommodation; PRA=positive relative accommodation.
Regarding CE, near esophoria was significantly increased (t=14.05, p=0.00) and both NFV break and recovery were significantly reduced (poorer); mean break (t=−9.875, p=0.00) and recovery (t=−10.572, p=0.00). For NFV, both break and recovery were significantly reduced (poorer); break, (t=−12.226, p=0.00) and recovery (t=−12.630, p=0.00). There was no significant change in both monocular and binocular AA (binocular, t=0.79, p=0.12). However, both monocular and binocular AF decreased significantly (binocular, ±2.00D, t=2.24, p=0.013) while lag of accommodation increased significantly (t=−3.95, p=0.00).
For FVD, when compared to the overall mean, the mean clinical measures became significantly poorer (Table 3). Negative fusional vergence break and recovery were significantly reduced; break (t=−11.248, p=0.00) and recovery (t=−12.363, p=0.00). Both PFV break and recovery were significantly reduced, break (t=−12.226, p=0.00) and recovery (t=−12.630, p=0.000). Monocular and binocular AA decreased significantly (binocular, t=2.54, p=0.006), AF (binocular, ±2.00D, t=2.14, p=0.006) while there was no significant change with AR (p=0.06).
Convergence insufficiency with accommodative insufficiency, also referred to as pseudo-convergence insufficiency (PCI), has been described as a separate type of CI26,27 thus data was analyzed separately. In PCI, the mean NPC break was most receded compared to other VAs and the mean NPC break and recovery in PCI were significantly more receded; break (t=16.636, p=0.00) and recovery, 19.78 (t=16.449, p=0.00) compared to overall mean. Near exophoria was significantly increased (t=10.750, p=0.00), PFV break and recovery were reduced (poorer) significantly, break, (t=−5.348, p=0.00) and recovery (t=−5.957, p=0.00). Accommodation amplitude were significantly reduced, (monocular (t=12.798, p=0.00), binocular AA (t=10.817, p=0.00)), lag of accommodation increased significantly (t=−8.862, p=0.00) and AF reduced significantly (t=3.860, p=0.00).
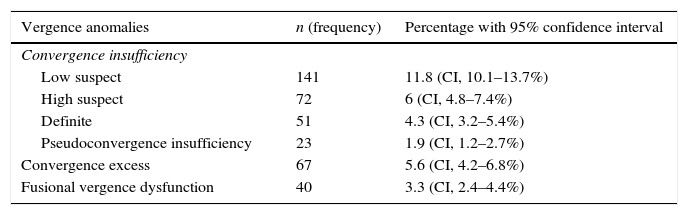
Prevalence of vergence anomaliesThe prevalence of vergence anomalies and 95% confidence interval (CI) is indicated in Table 4. The prevalence of clinically significant convergence insufficiency (CI) (that is, CI with a minimum of two clinical signs, high suspect and definite CI) was 10.3%.
Prevalence of vergence anomalies.
| Vergence anomalies | n (frequency) | Percentage with 95% confidence interval |
|---|---|---|
| Convergence insufficiency | ||
| Low suspect | 141 | 11.8 (CI, 10.1–13.7%) |
| High suspect | 72 | 6 (CI, 4.8–7.4%) |
| Definite | 51 | 4.3 (CI, 3.2–5.4%) |
| Pseudoconvergence insufficiency | 23 | 1.9 (CI, 1.2–2.7%) |
| Convergence excess | 67 | 5.6 (CI, 4.2–6.8%) |
| Fusional vergence dysfunction | 40 | 3.3 (CI, 2.4–4.4%) |
The prevalence of accommodative insufficiency (AI) was 4.5% and there was a significant association between CI and AI (χ2=49.114, df=3, p=0.001). Pearson correlation coefficient analysis revealed a significant positive relation between CI and AI (r=0.175) (p=0.000) which implied that the higher the value of CI, the higher the value of AI. The distribution of vergence anomalies in relation to gender, age, grade levels and study site is shown in Table 5.
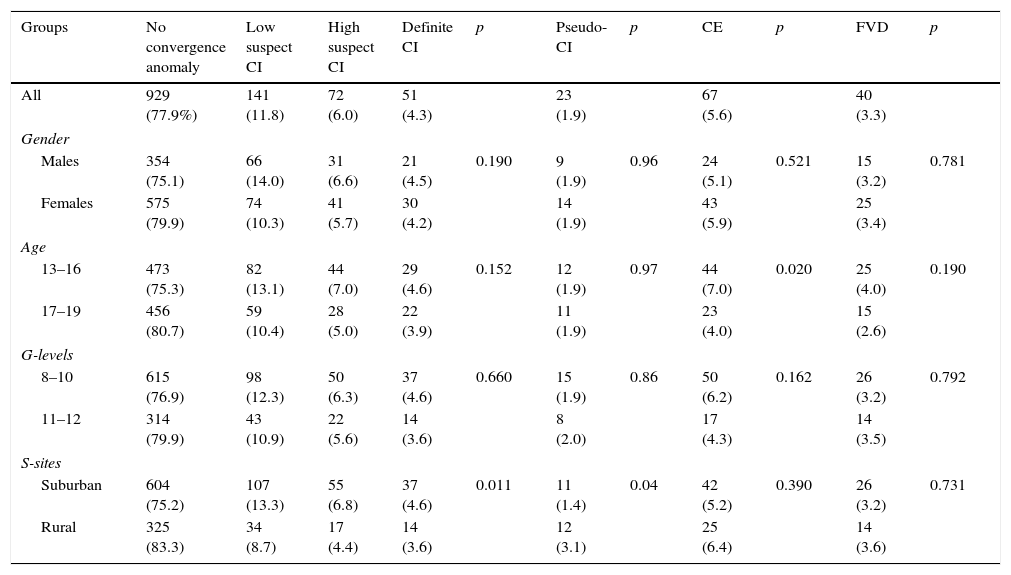
Distribution (n %) of vergence anomalies according to gender, age groups, grade levels and study site.
| Groups | No convergence anomaly | Low suspect CI | High suspect CI | Definite CI | p | Pseudo-CI | p | CE | p | FVD | p |
|---|---|---|---|---|---|---|---|---|---|---|---|
| All | 929 (77.9%) | 141 (11.8) | 72 (6.0) | 51 (4.3) | 23 (1.9) | 67 (5.6) | 40 (3.3) | ||||
| Gender | |||||||||||
| Males | 354 (75.1) | 66 (14.0) | 31 (6.6) | 21 (4.5) | 0.190 | 9 (1.9) | 0.96 | 24 (5.1) | 0.521 | 15 (3.2) | 0.781 |
| Females | 575 (79.9) | 74 (10.3) | 41 (5.7) | 30 (4.2) | 14 (1.9) | 43 (5.9) | 25 (3.4) | ||||
| Age | |||||||||||
| 13–16 | 473 (75.3) | 82 (13.1) | 44 (7.0) | 29 (4.6) | 0.152 | 12 (1.9) | 0.97 | 44 (7.0) | 0.020 | 25 (4.0) | 0.190 |
| 17–19 | 456 (80.7) | 59 (10.4) | 28 (5.0) | 22 (3.9) | 11 (1.9) | 23 (4.0) | 15 (2.6) | ||||
| G-levels | |||||||||||
| 8–10 | 615 (76.9) | 98 (12.3) | 50 (6.3) | 37 (4.6) | 0.660 | 15 (1.9) | 0.86 | 50 (6.2) | 0.162 | 26 (3.2) | 0.792 |
| 11–12 | 314 (79.9) | 43 (10.9) | 22 (5.6) | 14 (3.6) | 8 (2.0) | 17 (4.3) | 14 (3.5) | ||||
| S-sites | |||||||||||
| Suburban | 604 (75.2) | 107 (13.3) | 55 (6.8) | 37 (4.6) | 0.011 | 11 (1.4) | 0.04 | 42 (5.2) | 0.390 | 26 (3.2) | 0.731 |
| Rural | 325 (83.3) | 34 (8.7) | 17 (4.4) | 14 (3.6) | 12 (3.1) | 25 (6.4) | 14 (3.6) | ||||
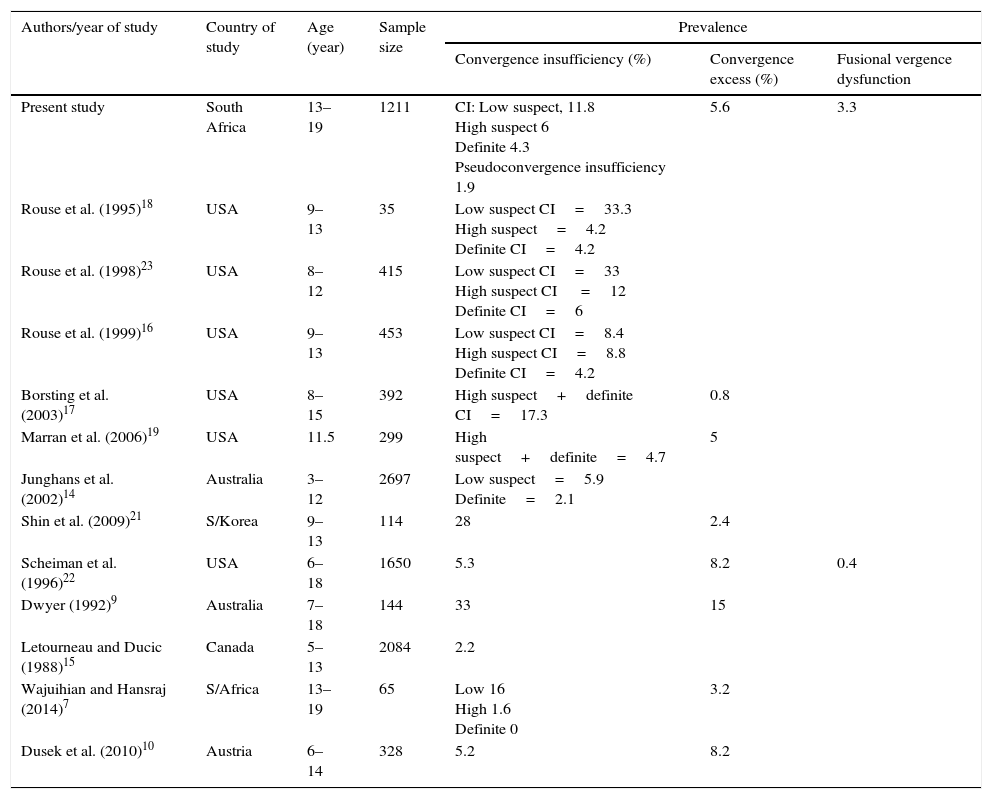
There are variations in the prevalence of vergence anomalies found in different studies (Table 6).
Summary of studies on vergence anomalies.
| Authors/year of study | Country of study | Age (year) | Sample size | Prevalence | ||
|---|---|---|---|---|---|---|
| Convergence insufficiency (%) | Convergence excess (%) | Fusional vergence dysfunction | ||||
| Present study | South Africa | 13–19 | 1211 | CI: Low suspect, 11.8 High suspect 6 Definite 4.3 Pseudoconvergence insufficiency 1.9 | 5.6 | 3.3 |
| Rouse et al. (1995)18 | USA | 9–13 | 35 | Low suspect CI=33.3 High suspect=4.2 Definite CI=4.2 | ||
| Rouse et al. (1998)23 | USA | 8–12 | 415 | Low suspect CI=33 High suspect CI =12 Definite CI=6 | ||
| Rouse et al. (1999)16 | USA | 9–13 | 453 | Low suspect CI=8.4 High suspect CI=8.8 Definite CI=4.2 | ||
| Borsting et al. (2003)17 | USA | 8–15 | 392 | High suspect+definite CI=17.3 | 0.8 | |
| Marran et al. (2006)19 | USA | 11.5 | 299 | High suspect+definite=4.7 | 5 | |
| Junghans et al. (2002)14 | Australia | 3–12 | 2697 | Low suspect=5.9 Definite=2.1 | ||
| Shin et al. (2009)21 | S/Korea | 9–13 | 114 | 28 | 2.4 | |
| Scheiman et al. (1996)22 | USA | 6–18 | 1650 | 5.3 | 8.2 | 0.4 |
| Dwyer (1992)9 | Australia | 7–18 | 144 | 33 | 15 | |
| Letourneau and Ducic (1988)15 | Canada | 5–13 | 2084 | 2.2 | ||
| Wajuihian and Hansraj (2014)7 | S/Africa | 13–19 | 65 | Low 16 High 1.6 Definite 0 | 3.2 | |
| Dusek et al. (2010)10 | Austria | 6–14 | 328 | 5.2 | 8.2 | |
According to reports, some optometrist found the single sign definition of CI useful either as NPC, PFV and exophoria24 and Sheard's criterion has also been recommended.28 The single criteria or cut-offs for clinical measures which were not prioritized in the Convergence Insufficiency and Reading Study (CIRS) group classification system were analyzed. The findings included: 829 (68.5%) had NPC break of 6cm or less, 221 (18.2%) had NPC of 7–8cm, 73 (6.2%) participants had a value ≥10cm. For phoria, 193 (16.0%) had exophoria at near ≥6pd, 1008 (84.0%) had exophoria less than 6pd.
Sheard's criterionA total of 6.2% failed Sheard's criterion (fusional reserve=2×phoria minimum).2 As expected, definite CI had the highest failure (82.4%), followed by PCI (56.5%) and high suspect CI (20.8%) while 8 low suspect cases (5.7%) failed Sheard's criterion.
Distribution of vergence anomalies by gender, age groups, grade level, and study siteIn a multinomial logistic model fitted for VAs types on groups, children in suburban schools were 1.618 times more likely to have low suspect CI than those in rural schools (Odd ratio (OR)=1.61, 95% CI, 1.06–2.46) and the difference was significant (χ2=10.27, df=1, p=0.02 logistic regression). For CE, frequency was significantly higher in the younger than in the older age group (p=0.02). Students in the older age group were 0.953 times less likely to have CE than those in the younger age group (OR 0.953, 95% CI, 0.26–1.04, χ2, 4.907, df=1, p=0.05 logistic regression).
With respect to FVD, there was no significant association between age and FVD (p=0.19). However, students in the older age group were 0.399 times less likely to have FVD than those in the younger age group (OR 0.399, 95% CI, 0.15–1.004, χ2=4.03, df=1, p=0.04, logistic regression). Regarding PCI, participants in the rural group had a significantly higher frequency of PCI than those in the suburban group (p=0.00). Students in the suburban schools were 0.415 times less likely to have PCI than those in rural schools (OR 0.415, 95% CI, 0.17–0.97, χ2=4.11, df=1, p=0.04, logistic regressions). Gender did not influence vergence anomalies.
DiscussionIn this epidemiological survey, a study on the prevalence of VAs in high school students is reported. The prevalence estimates of VAs were: clinically significant CI 10.4%, PCI 1.9%, CE 5.6% and FVD 3.3%. The prevalence of low suspect CI was significantly higher in suburban than in rural participants while CE was significantly more prevalent among younger than in older students.
In relation to previous studies, the prevalence of 11.8% for low suspect CI in the current study is lower than estimates found in some studies,18,23 and higher than those found in others.14,16 (Table 6) The prevalence of 6% of high suspect CI in our study is higher than findings by Rouse et al.18 but lower than in other reports.16,17,23 (Table 6). The differences between our findings and other studies may be related to methodological differences. For example, the study by Rouse et al.23 was based on retrospective review of clinical records in a University Optometry Clinic which may be prone to selection bias, while the possible reason for a relatively high finding (12.7%) for high suspect CI by Borsting et al.17 compared to our findings may be related to the use of 30cm instead of 40cm testing distance to measure near PFV. Moving the testing distance from 40cm to 30cm may have caused an approximate 5pd reduction in positive fusional range17 with a consequent increased failure rate on the PFV component. For definite CI, the prevalence of 4.3% in current study is similar to results from other studies.17–19 (Table 6) Furthermore, a 4.9% frequency of definite CI reported among black participants in the study by Borsting et al.17 is comparable to our finding of 4.3%. An interesting observation in our sample means (Table 2) is that the mean NPC for high suspect CI is 9.28cm±4.27 (Table 2) was higher than reports from other studies which include Rouse et al.,23 (5.2cm±4.9), Rouse et al.16 (4.8±3.6), Marran et al.19 (6.17±4.14) and Borsting et al.17 (3.92±3.90cm). The possible explanation is that in the present study, the NPC was measured using RAF rule which has been reported to yield higher NPC break values than other techniques.33
Relating our VAs compared to previous studies, our 5.6% prevalence of CE is similar to the 5% reported by Marran et al.19 and higher than findings from some studies20,21 and lower than those found in others.10,22 Both studies by Scheiman et al.22 and Dusek et al.10 were based on clinical samples and may have been subjected to selection bias. Another perspective is that single signs such as receded NPC have traditionally been applied to define CI and remain relevant in the literature.9,14 Using the receded NPC criteria, our finding of 6.2% for NPC ≥10cm is similar to 6% reported by Abdi et al.12 but lower than results from other studies with findings ranging between 8.3 and 18.1%.9,14 The 15% frequency for 8cm found in the current study is lower than 11% (defined as 7.5cm) reported by Junghans et al.,14 and 6.2% (≥7.5cm) by Rouse et al.23
Our prevalence estimates may be interpreted in the context of the functional etiology of VAs. Thus, assuming that high school students are expected to have higher near task demands and therefore possible higher prevalence of VAs,4 a lower prevalence of high suspect CI in our study compared to previous reports16,17 suggests a difference in nature, intensity and duration of near task demands. In addition, 11.3% of low suspect CI may imply that higher proportion of students may have clinically significant CI under additional near task demands.
There was no significant difference in refractive errors between students from suburban and rural schools. Thus, an alternative explanation is that from the functionality perspective, a higher prevalence of low suspect CI in suburban than in rural participants suggest that the suburban participants are engaged in more prolonged near tasks. A lack of significant age difference in the distribution of CI agrees with findings by Letourneau et al.11 but contrasts with those by Abdi et al.12 Only Scheiman et al.22 (with participants aged between 6–18 years old) analyzed data based on age groups and found a significant difference in prevalence of CI and age. The difference in findings between Scheiman et al.22 and our study may be related to the difference in the way participants’ ages were classified. Scheiman et al.22 classified age as preschool and school-aged while our study comprised only high school students with restricted age range of between 13 and 19 years. Regarding CI and gender, the present and previous studies are consistent on the lack of significant difference in gender distribution of CI.16,17,22,23 For CE, Scheiman et al.22 found a significantly higher prevalence (8.4%) of CE among Caucasians than Blacks (6%) compared to the 5.6% finding in the present study. In the present study, a significantly higher prevalence of CE in younger than in older students may be related to a higher frequency of esophoria in the younger age group (7.0%) than in the older group (4.0%) (Table 5). A lack of significant difference in neither age nor gender for FVD in the present study agrees with the report by Scheiman et al.22
The prevalence of PCI in the current study was 1.9% and there was a significant positive correlation between CI and AI. This 1.9% prevalence is lower than the 3.3% reported by Marran et al.19 Pseudo-convergence insufficiency is a vergence anomaly which results from a person's inability to converge due to insufficient accommodative ability.26,27 This syndrome has been attributed to a central nervous defect that affects both the accommodative and convergence mechanisms.26,27 Reports on the gender distribution of PCI are mixed. We found no significant difference between males and females in PCI. Our findings contrasts with the report by Mazow et al.26 who found a higher frequency in females than males. In other studies, Manty (cited in Mazow et al.)26 found female preponderance of PCI whereas Duane (cited in Mazow et al.)26 found the frequency of PCI to be higher in males than females. Pseudo-convergence insufficiency may create some therapeutic challenge as conventional treatment for CI does not completely resolve unless some accommodative therapy are initiated.15,26
Overall, differences in the findings on the prevalence and distribution of vergence anomalies across studies may be due to differences related to study designs including criteria, and measurement techniques, as well as diet, weather, age, race/ethnicity, genetic factors and near task demands. We are unable to make any inference on the relationship between race and VAs as the present study comprised only black students. More conclusive evidence may be derived by studying racial difference in vergence anomalies in participants from different racial groups in one study.
Study limitations, strengths, implication and applicationAlthough applied in some studies,19,25 using the von Graefe technique to assess heterophoria and fusional vergence would have allowed for consistency in approach but we used von Graefe and prism bars as in our pilot study7 we confirmed the non-suitability of the rotary prim fusional vergence technique in a school setting. However, the negative influence of such inconsistency in approach is unknown. Besides, the prism bar is a preferred tool in a screening setting as it is quicker, allows the view of eye movement and easier for school-aged children to follow instructions.4 Inconsistencies in the diagnostic criteria for VAs has been raised.34 However, this may not be a concern in our study as we applied validated diagnostic system in the present study and findings were related to previous studies based on a broad definition which included the CIRS, single-sign criteria and the Sheard's criterion. Another possible limitation is that we were unable to derive a consistent assessment of the students’ socio-economic status. The students’ records of parental income were inconsistent and there was no statistics on the socio-economic status from the municipal authorities, thus our assessment of socio-economic status was anecdotal.
The possible strengths of the present study include a firm research design and eligibility criteria. The recruitment process was followed tightly to obtain 13 high schools were selected using random sampling, large sample size and a high statistical power. Validated and reliable equipment were used for testing, the response rate was high (at >90%) and only one examiner performed all optometric eye examinations. Measures were also taken to minimize bias. Thus, the study has high internal and external validity and is likely to be representative, and can be extrapolated to the target population of high school children aged between 13 and 19 years in the municipality.
Our study has implications for, and applications in, screening for binocular anomalies. Although challenging, screening for binocular anomalies remains the only strategic way to identify such anomalies in school-aged children especially for those who are less opportune to consult an independent optometrist. Screenings for vergence anomalies are important for identification, diagnosis and treatment of anomalies. Findings will be useful in clinical practice, research, optometric education and health policy administration.
ConclusionThe prevalence of VAs among black students is relatively low. Although gender, age, grade levels and study location did not remarkably influence VAs in the sample studied, identification and referrals are important steps toward diagnosis and treatment of VAs. The present study enhances our understandings on epidemiology of VAs in a sample of high school students in a black South African population. Further studies to determine VAs across racial groups will be relevant.
Conflicts of interestNone of the authors have any proprietary interests or conflicts of interest related to this submission.
We are grateful to Nqobile Hlengwa (optometrist) for collecting data and Vusi Shandu (the research assistant) for assistance with overall logistics duties and Prof. B.M. Zungu and Mr. K.P. Mashige for reviewing earlier drafts of the manuscript.


