


The dynamic optotype (DYOP) visual acuity (VA) test is based on motion detection rather than element resolution and has been proposed for routine clinical assessment. This investigation examined the validity, inter- and intra-session repeatability and subjective preference for the DYOP versus a static letter chart and examined its utility in detecting astigmatic defocus.
MethodsVA of 103 participants was measured three times with the letter and DYOP charts and repeated within two weeks in 75 participants who also rated their subjective experience. The VA of 29 participants was measured using DYOP, letter, Landolt C, and Tumbling E charts, with habitual correction and astigmatism induced with +1.00, +2.00 or +3.00 cylinders at 45, 60, 90 and 180°.
ResultsThe charts differed by a mean of 0.02 logMAR, with 81% of the measurements within one line of acuity. Inter-session, intraclass correlation coefficients, within-subject SD and repeatability were 0.03 logMAR, 0.95, 0.11 and 0.30 versus 0.01 logMAR, 0.92, 0.15 and 0.42 for the DYOP and letter charts, respectively. The DYOP was significantly more frustrating (1.79 vs.1.36), with 59% preferring the letter chart. The DYOP was least affected by induced astigmatism.
ConclusionsThe DYOP and letter charts differed significantly in their mean values with wide limits of agreement. DYOP had better within-subject SD and narrower limits of agreement between sessions, though clinically insignificant, and performed significantly worse for the detection of uncorrected astigmatism. Thus, it is difficult to recommend this test for the clinical determination of refractive error.
Visual acuity (VA) is important as an efficacious measure, a safety endpoint,1 to evaluate disease progression,2 and to assess visual performance under varying conditions,3 as well as for carrying out certain vocations.3 It is most commonly assessed clinically using static optotypes. However, a new method of measurement using a kinetic optotype has been proposed, called the DYOP or dynamic optotype (dyop.info).4-6 The test target is made up of rings comprising eight black and white alternating square-wave segments, presented on a 50% grey background. The width of the ring and the size of the segments are one-fifth of the total diameter, similar to standard static VA optotypes. VA is measured with a two-alternative forced choice (2AFC) paradigm, presenting two DYOPs, side by side. One of the two DYOPs spins (i.e., is dynamic) at a rate of 40 revolutions per minute (see Fig. 1). Observers are asked to detect which of the two DYOPs is spinning, as well as the direction of rotation (clockwise or counter-clockwise). The overall optotype size (i.e., diameter) is decreased until the direction of motion can no longer be detected.6
, and the direction of rotation (clockwise or counter-clockwise).")
The “Dyop” visual acuity target. 4-6 One of the targets is rotating, while the other is stationary. The observer is required to indicate which of the targets is spinning (right or left), and the direction of rotation (clockwise or counter-clockwise).
Previous work has shown a significant correlation between VA assessed with the DYOP target and conventional measurements obtained using Sloan6 and Tumbling E optotypes7 in adults, as well as Lea numbers in children.4 It has also been reported that refraction values obtained using the DYOP target are not significantly different from those obtained using Snellen optotypes.8
However, prior studies comparing the DYOP test with conventional clinical procedures did not analyze the interchangeability of the methods using Bland-Altman analysis,9,10 and some did not report confidence intervals or mean differences. Further, the usefulness of clinical tests is often determined by assessments of their repeatability and/or validity,11 and these previous studies did not assess the intra-test variability or inter-session repeatability of the VA charts.4,6,7,12,13
In addition, a major consideration for VA charts as a clinical tool is their ability to detect uncorrected refractive error.14 This is important at the beginning of the refractive examination, as well as for verification of the final refractive correction. Although uncorrected astigmatism has been shown to be linearly associated with VA,15-18 its relationship with the form of the optotype has not been investigated. It may be hypothesized that uncorrected astigmatism differentially affects visual resolution of a circular target (such as the DYOP) when compared with rectilinear targets (such as a letter E, F, T or H). The latter may be particularly evident when the axis of astigmatism results in the orientation of the focal line on or closest to the retina corresponding with the direction of a critical element in the optotype being resolved. Such an example might be a case of against-the-rule, simple myopic astigmatism, where the horizontal focal line will be positioned on the retina, thereby potentially helping resolution of horizontal targets. Furthermore, there appears to be little or no previous work detailing the impact of uncorrected astigmatism on VA measurements using the DYOP target. While the strong association between static VA and refractive error is well established,19,20 the effect of ametropia on VA measurements using kinetic optotypes requires further clarification before the use of a moving target for the quantification of a refractive correction can be supported.
Accordingly, two studies are presented here. The first examined the variability of two consecutive VA measurements obtained using the DYOP and static letter charts as well as the variation between measurements taken at separate sessions using the same test.21 Participants were also surveyed regarding their subjective preference for the DYOP versus the letter charts. The second investigation examined the utility of varying optotype charts (letters, Landolt Cs, Tumbling Es and DYOPs) in the detection of astigmatic defocus.
MethodsExperiment 1. Validation, inter-session reproducibility and intra-session repeatabilityThis study included 103 participants (mean age: 29.2 ± 9.8 years; range: 20-60 years; 82 female, 21 male) recruited from the student body and faculty of Hadassah Academic College (HAC) in Jerusalem, Israel. Participants with corrected VA worse than logMAR 0.00, ocular pathology or systemic diseases that may affect VA were excluded. Subjects wearing soft contact lenses were asked to remove their lenses at least one hour prior to examination. Rigid gas permeable contact lens wearers were not included.
Participants with uncorrected VA of 0.00 logMAR or better were examined without correction, and participants requiring a refractive correction to achieve VA of 0.00 logMAR or better were tested with their correction in place. Examinations took place in the refraction clinics at the Department of Optometry, HAC. All procedures were performed in accordance with the Declaration of Helsinki, and the study was approved by the HAC Institutional Review Board. Written informed consent was obtained from each subject following a full explanation of the nature and risks of the procedures.
VA testing was carried out with the monitor positioned at and calibrated for a viewing distance of three meters. DYOP and letter VA charts were presented using Chart2020 software (Chart2020.com) installed onto a Dell Optiplex 960 (dell.com) computer, and displayed on a 17-inch LG Flatron L1760TR (lg.com/uk/support/product/lg-L1760TR-BF) LCD Monitor with a 60Hz vertical refresh rate and a resolution of 1280 × 1024 pixels. The only room lighting was that generated by the LCD screen. Data were collected from the right eye only, while the subject's left eye was occluded throughout the study.
The order of testing was counterbalanced across subjects such that one subject was initially tested with the letter chart followed by the DYOP and the next was initially tested with the DYOP followed by the letter chart. Five trials of each DYOP size were tested, i.e., five pairs of DYOPs were presented for each DYOP size. Subjects were asked to detect the direction of rotation correctly in at least three of the five stimulus presentations to advance to a smaller DYOP diameter. Note that as the DYOP is progressively reduced in size, its overall diameter is reduced. DYOP acuity threshold was determined as the size above which the subject was no longer able to detect three out of the five presentations. Similarly, static letter acuity was determined as the size in which the subject was no longer able to detect three out of the five optotypes. VA was measured three times for each chart. The letters presented were randomly generated by the software so that they varied between presentations.
To determine the inter-session repeatability, study procedures were repeated, one to two weeks after the initial session in a subset of participants (N=75, mean age: 30.0± 9.8, range: 20-59 years; 59 female, 16 male). During the second study visit, following each VA chart measurement, participants were asked to complete a self-administered questionnaire regarding their experience. The questionnaire (Fig. 2) included four questions graded by the participants using a Likert-scale. The second questionnaire also inquired about their personal preference for VA measurement (see Fig. 2).
 asking participants to select their preferred VA test.")
Subjective self- administered questionnaire. The questionnaire contained four questions graded using a Likert-scale regarding the subjective experience and was filled out following each VA chart measurement. The second questionnaire also included a fifth question (gray row) asking participants to select their preferred VA test.
The correlation between the mean of the VA measurements obtained with the DYOP and static letter charts was examined using the Pearson test. If data were significantly correlated, then they were assessed for interchangeability using Bland-Altman plots. These plots depicted the mean difference (Md) and 95% confidence intervals (CI) calculated as Md ± 1.96 X standard deviation (SD), which specifies the interval within which 95% of the differences between the measurements for the two sessions was expected to fall (95% limits of agreement).10
Intra-test variability was assessed by calculating both the SDs of the three measurements from each test during the first session22 and the intra-class correlation coefficient (ICC). Inter-session repeatability was evaluated by applying a one-way analysis of variance (ANOVA), from which the within subject SD (i.e., the repeatability of the measurements) was determined.23 The within-subject standard deviation (Sw) was defined as the square root of the within-subject variance, which was calculated as the within-subject sum of squares divided by its degrees of freedom. Repeatability was calculated as 1.96*Sw*√2.24 The questionnaire was assessed using descriptive statistics (means, standard deviations) to determine the preferred subjective method of testing. A paired t-test compared the answers for each chart.
Experiment 2. Detection of astigmatic defocusThis study was performed on 29 optometry students at the SUNY College of Optometry (mean age: 25.0 ±1.6, range: 18-30 years, 18 female, 11 male). All procedures were performed in accordance with the Declaration of Helsinki, and the protocol was approved by the Institutional Review Board of SUNY College of Optometry. Written informed consent was obtained from each subject following a full explanation of the nature and risks of the procedures.
Participants had best corrected distance and near VA of logMAR 0.00 or better in each eye and binocularly, and no history of strabismus or manifest ocular disease. A series of monocular VA tests were carried out using a computerized acuity chart positioned at and calibrated for a viewing distance of three meters. The various charts described below were presented using Chart2020 software (Chart2020.com) installed onto a Dell Optiplex 760 (dell.com) computer, and displayed on a 19-inch ViewSonic VA1930WM (viewsonic.com) color monitor. Data were collected from the right eye only, while the subject's left eye was occluded throughout the study. A Pioneer Deluxe trial frame (pioneerstudent.com) was worn at a back vertex distance of 12mm, having a pantoscopic tilt of approximately 10°, to allow the interposition of supplementary cylindrical lenses over the subject's habitual refractive correction (which was placed into the rear cells of the trial frame).
VA was recorded through the habitual refractive correction using four charts. These comprised a high contrast (≈ 90%) letter chart, a Landolt C chart, a Tumbling E chart and the DYOP targets.6 In the Landolt C and Tumbling E charts, optotypes were presented in one of four orientations (up, down, left or right). The DYOP test was presented in a 2AFC paradigm with participants asked to identify which optotype was rotating as well as the direction of the rotation (clockwise or counter-clockwise). All charts were presented in logMAR format, with every letter being scored, and the endpoint taken when subjects were unable to read a single letter within a line.
Subsequent to these baseline measurements with the habitual refractive correction (“baseline”), VA was recorded using all four charts with induced astigmatism. Astigmatism was imposed by the use of supplementary cylindrical trial lenses that were added over the habitual distance refractive correction. Either +1.00, +2.00 or +3.00 cylinders were added, at an axis of either 45, 60, 90 or 180°. The order of testing for the cylinder powers, axes and chart types was counterbalanced across subjects. In view of the number of VA assessments required, only one measurement of VA was taken for each combination of lens power, axis position and chart condition. One examiner (AHK) measured VA with all four charts under all astigmatic conditions.
Statistical analysisMeans and standard deviations of the VA were calculated. VAs obtained with the different test charts under the varying conditions (chart, cylinder power, cylinder axis) were compared using a three factor ANOVA. The gradient of VA as a function of cylinder power was calculated for each testing procedure and cylinder axis, and the gradients compared using two-factor (axis and testing method) ANOVA. Tukey post-hoc testing was applied for significant results. A p-value <0.05 was considered significant.
ResultsValidationMean VA (± SD) recorded with the DYOP and letter charts from the first session (N=103) was -0.02 (0.10) and -0.04 (0.14), respectively. These values were significantly different (paired t-test =2.18, p=0.03). VA measurements from the DYOP and logMAR letter charts were significantly correlated (R = 0.79, p< 0.001). Thus, interchangeability was assessed using Bland-Altman analysis (Fig. 3). The mean difference between the measurements from the two VA charts was 0.02, with 95% confidence intervals ranging between +0.19 and -0.15 logMAR.
. The central blue line represents the mean difference between the measurements. The upper and lower red lines represent the upper and lower 95% confidence intervals.")
Bland-Altman plot representing the difference between the DYOP and letter VA measurements for each of the 103 participants (diamonds). The central blue line represents the mean difference between the measurements. The upper and lower red lines represent the upper and lower 95% confidence intervals.
The results of the sub-group of 75 participants who were measured in two experimental sessions with both charts were compared using a two factor (test type and session) repeated measures ANOVA. There was a significant effect of test type (Fdf=1,74= 29.44, p<0.001) and a significant interaction between test type and session (Fdf=1,74= 10.90, p<0.002). Post-hoc testing revealed that the VA measurements using the two charts were different in Session 1 (p<0.001), but not in Session 2 (p=0.76). The VA recorded in the first experimental session from the sub-group of 75 participants that were re- measured in the second experimental session had a mean difference of 0.01 (95% confidence intervals: -0.15 to 0.19 logMAR). The VA recorded in the second experimental session with both charts differed by a mean of 0.00 (95% confidence intervals -0.18 to 0.18 logMAR). Further, the mean VAs recorded in the first and second experimental sessions differed by 0.01 logMAR (95% confidence intervals: -0.16 to 0.18 logMAR).
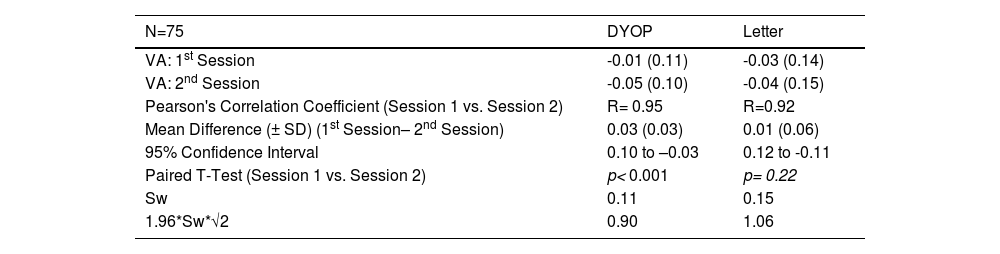
Intra-test variabilityTable 1 tabulates the mean (± SD) VA measurements obtained from 75 participants who were re-measured with both charts one to two weeks after their initial assessment. The intraclass correlation coefficients for the DYOP and letter charts were 0.95 (95% CI, 0.91-0.97) and 0.92 (95% CI, 0.88-0.95), respectively. The within subject standard deviation (Sw) and repeatability (1.96*Sw*√2) for the DYOP and letter charts were 0.11 and 0.30 and 0.15 and 0.42, respectively.
Mean (± SD) VA in LogMAR, Pearson's correlation coefficients, mean difference and confidence intervals (in LogMAR) and Sw, within subject standard deviation obtained from 75 participants that were measured in both the first and second experimental sessions.
The table also specifies the results of T-tests comparing between the DYOP and letter charts for the first session and second sessions.
As shown in Table 1, the measurements for the two sessions were significantly different for the DYOP chart (paired t-test, p< 0.001) but not different for the letter chart (p= 0.22). A significant correlation was observed between the first and second session VA measurements for the DYOP (R=0.95, p < 0.001) and letter (R=0.92, p < 0.001) charts. For the DYOP chart, the mean difference (± SD) between the two measurements was 0.03 ± 0.04, with confidence intervals ranging between +0.10 and -0.03 logMAR. For the letter chart, the mean difference between the measurements was 0.01 ± 0.06, with confidence intervals ranging between +0.12 and -0.11 logMAR. The within session standard deviation (Sw) and repeatability (1.96*Sw*√2) for the DYOP and letter charts were very similar for the two chart types.
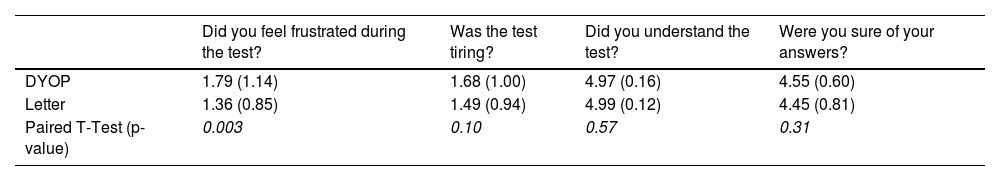
QuestionnaireThe mean scores for each question and the p-values of the paired t-tests comparing the responses for each VA chart are tabulated in Table 2. There was a significant difference (paired t-test, p=0.003) between the mean response for the DYOP and the letter charts only for the question pertaining to frustration during the test. A grade of “1” represents not being frustrated and “5” represents feeling very frustrated. The mean score for the DYOP and the letter charts for this question was 1.79 and 1.36, respectively. Further, 44 (59%) vs. 31 (41%) participants preferred the letter chart as opposed to the DYOP chart.
Detection of astigmatic defocusMean levels of logMAR VA (±SD) without supplementary cylindrical lenses for the Tumbling E, Landolt C, DYOP and letter charts were -0.01 (0.09), 0.00 (0.09), 0.03 (0.08) and -0.02 (0.06), respectively. One-factor analysis of variance indicated no significant difference between these values (F3,155 = 2.43; p = 0.07). Mean levels of VA as a function of added cylinder power for the four charts tested are illustrated in Fig. 4. Three factor (chart, cylinder power, cylinder axis) analysis of variance indicated that all of these factors were statistically significant (Chart: F3,1507 = 136.05; p <0.001; cylinder power: F2,1507 = 519.45; p <0.001; cylinder axis: F3,1507 = 56.00; p <0.001). Post-hoc analysis using the DYOP test without additional cylinder as the reference indicated that the three cylinder powers (1, 2 and 3D), four cylinder axes (45, 60, 90 and 180°) and four charts (DYOP, Landolt C, Snellen and Tumbling E) were significantly different from one another (all p<0.001).
 as a function of added cylinder power at axes of 45, 60, 90 and 180° for each of the 4 charts tested.")
The slope of VA as a function of added cylinder power was calculated for each condition, and the mean gradients are provided in Table 3. Two factor analysis of variance indicated that the effect of both the chart (F3,463 =57.79; p <0.001) and the cylinder axis (F3,463 =10.24; p <0.001) on the gradient was significant. Examination of Fig. 4 indicates that the data for the 180° cylinder axis differed from the findings for the other three axes. Indeed, if the 180° data is excluded from the analysis, then there was no significant difference between the data for the three remaining axes, i.e., 45°, 60° and 90° (F2,347 = 0.92; p = 0.40). However, significant differences between the chart types were still found (F3,347 = 43.71; p <0.001). Post-hoc testing using the Tukey test revealed that differences between the DYOP test and the other charts were significant (p <0.01). However, the differences in mean slopes for the remaining three charts (Landolt C, letter and Tumbling E) were not significant (p > 0.05).
Mean (±SD) slopes for the linear functions shown in Fig. 4 (logMAR / D).
The two studies reported in this investigation examined the interchangeability, intra-test variability, inter-test repeatability, the subjective preference for the DYOP versus the static letter chart, as well as the effect of astigmatism, when compared with letter, Landolt C and Tumbling E charts.
Validation studyThe mean VA measurements obtained with the DYOP (-0.02) and letter (-0.04) charts were significantly different from one another, with a mean difference of 0.02 log units. The mean VA measurements obtained with each chart in the sub-group of participants that took part in the inter-session repeatability experiment were significantly different only in the first session (p<0.001), but not in the second session or the mean of the measurements from both sessions. In these comparisons, the mean difference between the measurements of the two charts was 0.02 logMAR. As the value of each optotype on a logMAR chart is equivalent to 0.02,15,25 this mean difference equated to one optotype, which was not deemed clinically significant. Nevertheless, a significant correlation was observed between the findings of the two charts. For example, in the first session with 103 participants, R = 0.79 and p< 0.00001. Further, for the subset of 75 participants who repeated the procedure, the respective R values for the first session, second session and mean of both sessions were 0.78, 0.80 and 0.81, respectively (all p< 0.00001). The confidence intervals of the difference between the charts ranged between +0.19 and -0.15 logMAR for the first session (N=103), which is equivalent to 3.4 lines on the acuity chart. While this difference is clinically significant, the majority (81%) of the measurements fell within ± one line of acuity. These confidence intervals were equally wide for the sub-group of 75 participants from the inter-session repeatability study.
Previous studies have also reported wide confidence intervals for conventional VA tests when compared with the DYOP charts. For example, in a study of 160 children between 4 and 17 years of age, limits of agreement of -0.13 to +0.11 logMAR (2.4 lines of acuity) were reported between the DYOP and an Early Treatment Diabetic Retinopathy Study (ETDRS) Lea numbers chart.4 Limits of agreement of -0.09 to +0.19 logMAR (2.8 lines of acuity) were found between the DYOP and a Tumbling E chart in 150 participants with a mean age of 58.7±14.3.7 Furthermore, limits of agreement ranging between -0.24 and +0.22 logMAR (4.6 lines of acuity) were reported between the DYOP and Snellen acuity charts in 40 participants aged 19-28.8 As such, the wide confidence intervals reported in the present investigation are consistent with previously reported limits of agreement between the DYOP and static letter charts. As noted earlier, the variability of clinical acuity charts may have significant clinical implications.26,27
Inter-session repeatabilityThe VA measurements recorded using the DYOP and letter charts from the first and second measurement sessions demonstrated similar mean values with mean differences of only 0.03 (1.5 optotypes) and 0.01 (0.50 optotype), respectively. In addition, the findings of the two sessions were significantly correlated for each test (R=0.95 and R= 0.92, respectively). However, the confidence intervals obtained for the two sessions for the DYOP and letter charts were +0.10 to -0.03 (1.3 lines) and +0.12 to -0.11 (2.3 lines), respectively. This indicates better inter-session repeatability for the DYOP chart.
There was no statistically significant difference between the mean visual acuity recorded using the letter chart during the first and the second experimental sessions. In contrast, there was a statistically significant difference between the mean DYOP measurements obtained in the two experimental sessions. This difference might be attributed to less familiarity with the DYOP testing procedure. Participants, especially optometry students and faculty, are very familiar with static VA test charts, but generally less familiar with dynamic testing procedures.
Intra-test variabilityThe DYOP demonstrated superior intra-test variability. However, the difference between the within subject standard deviation for the two charts was equivalent to approximately two optotypes on the chart, which is not clinically significant.
Subjective preferenceA previous study noted that subjects were able to see smaller Landolt Rings, when compared with DYOPs matched for overall diameter and gap width.39 However, the authors also noted that the DYOP target exhibited a significantly steeper logistic regression curve, indicating a more precise break between seeing and not seeing,
The present investigation further assessed participants’ subjective experience with the DYOP chart using a questionnaire. Findings showed that the DYOP test is slightly but significantly more frustrating than the logMAR letter test (1.79 vs. 1.36; p = 0.003). This difference (approximately 0.5 point) is probably not significant clinically. In addition, both tests were rated with a mean score of less than two points, indicating very little frustration. Further, 59% of the respondents preferred the letter chart for testing as opposed to the DYOP chart. Once again, the higher frustration score and lower preference for the DYOP test might be explained by the fact that participants were more familiar (and therefore more comfortable) with letter recognition than motion detection acuity. Additionally, the first sub-study in this investigation presented each DYOP optotype size three consecutive times before progressing to a smaller size. Participants may have found this procedure tedious and reflected this feeling in their frustration score. It would be of interest to determine if these subjective preferences change as subjects become more familiar with the DYOP test.
Utility in detection of astigmatismExamination of Fig. 4 and Table 3 indicates that the effect of induced astigmatism on VA measured with the DYOP target was significantly different to the other three optotypes. While the gradient of the association between cylinder power and VA was around 0.16-0.20D/logMAR unit for the letter, Tumbling E and Landolt C charts (for introduced cylinder axes of 45, 60 and 90°), it was only 0.08D/logMAR unit for the DYOP chart. Thus, the DYOP target is less affected by the presence of uncorrected astigmatism. Accordingly, it seems likely that this is a poor target for the subjective quantification of astigmatism, since many patients would lack sufficient sensitivity to detect the small changes in VA that would take place when viewing a DYOP. The more conventional targets are superior, because a unit amount of uncorrected astigmatism will produce a greater decline in VA.
This observation of the lesser impact of induced blur on the DYOP target is also consistent with the findings of Hayes et al.12 These authors examined the effect of induced spherical blur on DYOPs and Landolt C optotypes. They described the slopes of psychometric functions plotted for each participant in order to extract the respective visual acuity threshold (the 50% point of the function) for each condition. Had the authors plotted the mean visual acuity threshold as a function of induced blur, their findings would be in line with the findings of the present investigation, namely that DYOPs were less impacted by induced blur.
It is possible that the characteristics of the DYOPs used here may not be optimally suited for clinical VA measurements. The DYOP rate of rotation was determined by the manufacturer based on internal studies indicating that the optimal rotation speed is 40 rotations per minute. It is unclear whether this rotation speed has been evaluated systematically.28,29 Indeed, the same question arises with regard to the number of segments in the DYOP.
In addition, the findings demonstrate that creation of with-the-rule astigmatism following the introduction of a supplementary plus cylinder at an axis of 180° produced significantly better VA when compared with equivalent powered cylinders at the other three orientations. This was true for all of the four optotypes tested in the experiment. The observation that with-the-rule astigmatism results in better VA than against-the rule astigmatism has also been shown in other investigations.30,31 With-the-rule, simple myopic astigmatism will place the vertical focal line on or close to the retina, thereby making vertically orientated targets appear in focus. Indeed, Bannon and Walsh wrote that for the recognition of letters, “vertical strokes are the most important”.32 This was also demonstrated graphically by Williamson-Noble in the form of photographs of Snellen optotypes taken through lenses that induced either with- or against-the rule astigmatism.33 These pictures verified the improved legibility of letters when the vertical strokes were clearer than the horizontal elements.
One might consider that the Landolt C or the DYOP, being circular targets, should not be affected by this orientation bias. Alternatively, with- and against-the-rule astigmatism might be expected to attenuate VA equally. The data illustrated in Fig. 4 clearly demonstrates that this was not the case. Both the present investigation and Reich and Ekabutr34 found that induced with-the-rule astigmatism provided better mean VA, when compared with induced against-the-rule astigmatism. Schrauf and Stern measured visual resolution using Landolt C targets with eight different gap locations, and observed that the number of correct responses was lowest when the gap was in the 6 o'clock position, and highest when the gap was in the 3 o'clock position.35 This result suggests that factors other than optical blur influence the legibility of these round optotypes. These authors questioned whether subjects actually use the highest spatial frequency of the target to detect the gap, or base their decision on asymmetry of the entire letter. Further, they hypothesized that visual field asymmetries may account for variations in processing different gap locations. Specifically, the right visual field has been shown to be better at detecting local features, while the left visual field is better at more global processing.36 Finally, based on their habitual refractive error, subjects may have an inherent bias for blur in a particular direction. For example, individuals with natural with-the-rule astigmatism (as would be expected in young subjects37) when uncorrected may have adapted to this direction of retinal blur, thereby displaying improved acuity when experiencing their habitual direction of ametropia, irrespective of the optotype being used. Indeed, of the 21 subjects tested in this portion of the study whose habitual spectacle prescription included an astigmatic component, 13 (62%) had with-the rule astigmatism, with four (19%) and four (19%) exhibiting oblique, or against-the rule astigmatism, respectively.
Study limitationsThis investigation has limitations. The validation study analyzed the mean data of three consecutive measurements, whereas clinical measurements are typically only performed once. As such, the results may not reflect clinical measurements completely. Additionally, because all of the subjects were correctable to logMAR 0.0 or better, then the range of measured acuity was quite narrow. Different results might have been obtained had a wider range of VA been tested. Further, in the validation study, in order to match the five optotypes in each line of the letter chart, three presentations of DYOP pairs (one rotating, and one static) for a particular LogMAR value were shown. This introduced an asymmetry in the measurement, in which three choices were requested in the DYOP test compared with five for the letter chart. Furthermore, the duration of the DYOP measurements were inherently longer. These asymmetries in the testing procedures may have impacted the participants’ subjective impression of the DYOP test contributing to its increased grade of frustration and reduced subjective preference.
In both studies, pupil size was neither monitored nor controlled, although the level of ambient illumination was unlikely to vary significantly during an individual session, and in the inter-session repeatability study, the same examination lane was used to measure VA in both sessions. Further, when examining the effect of induced astigmatism, only a single measurement of VA was recorded for each condition. However, each of these sessions took approximately 50 minutes to complete, and so taking multiple measurements or using a probability function would have extended the duration significantly, which could have introduced fatigue effects. Further, only simple myopic astigmatism was tested. While this had the advantage of minimizing any blur-mediated accommodative response, the results may have differed had the circle of least confusion fallen on the retina. Atchison and Mathur38 tested the effect of different powered cross-cylinder lenses on letter VA, which would have positioned the circle of least confusion on or close to the retina. Their study observed a mean change in visual acuity of 0.35 logMAR/D, which is markedly higher than the gradients shown in Table 3. Interestingly, Wolffsohn et al.31 used plus and minus cylinders to create simple myopic and hyperopic astigmatism in presbyopic subjects, and reported gradients of 0.15 and 0.14 logMAR/D for high and low contrast targets, respectively, which are close to the values found in this investigation (see Table 3). These results suggest that the effect of imposed astigmatism on VA varies depending on whether the focal line or the circle of least confusion coincides with the retina. It should also be noted that the supplementary cylindrical lenses were introduced over the habitual refractive correction. If a subject had residual hyperopia, then they may have been accommodating when the plus cylinders were introduced, with the result that the position of the retina within the interval of Sturm might have changed during the trial.
It is unclear whether the effects of astigmatism created following the imposition of lenses is the same as that experienced over time with the typically slow development of natural refractive errors. It has been demonstrated that many subjects are capable of adapting to a blurred environment,39-41 and so the level of VA measured after just a few seconds of interposed blur may differ from the effects when the ametropia has been present for months or years. For example, Ohlendorf et al.42 reported that VA may be more adversely affected by simulated astigmatism (induced by the introduction of cylindrical lenses) when compared with habitual astigmatism. They suggested that these differences may have been due to variations in the image processing used to improve resolution in the presence of non-induced astigmatism. Indeed, both Sawides et al.43 and Ohlendorf et al.44 demonstrated adaptation to astigmatic blur. Accordingly, one might predict differences between long-standing astigmatism and a refractive error created by the imposition of cylindrical lenses, or alternatively when astigmatism is induced along the natural astigmatic axis.
In conclusion, while the DYOP and letter chart measurements were significantly correlated, wide limits of agreement and significantly different mean values were obtained (even though the latter difference of one optotype is clinically insignificant). The intra-session repeatability of the two charts was similar, with the DYOP demonstrating a slightly better, though clinically insignificant, within-subject standard deviation (0.11 vs. 0.15). The mean difference between the two sessions using the DYOP chart was significant statistically but not clinically (0.03 logMAR, 1.5 optotypes), with the DYOP demonstrating narrower limits of agreement between sessions. VA following the imposition of simple myopic astigmatism varied both with the cylinder axis and the optotype used for its quantification. Creation of with-the-rule astigmatism produced a smaller reduction in VA, when compared with against-the rule or oblique astigmatism. Furthermore, while the results for letter, Landolt C and Tumbling E optotypes were similar, the DYOP was not significantly affected by uncorrected astigmatism. Based on these findings, the current DYOP cannot be recommended for subjective refractions. Future studies should examine the effects of varying specific features of the DYOP optotype, such as gap width, stroke thickness, the number of segments and rotation speed, as well as assess whether the chart has other clinical advantages.
The authors thank Dr. Usha Govindarajulu, Department of Epidemiology and Biostatistics, SUNY Downstate Medical Center, Brooklyn, NY and Mr. Yair Raiz, HAC, Jerusalem, for their assistance with the statistical analysis.


