


To compare the performance in the Developmental Eye Movement test (DEM) and the Test of Visual Perceptual Skills (TVPS) between three groups: individuals with strabismus and amblyopia, patients with binocular and accommodative dysfunctions, and subjects with normal binocular and accommodative function.
MethodsA multicentric, retrospective study including 110 children aged 6–14 years old was conducted to investigate the potential impact of strabismus, amblyopia, and different binocular conditions in DEM results (adjusted time in vertical and horizontal parts) and TVPS (percentiles in the seven sub-skills).
ResultsNo significant differences were found in the different subtests of the vertical and horizontal DEM and all the sub-skills in the TVPS between the three groups of the study. We found high variability of performance in the DEM test between participants with strabismus and amblyopia compared with binocular and accommodative problems.
ConclusionDEM and TVPS scores have not been found to be influenced by the presence of strabismus with or without amblyopia, nor by binocular and accommodative dysfunctions. A slightly correlation tendency with horizontal DEM and degree of exotropia deviation was observed.
Visual dysfunctions such as strabismus, amblyopia and binocular vision problems, are related to abnormal visual development and function.1,2 Strabismus and amblyopia are associated with deficits in cortical processing and with an under-activation of attention networks.3–5 Moreover, inadequate visual stimulation of the brain during the critical period, caused by strabismus or significant refractive error or anisometropia, could result in insufficient development in specific areas in the ventral,6 and the dorsal streams,6 leading to disorders in spatial vision.7
Visual skills such as visual perception and eye movements require normal cortical processing and could be affected by strabismus, amblyopia and binocular vision problems. In clinical practice, children suspected to have visual perception and eye movements disorders are evaluated with specific tests. The test of visual perceptual skills (TVPS) evaluates seven subtypes of visual perception skills: Visual Discrimination, Visual Memory, Spatial Relationships, Visual Constancy, Sequential Memory, Figure-Ground, and Visual Closure,8 and has been linked to reading difficulties.9-11 The Developmental Eye Movement test (DEM) is a psychometric test that evaluates the patient's oculomotor skills12 and the risk children have of developing reading disabilities.13 However, the relationship between performance in the DEM test and reading seems to be related to visuospatial abilities,14 thereby low scores in the DEM test are more likely to be a consequence than a cause of poor reading performance.15
Subjects with amblyopia and strabismus scored similar results in the DEM test16 and in the TVPS17 compared to individuals with normal binocular vision, suggesting that compensatory mechanisms could be acting in these visual disorders.
The purpose of this study is to determine whether different binocular vision conditions affect visual perception and ocular motility outcomes assessed with the TVPS (3rd edition) and the DEM test. In this multicenter and retrospective study, two groups of strabismus with amblyopia, and binocular and accommodative dysfunctions, were compared with matched gender and age normal binocular and accommodative vision subjects in TVPS and DEM scores.
Material and methodsStudy designThis multicenter and retrospective study has been carried out with data obtained from four vision care clinics in Catalonia (Spain). The study was approved by an institutional review board (Polytechnic University of Catalonia) and conducted according to the tenets of the declaration of Helsinki. In all cases the following data were recorded for analysis: age and gender, best corrected visual acuity at far, refractive error, type of strabismus (esotropia or exotropia) evaluated with Cover Test, near and far phoria, evaluated with Cover Test, fusional vergence amplitude at far and at near, measured with prism bars, near point of convergence (NPC), evaluated with the standard push-up technique using a fixation stick, amplitude of accommodation, measured with the standard push-up technique using an accommodation target, lag of accommodation, monocular accommodative facility and binocular accommodative facility, both evaluated with +2.00/−2.00 D lenses at 40 cm. Regarding the DEM test, adjusted times in seconds for the vertical and horizontal parts were included in this study. For the TVPS test, 3rd edition, the percentiles for each sub-skill of visual perception were included. All subjects with strabismus (exotropia and esotropia) and with amblyopia were included in the strabismus and/or amblyopia group. Participants with ≥ 2 items out of normality for the binocular and accommodative data, according to Morgan's expected findings,18 were included in the binocular and accommodative dysfunction group. A control group without binocular dysfunctions was included, with matched age and gender, the criteria adopted are shown in Table 1. Sample size calculation was performed using a free online software (https://www.imim.cat/ofertadeserveis/software-public/granmo/), with alfa risk:0.05, bilateral contrast, beta risk: 0.05, number of groups:3, estimated common standard deviation:1, míninum expected difference: 1 and drop-outs rate: 0. Total sample size required was 33 for each group.
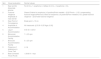
Inclusion and exclusion criteria for the participants. Inclusion and exclusion criteria for each group were decided based on the number of items exceeding the normal values. For the strabismus and amblyopia group, two items were checked to determine the inclusion and exclusion criteria.
If: Nº (item) ≥ 2 Binocular and Accommodative Dysfunction Group.
Nº (item) < 2 Control Group: group without binocular dysfunctions.
Nº (item 8 and 9) ≥ 1 Strabismus and Amblyopia group.
Data were analyzed using SPSS (IBM Corp. Released 2020. IBM SPSS Statistics for Windows, Version 27.0. Armonk, NY: IBM Cor). Data distribution was explored using Shapiro–Wilk test. When comparing more than 2 groups of variables, the homogeneity of variance was investigated using Levene's test of sphericity, and parametric (ANOVA) or non-parametric (Kruskal–Wallis) tests were employed, with the corresponding post-hoc analysis. Similarly, correlation analysis was performed with the Pearson or Spearman correlation coefficients. A p-value of 0.05 was considered to be the cut-off of statistical significance.
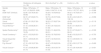
ResultsA final sample of 110 children was selected, n = 36 in the strabismus group (19 boys, 17 girls), n = 38 in the group of binocular and accommodative dysfunctions (19 boys, 19 girls) and n = 36 in the control group (18 boys, 18 girls). Data were obtained from 4 different optometric offices. Chi-Square test did not show a statistical difference between the frequency of groups and gender (χ2=0.075, p = 0.963). In Table 2, the mean age in the strabismus group was 9.07 ± 2.39 (95% CI, 8.25‒9.88), 8.48 ± 2.04 (95% CI, 7.81‒9.16) in the binocular dysfunctions group, and 8.24 ± 1.97 (95% CI, 7.57‒8.91) in the control group. Chi-Square test did not show a statistical difference between group frequency and age (χ2=0.053, p = 0.998).
Descriptive results with median ± and standard deviation (SD), below the 95% of confidence interval results. The top row shows the group, sample and gender distributions included in this study. p-values between groups are shown in the right column.
| Strabismus & Amblyopia (n = 36) | Bin & AccDysf *(n = 38) | Control (n = 36) | p-value | |
|---|---|---|---|---|
| Gender | Male= 19Female= 17 | Male= 19Female= 19 | Male= 18Female= 18 | p = 0.963 |
| Age | 9.07 ± 2.39(8.25‒9.88) | 8.48 ± 2.04(7.81‒9.16) | 8.24 ± 1.97(7.57‒8.91) | p = 0.998 |
| DEM Test† (Vertical) | 52.86 ± 20.78(45.82‒59.89) | 55.28 ± 19.04(49.02‒61.54) | 56.02 ± 16.70(50.37‒61.68) | p = 0.759 |
| DEM Test† (Horizontal) | 92.72 ± 67.90(69.75‒115.70) | 90.79 ± 45.97(75.68‒105.90) | 94.38 ± 40.81(80.57‒108.19) | p = 0.958 |
| Visual Discrimination⁎⁎ | 47.88 ± 31.35(37.28‒58.49) | 36.52 ± 27.93(37.34‒45.71) | 49.69 ± 29.27(39.79‒59.59) | p = 0.118 |
| Visual Memory⁎⁎ | 47.19 ± 30.66(36.81‒57.56) | 41.99 ± 29.19(32.40‒51.59) | 56.05 ± 31.48(45.51‒54.08) | p = 0.137 |
| Spatial Relationship⁎⁎ | 65.84 ± 24.85(57.43‒74.25) | 55.86 ± 31.48(45.52‒66.21) | 59.16 ± 27.93(49.71‒68.61) | p = 0.309 |
| Visual Constancy⁎⁎ | 40.21 ± 32.20(29.32‒51.11) | 36.39 ± 32.78(25.62‒47.17) | 39.46 ± 32.22(33.37‒45.55) | p = 0.753 |
| Visual Sequential Memory⁎⁎ | 46.51 ± 29.63(36.49‒56.54) | 43.97 ± 32.05(33.43‒54.50) | 59.14 ± 26.60(50.14‒68.14) | p = 0.068 |
| Fig.-Ground⁎⁎ | 47.16 ± 29.19(37.28‒57.04) | 40.47 ± 25.59(32.06‒48.88) | 47.60 ± 29.01(37.79‒57.42) | p = 0.469 |
| Visual Closure⁎⁎ | 47.33 ± 30.86(36.89‒57.77) | 40.92 ± 30.81(30.79‒51.04) | 50.14 ± 28.18(40.60‒51.70) | p = 0.401 |
Bin & AccDysf.
In order to study the possible difference between the three groups in the study, a one-way linear polynomial ANOVA was used, controlling the sphericity with Levene's test (ε). No statistically significant differences were found between groups in the results of the vertical DEM, (F(2,107) =0.277, p = 0.759), and horizontal DEM, (F (2,107) =0.043, p = 0.958). In Fig. 1 are shown the DEM test results between the three groups of this study.
 and horizontal (right image) between the three groups of study in the DEM test. Median is represented as a line and standard deviation in color for each group. Strabismus= Strabismus and Amblyopia Group, Bin & Acc Dysf= Binocular and Accommodative Dysfunction Group, Control= Non-Binocular and Accommodative Dysfunction.")
Adjusted time in vertical (left image) and horizontal (right image) between the three groups of study in the DEM test. Median is represented as a line and standard deviation in color for each group. Strabismus= Strabismus and Amblyopia Group, Bin & Acc Dysf= Binocular and Accommodative Dysfunction Group, Control= Non-Binocular and Accommodative Dysfunction.
The analysis using ANOVA between groups revealed no statistically significant differences in all seven perceptual skills: Visual Discrimination, (F (2,107) = 2.18, p = 0.118), Visual Memory, (F (2,107) = 2.02, p = 0.137), Spatial Relationships, (F (2,107) = 1.18, p = 0.309), Visual Constancy, (F(2,107)=0.28, p = 0.753), Visual Sequential Memory, (F(2,107)=2.75, p = 0.068), Fig.-Ground, (F(2,107)=0.76,p = 0.469), and Visual Closure, (F(2,107)=0.92, p = 0.401). Fig. 2 shows the percentiles for each sub-skill in the TVPS test for each group. Tukey's HSD for multiple comparisons did not find any significant differences between groups with all the data analyzed.

The correlation between DEM and TVPS was studied in the strabismus group (n = 23 for exotropia, n = 13 for esotropia) to see if the magnitude of strabismus could be directly related to the test performance. Spearman correlations were computed (rho). In the exotropia group no significant correlation were found between vertical DEM (r = 0.333, p = 0.120), horizontal DEM (r = 0.367, p = 0.084), Visual Discrimination (r = 0.161, p = 0.463), Visual Memory (r=−0.267, p = 0.217), Spatial Relationships (r = 0.246, p = 0.257), Visual Constancy (r=−0.030, p = 0.089), Visual Sequential Memory (r=−0.058, p = 0.793), Fig.-Ground (r=−0.143, p = 0.516), Visual Closure (r=−0.282, p = 0.193) and the magnitude of strabismus in prism diopters. In the esotropia group a similar correlation trend was found, in the vertical DEM (r = 0.365, p = 0.217), horizontal DEM (r = 0.334, p = 0.262), Visual Discrimination (r = 0.01, p = 0.972), Visual Memory (r = 0.250, p = 0.406), Spatial Relationships (r = 0.130, p = 0.668), Visual Constancy (r = 0.149, p = 0.621), Visual Sequential Memory (r = 0.107, p = 0.725), Fig. Ground (r=−0.144, p = 0.635), Visual Closure (r=−0.101, p = 0.738). The correlation of the DEM test in both exotropia and esotropia groups was plotted in Fig. 3, with only a trend of correlation between exotropia magnitude and horizontal DEM (r = 0.367, p = 0.084).
Discussion and the degree of exotropia and esotropia (in prism diopters). Correlations (Spearman rho) are shown in the upper left margin.")
In this multicentric and retrospective study, a comparison of groups with different visual conditions has been carried out. No significant differences were found between DEM and TVPS test results in the three study groups. The results of this study are similar to those obtained by other authors,17 and it seems that regardless of the type of visual problem (strabismus, amblyopia or binocular and accommodative dysfunctions) the results of DEM and TVPS test are similar to the those corresponding to a normal visual system. Strabismus and amblyopia are neurodevelopmental disorders that have been associated with deficits in higher visual processing,19 visual attention,20 and visuomotor behavior such as saccadic eye movements,21 and fixation stability.22
In the present study, no differences were found in DEM and TVPS results between strabismus and age-matched normal visual development or binocular and accommodation dysfunction groups. However, a higher coefficient of variation was found in the strabismus group in the horizontal part of DEM (73.23%), following the binocular and accommodation dysfunction group (50.63%) and control group (43.24%). The same trend with the vertical part of DEM was found (39.33%, 34.45% and 29.82%), respectively. No statistically significant correlation between adjusted time in the DEM test and the degree of strabismus was found, but a slight tendency of relationship between horizontal DEM and magnitude of exotropia was found (r = 0.367, p = 0.084). This needs to be confirmed with a larger sample but opens a research question about the influence of the degree of exotropia and the oculomotor ability of the DEM test.
Some studies have shown that reading difficulties could be caused by binocular dysfunctions such as convergence insufficiency,23 although successful treatment of convergence insufficiency seems to not lead to an improvement in reading performance.24 Moreover, it seems that there is an association between convergence insufficiency and Attention Deficit Hyperactivity Disorder (ADHD) problems.25 However, in this study, there were no differences between participants with binocular and accommodative dysfunctions compared with participants with normal optometric values.
In the TVPS, and similarly to the DEM test, the study showed no significant differences between the three groups. Other authors showed reduced TVPS values in Visual Discrimination, Spatial Relationship, Visual Constancy, Figure-Ground and Visual Closure, in children with handwriting difficulties.26 Comparable results have been reported in young adults with learning disabilities, as they obtained lower TVPS results in the different subtests studied.27 Some studies present differences in methodology that could explain the discrepancy between their results and the those obtained here. In the current study, learning disabilities were not examined as an independent group, moreover, age range of the participants differed across studies. One study found small but significant correlations between the non-motor visual perception test and the visual-motor integration test, but did not find a relationship between the non-motor test and the motor ability tests, and concluded that the tests of visual perception, visuomotor integration, and motor capacity measured different abilities.28
According to Langton.29, all the sub-skills in the TVPS may be related to each other, and concluded that visual skills need contextual information in the recognition of patterns, and this may be one of the causes of the similarity in results between the different sub-skills in TVPS. Therefore, it is difficult to isolate each sub-skill in this test and make conclusions for diagnosis. In this study, researchers did consider the presence of diplopia in any of the strabismus cases, nor the presence of sensory-motor adaptations typical of strabismus. These adaptations could allow for normal visual perception and could explain the results obtained in our study regarding the TVPS.
Interestingly, DEM test performance in participants with strabismus with or without amblyopia showed great variability compared to the group with binocular and accommodative problems. Even less variability in DEM test results was observed in participants without any visual development problem. According to the results of this study, these findings cannot be explained in relation to the magnitude of the ocular deviation.
In conclusion, there are no significant differences in performance in clinical tests such as the DEM and TVPS tests between strabismus, amblyopia, binocular and accommodative dysfunction, and subjects with normal binocular vision. It seems that subjects with accommodative and binocular dysfunctions, strabismic or non-strabismic, can compensate for their abnormal visual development and reach normal visual function in the specific areas assessed here. However, a correlation trend seems to exist between the degree of exotropia and the performance in the horizontal DEM test. No correlation was observed between magnitude of deviation and test results in esotropia participants.
Authors contributionJ.G. and N.L. designed the study, M.P.T.& M.B.C. compiled the data, M.P.T.,J.G, N.L., B.S.G., C.R.G. and M.A. wrote the manuscript, M.A. performed the statistical analysis .N.L, J.G., B.S.G., C.R.G. and M.A. review the final version of the manuscript.
FundingThis research received no external funding
Institutional review board statementThe study was conducted in accordance with the Declaration of Helsinki, and approved by an institutional review board of the Polytechnic University of Catalonia (Spain, Catalonia).


