


To develop and assess the agreement between the 3 newly made numbers contrast sensitivity charts and the MARS contrast sensitivity chart (MARS) in contrast sensitivity measurement.
MethodsWe developed 3 numbers contrast sensitivity charts for right, left and both eyes. Two hundred subjects were assigned to read numbers 0-9 for determining the degree of difficulty. Selected seven numbers were randomly arranged and the contrast of each number was decreased by the constant factor of 0.04 log units in the units as in the MARS. We assigned 112 subjects with visual acuity range from 20/480 to 20/20 to test once with the new chart and then with MARS Chart monocularly and binocularly by random order. Bland-Altman analysis for comparing two charts was performed.
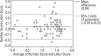
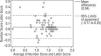
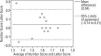
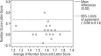
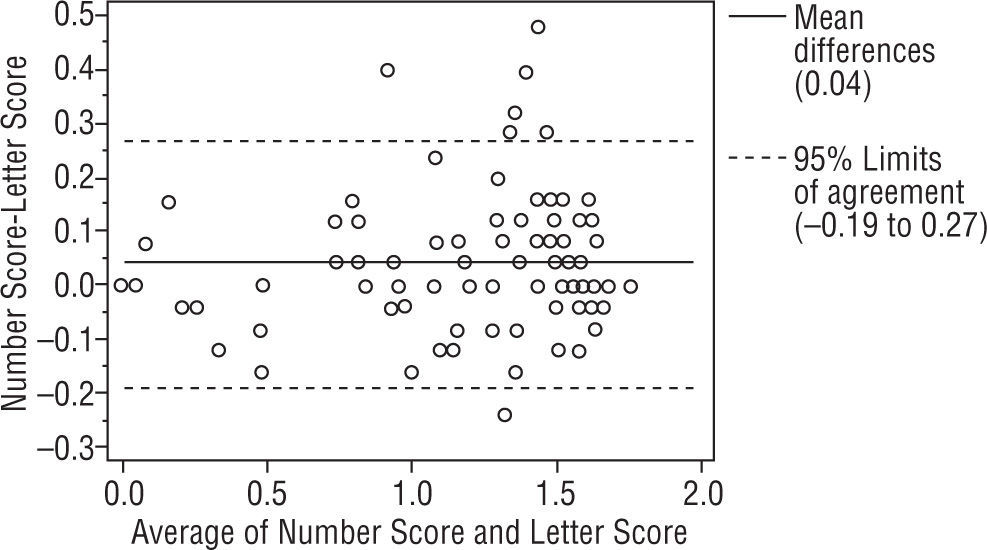
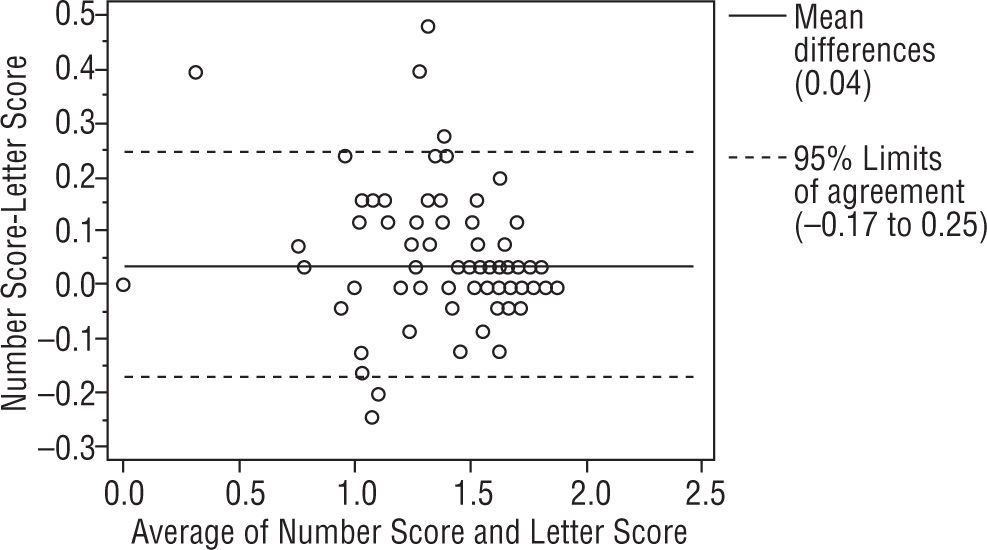
ResultsBland-Altman analysis between 2 charts showed the mean differences were 0.04, 0.03, 0.04 log CS and the 95% limit of agreement (LOA) of the bias were (+0.26, −0.19), (+0.26, −0.20), (+0.25, −0.17) log CS for right, left and binocular. The Bland-Altman plot indicates a good concordance in 3 charts.
ConclusionsThese charts show reasonable agreement and can be used interchangeably with the MARS. It is helpful for Thai people who can only read numbers in doing the test. We can use them in routinely contrast sensitivity measurement.
desarrollar y evaluar la concordancia entre los tres nuevos tests de la sensibilidad al contraste y el test de la sensibilidad al contraste MARS en la medición de la sensibilidad al contraste.
Métodosdesarrollamos 3 tests de números de sensibilidad al contraste para los ojos derecho, izquierdo y ambos. Se asignaron 200 sujetos para leer números del 0 al 9 con el fin de determinar el nivel de dificultad. Los siete números seleccionados se dispusieron de manera aleatoria y el contraste de cada número se redujo según el factor constante de 0,04 unidades logarítmicas en el mismo grado que en el MARS. Asignamos a 112 sujetos con un intervalo de agudeza visual de 20/480 a 20/20 para el examen con el gráfico nuevo y con el MARS después, monocular y binocularmente, en orden aleatorio. Se incluyó un análisis Bland-Altman para comparar ambos tests.
Resultadosel test Bland-Altman entre ambos tests mostró un sesgo (diferencia de las medias) de 0,04, 0,03, 0,04 de CS logarítmica y el límite de concordancia (LOA) del 95% del sesgo fue de (+0,26, −0,19), (+0,26, −0,20),(+0,25, −0,17) de CS logarítmica para el ojo derecho, el izquierdo y ambos. El esquema de Bland-Altman demuestra una buena concordancia entre los 3 tests.
Conclusionesestos tests muestran una concordancia razonable y pueden utilizarse indistintamente con el MARS. Es útil para personas tailandesas que solamente pueden leer números al hacer el examen. Pueden utilizarse en la medición habitual de la sensibilidad al contraste.
In everyday life we inevitably have to develop such activities as reading performance,1 ambulation mobility,2,3 driving4 and face recognition.5 People have to be able to identify objects at low contrast sensitivity (CS) to perform these activities. Contrast sensitivity is one of the spatial visual functions besides visual acuity that we usually measure. It is the ability to discriminate between light and dark on two adjacent areas.6 People with different ages and ocular diseases usually have different contrast sensitivity results. Measuring the contrast sensitivity not only lets us know the visual performance of each person but also helps in detecting and monitoring ocular diseases as cataract,7 glaucoma,8 optic nerve diseases9 and others.
There are two methods of expressing contrast sensitivity. One is Periodic pattern (sine-grating)10 and the other is Non-periodic pattern (letters).11 One of the Non-periodic pattern that has been used as gold standard is the Pelli Robson contrast sensitivity chart.12 Due to the large size of the chart, Arditi developed the MARS letter contrast sensitivity chart by using the same technique but modifying the size of the chart and the scoring system.13 The chart is hand-held (size 23×36cm). The contrast range is from 0.04 to 1.92 log units with an increment of 0.04 log units each. While in the Pelli-Robson chart, the letters are arranged in triplets of equal contrast, the MARS chart comes in three charts with a different sequence of Sloan letters. The MARS is hand-held and viewable at 41–59cm with or without +2.00 DS reading add in presbyopia.
The results indicate that the MARS has a test-retest reliability equal to or better than the Pelli-Robson test and comparable responsiveness.14 The strong correlation between the tests provides evidence that the MARS is valid and can be used as an alternative to the Pelli-Robson CS chart.15,16
In Thailand, we developed the numbers contrast sensitivity chart. This test set is comprised of three charts of Sloan equivalent numbers. Each chart is similar to the MARS. For example, the chart is viewed at 50cm with the subject wearing an addition of +2.00 DS. Each number also has the same contrast as the MARS. The scoring procedure of this test is similar to the MARS. There is no published data on the validity or reliability of contrast sensitivity test with this test set. As Thais do not use English, the MARS has serious limitations. We developed this new variation by using numbers instead of the letters that are used in the MARS.
The purpose of this study is to assess the agreement between this new numbers contrast sensitivity chart and the MARS among subjects with variety of diagnoses.
Material and methodsThe study protocol was approved by the Ethics Committee of the faculty before study commencement. The study followed the tenets of the Declaration of Helsinki. Informed consent was obtained from all patients.
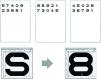
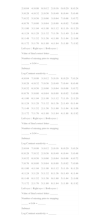
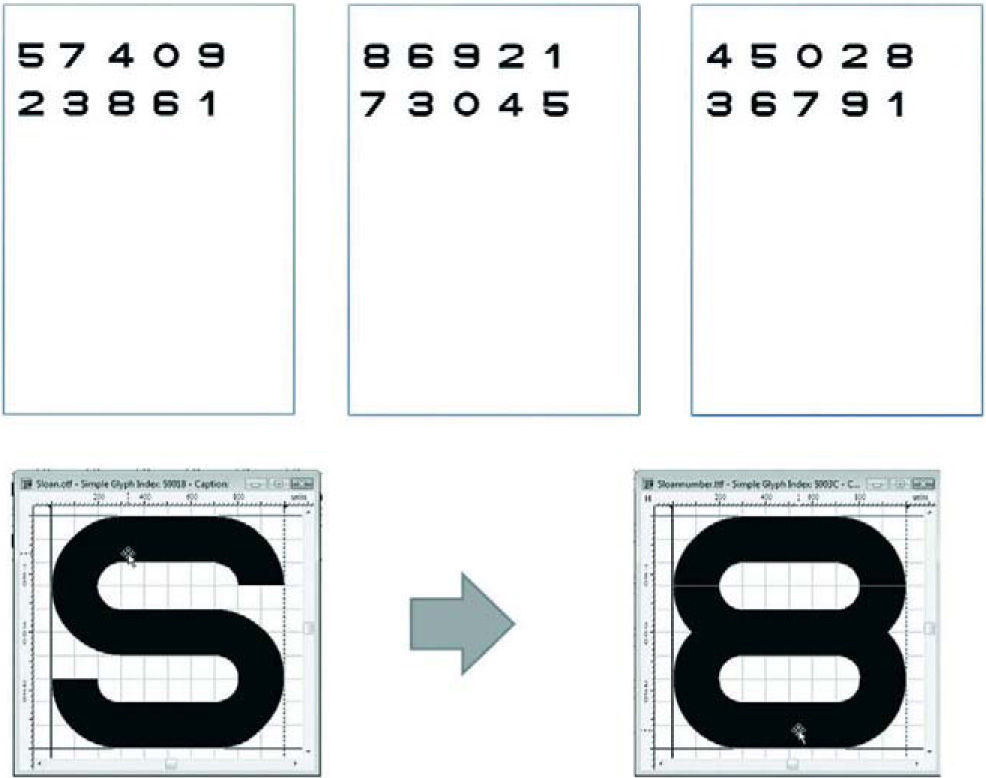
The designation of Sloan equivalent numbersWe created ten highest contrast numbers from 0–9 that were comparable to Sloan letters using software Font Creator 5.0. Each number was designed by using 5×5 minutes of arc with 17.5mm height identical to each of the Sloan Letters in the MARS Letters Chart. All numbers were designed to subtends 2° at 50cm. They were printed on 9×14 inches (22.8×35.6cm) white paper by using the Fuji-Xerox printer model (Docucolor 252) as shown in Figure 1.
Two hundred participants with a variety of clinical diagnoses were recruited from the outpatient clinic of the Department of Ophthalmology, King Chulalongkorn Memorial Hospital. All participants were required to have at least a visual acuity for seeing the object at 0.5m. Testing occurred in a room with constant illumination (≥ 85cd/m2) in order to lessen the shadows. The participants were asked to read aloud at 0.5m with or without reading add (+2.00 DS) in presbyopic eyes with their right eyes, left eyes and then with both eyes. The legibility of each of the numbers was collected as percent of correct responses at threshold as Table 1.
We did the same as the test legibility of numeric optotypes as used to test for Sloan letters.17 Only numbers that had the percentage of correct responses range from 90–97% were selected. We then selected 7 numbers as 0, 2, 3, 4, 5, 7, 8 from this step. We excluded numbers 6 and 9 because of their low percentage of correct response. We also excluded number 1 because it disappeared when printed in low contrast. We then randomly arrayed numbers 0, 2, 3, 4, 5, 7, 8 within 8 rows and 6 columns in the same fashion as the MARS Letters chart.
All numbers were printed on 9×14 in (22.8×35.6cm) white paper by using the Fuji-Xerox printer model (Docucolor 252). Each number was 17.5mm height and with 0.04 log unit decrements of contrast identical to Sloan Letters in the MARS chart. The first number of each chart would have the highest contrast and was put on the upper left of each chart. The test is intended for testing at 0.5m, at which distance each letter subtends 2°. Each chart was calibrated by using the spectrophotometer for the constant contrast. The recommended illumination is at least 85cd/m2, the same as in the Pelli-Robson Chart. Each chart would be read from left to right across the chart. Due to the handy size of the test it made easy to perform measurements even at the slit-lamp desk.
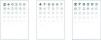
Finally, we developed three charts: for right eye, left eye, and binocular testing as shown in Figure 2.
Scoring system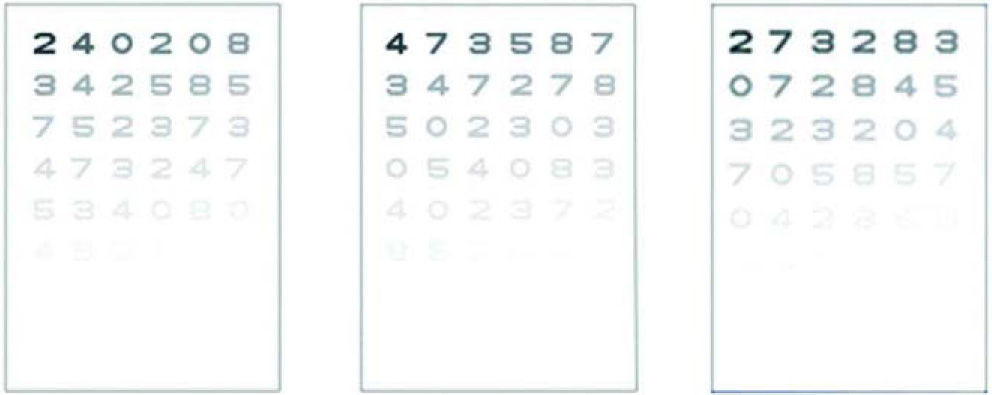
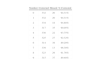
We used the Sloan equivalent numbers with declining contrast across and down the chart. The contrast decrement that we used was 0.04 log units letter by letter. The tests were set to be stopped when the patients had made two consecutive number errors. The score reported with the log CS of the final correct letter, minus 0.04 for any errors before that number, as shown in Table 2.
Scoring Sheets for Right, Left and Both eyes
| 2□0.04 | 4□0.08 | 0□0.12 | 2□0.16 | 0□0.20 | 8□0.24 |
| 3□0.28 | 4□0.32 | 2□0.36 | 5□0.40 | 8□0.44 | 5□0.48 |
| 7□0.52 | 5□0.56 | 2□0.60 | 3□0.64 | 7□0.68 | 3□0.72 |
| 4□0.76 | 7□0.80 | 3□0.84 | 2□0.88 | 4□0.92 | 7□0.96 |
| 5□1.00 | 3□1.04 | 4□1.08 | 0□1.12 | 8□1.16 | 0□1.20 |
| 4□1.24 | 8□1.28 | 2□1.32 | 7□1.36 | 3□1.40 | 2□1.44 |
| 8□1.48 | 7□1.52 | 5□1.56 | 4□1.60 | 5□1.64 | 2□1.68 |
| 0□1.72 | 5□1.76 | 8□1.80 | 4□1.84 | 5□1.88 | 7□1.92 |
| Left eye □ Right eye □ Both eyes □ | |||||
| Value of final correct letter: ______ | |||||
| Number of missing prior to stopping | |||||
| ______ × 0.04 = ______ | |||||
| Subtract | |||||
| Log Contrast sensitivity = ______ | |||||
| 4□0.04 | 7□0.08 | 3□0.12 | 5□0.16 | 8□0.20 | 7□0.24 |
| 3□0.28 | 4□0.32 | 7□0.36 | 2□0.40 | 7□0.44 | 8□0.48 |
| 5□0.52 | 0□0.56 | 2□0.60 | 3□0.64 | 0□0.68 | 3□0.72 |
| 0□0.76 | 5□0.80 | 4□0.84 | 0□0.88 | 8□0.92 | 3□0.96 |
| 4□1.00 | 0□1.04 | 2□1.08 | 3□1.12 | 7□1.16 | 2□1.20 |
| 8□1.24 | 5□1.28 | 7□1.32 | 0□1.36 | 2□1.40 | 0□1.44 |
| 7□1.48 | 5□1.52 | 2□1.56 | 5□1.60 | 3□1.64 | 8□1.68 |
| 2□1.72 | 7□1.76 | 4□1.80 | 3□1.84 | 4□1.88 | 8□1.92 |
| Left eye □ Right eye □ Both eyes □ | |||||
| Value of final correct letter: ______ | |||||
| Number of missing prior to stopping | |||||
| ______ × 0.04 = ______ | |||||
| Subtract | |||||
| Log Contrast sensitivity = ______ | |||||
| 2□0.04 | 7□0.08 | 3□0.12 | 2□0.16 | 8□0.20 | 3□0.24 |
| 0□0.28 | 7□0.32 | 2□0.36 | 8□0.40 | 4□0.44 | 3□0.48 |
| 3□0.52 | 0□0.56 | 3□0.60 | 2□0.64 | 0□0.68 | 4□0.72 |
| 7□0.76 | 0□0.80 | 5□0.84 | 8□0.88 | 5□0.92 | 7□0.96 |
| 0□1.00 | 4□1.04 | 2□1.08 | 8□1.12 | 5□1.16 | 8□1.20 |
| 4□1.24 | 3□1.28 | 5□1.32 | 8□1.36 | 0□1.40 | 4□1.44 |
| 0□1.48 | 8□1.52 | 3□1.56 | 0□1.60 | 5□1.64 | 2□1.68 |
| 7□1.72 | 2□1.76 | 5□1.80 | 8□1.84 | 3□1.88 | 8□1.92 |
| Left eye □ Right eye □ Both eyes □ | |||||
| Value of final correct letter: ______ | |||||
| Number of missing prior to stopping | |||||
| _____ × 0.04 = ______ | |||||
| Subtract | |||||
| Log Contrast sensitivity = ______ | |||||
We recruited 112 subjects from the outpatient clinic of the King Chulalongkorn Memorial Hospital, Thai Red Cross Society, Bangkok, Thailand. These patients carried a variety of diagnoses. They were all required to be able to read English letters and understand the test well. Demographics data such as sex, age, diagnosis and visual acuity were collected. We randomly let each patient read once with the MARS and then the numbers chart by right, left and both eyes consecutively. All tests were done in the same environment with constant illumination (≥ 85cd/m2). We used the same scoring procedure for both charts. The scores were collected in terms of Log contrast sensitivity. Since the contrast decrement used is 0.04 log units letter by letter, the score was the log CS of the final correct letter, minus 0.04 for any errors before that as shown in Table 2. The test stopped when the patient made two consecutive errors. After we got the scores from each eye and each test, the mean differences between two charts were plotted in a Bland-Altman graphic display.
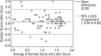
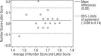
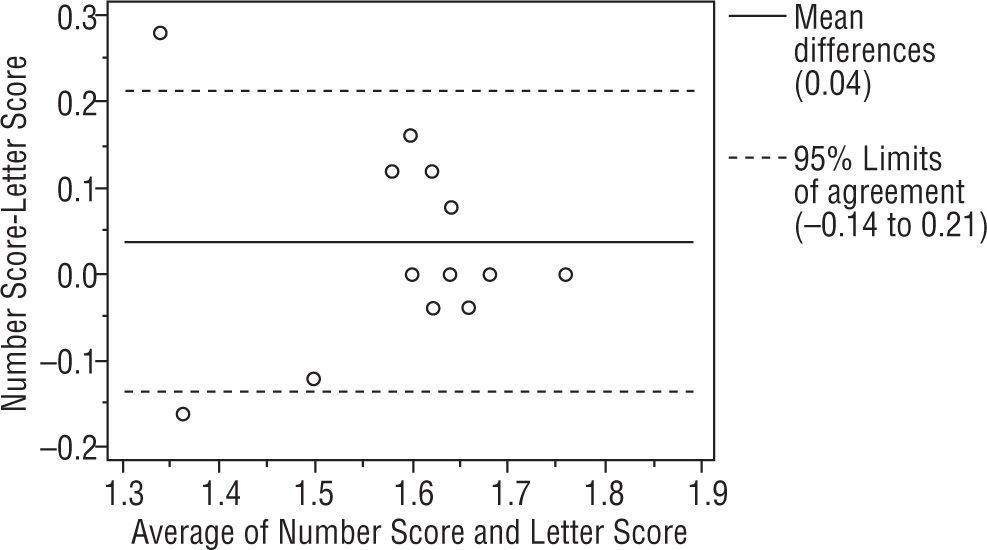
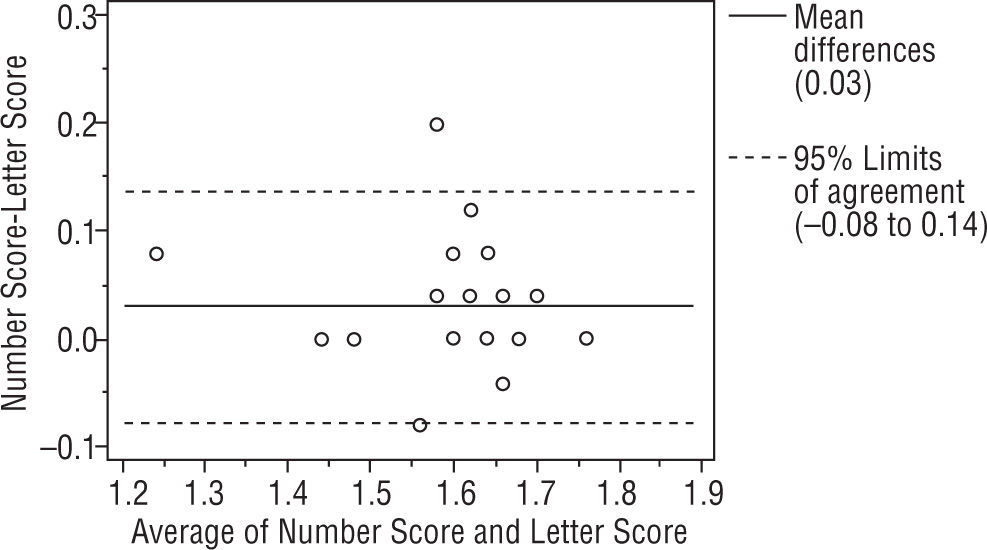
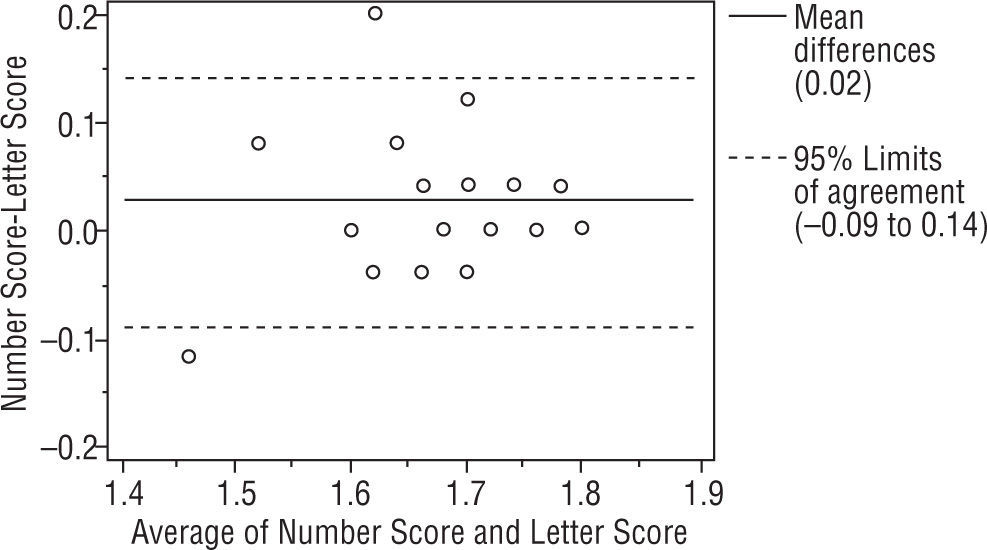
ResultsWe studied 112 subjects from the outpatient clinic. There were 51 males and 61 females with mean age 48±18 (range 11 to 80 years old). The visual acuity ranged from 20/480 to 20/20. There were 28 normal subjects (25%), 21 Retinal diseases (18.75%), 21 optic nerve diseases (18.75%), 29 Corneal diseases (25.89%), 9 lens abnormalities (8.03%) and 4 others patients (3.57%). All had been diagnosed by ophthalmologists on their previous visit. The Bland-Altman analysis between 2 charts showed a mean difference of 0.04, 0.03, 0.04 log units and the 95% CI of the mean differences were (+0.27, −0.19), (+0.26, −0.20), (+0.25, −0.17) for right, left and binocularly. We found that 93.75%, 94.64%, 94.64% of the mean differences between two charts were within 95% CI and there were 7, 6, 6 subjects from right, left and binocular chart that had a mean difference out of the limits of agreement (95% CI) as shown in Figures 3, 4 and 5. For the normal subjects (BCVA ≥ 20/25), we also did the Bland-Altman analysis between 2 charts. A mean difference of 0.04, 0.03, 0.02 log units and the 95% CI of the mean differences were (+0.21, −0.14), (+0.14, −0.08), (+0.14, −0.09) for right, left and binocularly. Only 2 subjects from right, left and binocular chart had a mean difference out of the limits of agreement (95% CI) as shown in Figures 6, 7 and 8.

Dougherty et al reported the MARS showed excellent agreement with the Pelli-Robson chart (95% LoA of±0.21 log units) for all subjects, and the MARS was similarly repeatable (95% LoA±0.20 log units) to the Pelli-Robson chart (95% LoA±0.20 log units) among all subjects.14 Because of the handy chart and the easier scoring system of the MARS, we tried to use the MARS in contrast sensitivity measurement among Thai people. Nevertheless many Thai cannot read English so it is impossible for them to perform the test. We have therefore been trying to develop a new chart that is comparable to the MARS by using the numbers instead of letters.
In this study we found good agreement between the MARS and the numbers contrast sensitivity chart from the Bland-Altman plot. These numbers charts were able to discriminate between different patients groups. The contrast sensitivity (CS) was lower for patients with glaucoma (1.25±0.49 log CS) and age-related Macular Degeneration (AMD) (1.18±0.48 log CS) than normal (1.62±0.16 log CS). These group differences with the numbers test were comparable to those obtained with the MARS (1.21±0.47 log CS [glaucoma], 1.13±0.47 log CS [AMD], 1.58±0.15 log CS [normal]). Also the results of the MARS in our study were similar to study by Sharon A. Haymes et al, as the contrast sensitivity was lower for patients with glaucoma and AMD than normal (mean Mars CS = 1.62 [normal], 1.56 [glaucoma], and 1.03 logCS [AMD]; P < 0.001).15 Most of the data in Bland-Altman Plot was within the limits of agreement. There were only 7, 6, 6 data for Right eye, Left eye and both eyes respectively that exceeded the limits of agreement.
We did not put 6 and 9 in each chart due to the higher difficulty in identifying those numbers. This type of problem occurred in both Pelli Robson and MARS where misinterpretations of “C” for “O” and “O” for “C” were found. However, Elliot et al demonstrated the value of accepting a response of “C” for “O” and “O” for “C” on the Pelli-Robson test.18 Dougherty et al found that CS scores from the MARS demonstrated improved repeatability when “C” and “O” miscalls were accepted with 95% limits of agreement of ±0.20 log units and ±0.22 log units. These results suggest that there is value in accepting “C” for “O” and “O” for “C” responses on the MARS.9
The design of MARS letter contrast sensitivity was adopted in this process. We created three handy charts for right, left and binocular because we needed to lessen the memory effect of the measurement subjects. For statistically significance in the percent of correct responses, we might need more than 200 subjects that had varieties of diagnosis that would help in making a definite decision for which number would be selected while the difference between them was small.
The contrast sensitivity scoring procedure was adopted from the MARS. The number-by-number scoring and the stop sign are the same as the MARS. But we should keep in mind that the misinterpretation can occur if the chart was not correctly printed with their exact percentages of contrast. The printer itself also needs frequent calibration of the percentage of contrast. The quality of the printing is the other important issue that needs to be considered. The reason that we used uncoated white paper was it lessens reflection and glare. The durability of the printing and paper are also important matters. We do not allow the patients to touch the chart while doing the tests.
The test-retest repeatability of this chart needs to be studied further. The difference of the means that exceed the limits of agreement may be due to the limitation of the subjective test. If the patients were encouraged to read the score would be higher. Even though we tried to set up the constant illumination in the exam room, the printing material of test could be affected in terms of reflection. So tilting the test chart might make the subjects miss the numbers. The durability and the permanence of the test is the other aspect that needs to be investigated.
ConclusionsThese 3 numbers contrast sensitivity charts show reasonable agreement and can be used interchangeably with the MARS. We also demonstrated the discriminability between each group of the patients. It is useful for Thais who can read Arabic numbers but not English letters and the test can be used routinely for contrast sensitivity measurement. In addition the cost of this test set is less than the MARS. Not only can the number charts be adopt for use in contrast measurement but symbols as pictures can possibly also be used.
Financial supportThe Ratchadapiseksompotch fund, Faculty of Medicine, Chulalongkorn University, Bangkok, Thailand.
Conflicts of interestThe authors declare no conflicts of interest in the study.
The study was funded by the Ratchadapiseksompotch fund, Faculty of Medicine, Chulalongkorn University, Bangkok, Thailand.


